

Contents
- What Is Divergence In Technical Analysis?
- Divergence Applications in Technical Analysis
- What Is a Bearish Divergence? When is the Market Bearish?
- What Is the Difference Between Bearish and Bullish Divergence?
- How to Recognize a Bearish divergence?
- What Actions Should be Taken in Bearish Divergence?
- Types of Divergence in Technical Analysis
- What Is Bearish Divergence?
- Confirmation and Divergence
- Commonly Used Technical Indicators in the Detection of Divergence
- How to Use Hidden Divergence in Technical Analysis
- FAQs
What Is Divergence In Technical Analysis?
Divergence in technical analysis is one of the appropriate methods for predicting price movements. In this way, divergence signals occur whenever the direction of movement in the price chart and the technical indicator are opposite. Based on this, it is possible to predict changes in the trend and direction of price movement. Simply put, the movement of a technical indicator (for example, oscillator, RSI, or MACD) or any other data against the direction of the price chart causes the formation of divergence signals.
The conflict between the direction of price movement and technical indicators is called divergence, which can predict potential trends and price rotation changes. Divergence is considered a signal of traders' doubts about the current price trend. In all financial markets, such as the stock market, forex, gold, cryptocurrencies, futures, CFD, etc., the use of technical indicators and identification of divergences increases the accuracy and reliability of the technical analysis, and traders can trade with more confidence.
Divergence Applications in Technical Analysis
Divergence, as one of the tools of technical analysis, moves with the trend, and by using it, you can predict the future behavior of the market. The most widely used divergence is in determining trend changes and price rotation. It is also used to determine support and resistance levels simultaneously with Fibonacci levels, etc. Detecting strong divergences in the price chart and technical indicators can increase the accuracy and validity of the analysis and provide more trading opportunities for the trader.
What Is a Bearish Divergence? When is the Market Bearish?
A bearish market is a defined period when supply exceeds demand, confidence in the market is low, and prices fall. Trading in a bearish market can be difficult, especially for less experienced traders who have yet to experience many up-and-down trends. However, these markets also provide good opportunities for professionals.
If you have a long-term investment strategy, you can buy during a dip to make a big profit when the market trend changes. Traders with a short-term strategy can also make good profits through technical analysis and identifying the ceiling and floor of the descending channel through fluctuations in the market.
What Is the Difference Between Bearish and Bullish Divergence?
The opposite of bearish divergences is bullish divergence, which refers to a period in which the market sentiments governing the market and investors are optimistic. Rising prices create positive market sentiment in the bullish divergence and increase traders' confidence.
In this way, the desire to invest in such a market increases, which causes a further increase in prices. Many factors influence whether the market is bearish or bullish. Time frames, different perspectives, opinions, and events can influence a person's outlook on an asset.
Also Read: What Is Hidden Bullish Divergence
How to Recognize a Bearish divergence?
Unlike what bullish divergence occurs, a 20% price drop can be the most important sign of a bearish divergence. Increasing supply and decreasing demand, hearing negative news, whales trying to reduce the price, and other factors can be signs of the beginning of a downward trend.
They are predicting when a bearish divergence will end and where the price floor is also difficult because many factors affect the market. For such predictions, you need a lot of analytical power and experience. Also, the state of emotions in the market, news, events, fundamental and sentimental issues, and technical discussion is effective in identifying the end of the bearish market trend.
What Actions Should be Taken in Bearish Divergence?
Identifying the Factor of Price Reduction
If the price of an asset starts to decrease, the first and best step is to identify the factor of this price decrease. Is this a price correction and stabilization after a long bullish run? Was this a pump-and-dump scheme that you fell for? Does it relate to security and third-party issues related to the property? Researching and learning about the real reasons for falling prices will help you decide whether or not to hold an asset.
Investigate Asset Price History
Assets like Bitcoin have experienced dramatic price falls, but a pattern has repeatedly been repeating itself. In the crypto market and if supported by a strong project, this recommendation is the best help to keep or discard the desired asset because the recovered value will always be much higher than the previous value.
Act Fast
Act fast to take advantage of the current bearish divergence. Sell your asset at the current price (high price) and buy it again if the asset price falls. In this case, you will be able to have much more tokens than in the previous period, and you will get better profit in the future bullish period. This option will have many risks, and investors should be aware of the risk of losing money.
Preservation of Assets
If you are a serious saver, preserve your assets and buy more. This option is suitable for obtaining long-term rewards and investing money that does not affect the quality of your life.
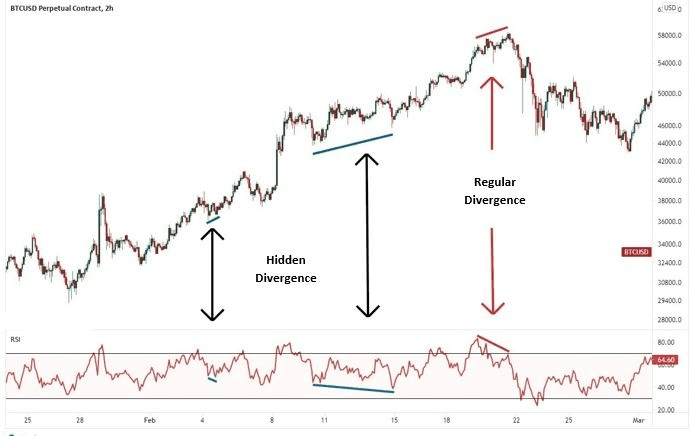
Types of Divergence in Technical Analysis
In general, we have two types of Regular Divergence (RD) and Hidden Divergence (HD) in technical analysis. Each is divided into 2 groups, Bearish and Bullish divergences, so we have 4 important types of divergence:
- Regular Bullish Divergence: the possibility of starting an upward trend
- Regular Bearish Divergence: the possibility of starting a downward trend
- Hidden Bullish Divergence: the possibility of the end of price reduction (correction) → continuation of the upward trend
- Hidden Bearish Divergence: the possibility of the end of the temporary price increase → continuation of the downward trend
This article will discuss Bearish Divergences, both Regular and Hidden.
What Is Bearish Divergence?
In Bearish Divergence (both Regular and Hidden), “price ceilings” are important for us. This way, the new price ceiling is lower than the previous one, and the other chart is the opposite. It warns of the beginning or continuation of the downward trend and price reduction, and it will represent the resistance line.
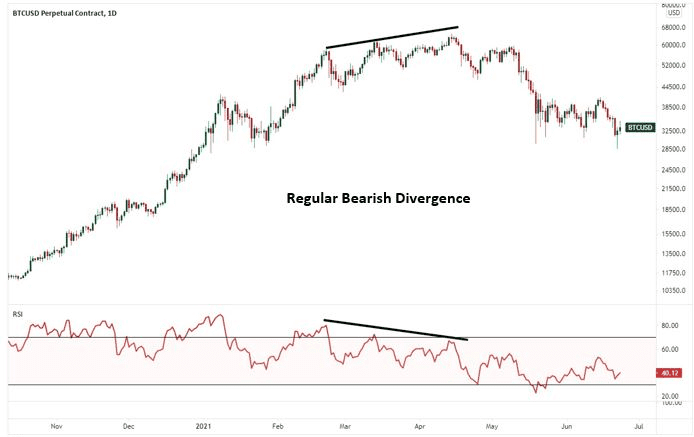
Bearish Regular Divergence (RD–)
According to the figure below, when a new price ceiling is created higher than the previous ceiling in the price chart, but in the technical indicator chart, the new ceiling is lower than the previous ceiling, we have “Bearish Regular Divergence.”
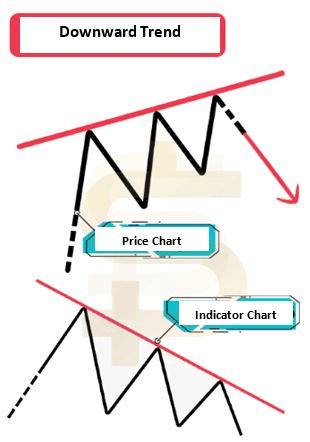
This situation indicates the weakening of the power of buyers in front of sellers. In fact, according to the current conditions, there is no potential to break the resistance line, and we will probably face the end of the upward trend and the beginning of the downward trend.
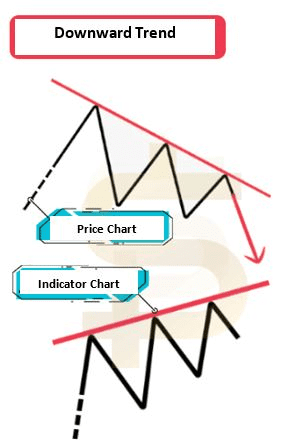
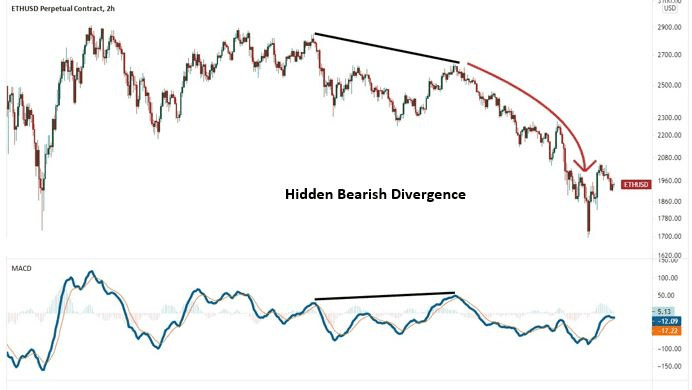
Bearish Hidden Divergence (HD–)
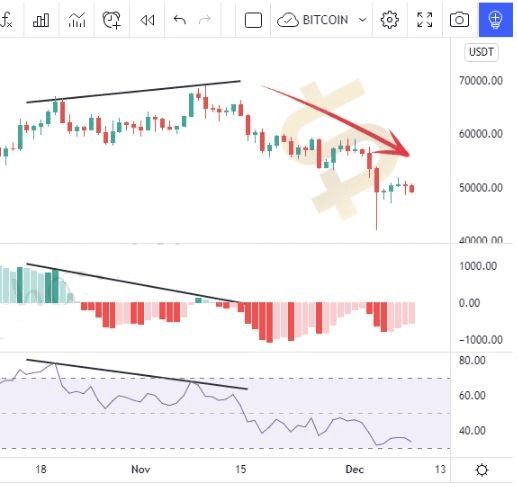
According to the figure below, when the new price ceiling is lower than the previous ceiling in the price chart, but the new ceiling is higher than the previous ceiling in the indicator chart (that is, the price chart is bearish, but the indicator chart is bullish), we have “Bearish Hidden Divergence.” HD is a signal of the continuation of the downward trend, and the increase in prices should be considered only a partial correction of the downward trend, and one should not hope for a rise in prices!
Therefore, after identifying HD-, we expect a decrease in prices because the power of buyers compared to sellers is probably weakened, and we will continue to be accompanied by selling pressure. So, HD- occurs in a descending channel and at the end of the price correction. HD- is the signal of the end of the price increase and the continuation of the downward trend.
Confirmation and Divergence
- Generally, technical analysis is more reliable and accurate if the divergence is formed on strong support and resistance levels or if the return points are located on valid Fibonacci levels.
- If divergence is observed when the support and resistance lines are broken, there is a possibility that the break is invalid and the broken levels are taken back.
- If confirmation of divergence is done by several different oscillators, its validity and power are higher.
- If some oscillators confirmed the divergence, but others did not, it is a sign of its lower power. In these cases, use the MACD indicator to confirm the divergence.
- The steeper the slope of the lines, the stronger the divergence, and the more likely the price will turn.
Commonly Used Technical Indicators in the Detection of Divergence
There are many tools for detecting divergences that each trader uses according to their strategy. In the following, we will examine the most commonly used indicators in divergence detection.
Relative Strength Index (RSI)
The RSI indicator is one of the most widely used types of oscillators on divergence. RSI measures and compares the value of average profit and average loss. This indicator tells us that in the desired period, which is usually chosen for 14 days, the power is in the hands of buyers or sellers. In other words, RSI momentum compares the price in upward and downward movements and shows the results as a graph.
Money Flow Index (MFI)
The Money Flow Index (MFI) is another volatility indicator that uses price and volume data to indicate the inflow or outflow of money. One of the most prominent players in financial markets is money. If a large amount of money enters a market, then the power of buyers increases. As demand increases, supply decreases at low prices, resulting in higher prices.
Money leaving the market also makes sellers feel threatened, so they lower their prices to sell their assets and exit the deal, and this will reduce prices. MFI, which in addition to price data, also examines money entry and exit data, can be used to detect divergences. Some analysts have named the MFI indicator as the volume-weighted RSI.
MACD
The MACD (Moving Average Convergence Divergence) indicator uses moving average lines to show changes in price patterns. This indicator is created from a signal line (red color) and a MACD line (blue color).
How to Use Hidden Divergence in Technical Analysis
Once the hidden divergence pattern is identified, consider the following steps to execute your trades.
Step 1: Filter your transactions
You should always check the main trend of the price chart. If the main trend is up, look for a Bullish Hidden Divergence (HD+) and use it as a buy signal. Ignore Bearish Hidden Divergence (HD-) patterns in an uptrend. But in a downtrend, you should do the opposite and look for Bearish Hidden Divergence (HD-) and ignore bullish divergence.
Look for a sale when you see a Bearish Hidden Divergence (HD-) pattern. If the Hidden Divergence Pattern aligns with the direction of the larger trend, you will receive a more reliable signal.
Step 2: Have a loss limit
After you see the Hidden Divergence that matches the larger trend, you can make a proper trading plan. After seeing the Hidden Divergence, place the stop loss just beyond the last price swing. In the case of a Bullish Hidden Divergence (HD+), place the stop loss at the last price floor, where the buy signal shows.
In the case of a Bearish Hidden Divergence (HD-), place the stop loss at the pivot ceiling, where the sell signal occurred.
Step 3: Determine your goal
Traders who dream of endless profits make open-ended trades without an exit plan, which is a mistake. Therefore, it is always recommended to specify the price target in your transactions.
FAQs
What Is Divergence?
Divergence is when the price of an asset moves in the opposite direction of an indicator or contrary to other data. Also, divergence is a warning about the weakness or confirmation of the current price trend, and in some cases, it may lead to a change in price direction.
What Is Hidden Divergence?
A Hidden Divergence (HD) is formed during a trend and indicates the continuation of the trend. Hidden Divergences act like continuation patterns. In the upward trend, the two corresponding floors are at the beginning of the trend. In the downward trend, the first two corresponding ceilings in the price chart and the indicator are connected with a line, and we measure the slope of these two lines relative to each other. Hidden Divergence occurs when the slopes of two lines are not of the same sign.
What Is the Difference Between Regular and Hidden Divergence?
Regular Divergence (RD) occurs at the end of a trend and indicates the completion of the current trend, and we will probably have a trend change after that. But the Hidden Divergence (HD) is observed at the end of the correction waves of the trend. HD indicates the completion of the trend correction, and the trend will probably continue its main movement after that.
How Do Traders Benefit from a Bearish Market?
Usually, most traders and investors are eager to recognize the end of the bearish market and the price floor so they can purchase currency at the Buy the Dip floor to achieve a significant profit after the price increase.


