
Learn To Trade Forex • Best Forex Trading Course • AsiaForexMentor

Bullish Harami Pattern Every Trader Should Know

Written by

Ezekiel Chew

Updated on

January 29, 2025

i

Bullish Harami Pattern Every Trader Should Know

Written by:

Last updated on:

January 29, 2025

Candlestick patterns are a crucial part of technical analysis, providing traders with visual cues about market sentiment and potential price reversals. Among the sequence of these patterns, the bullish harami stands out as a strong indicator of a possible shift in market momentum .

In this article, we delve into the nature, recognition, and interpretation of the bullish harami candlestick pattern . Furthermore, we'll explore its variations, implications for forex trading, and the importance of its use alongside other technical indicators for a comprehensive trading strategy. The knowledge gained here is aimed at enabling both novice and experienced traders to understand and use the bullish harami pattern as an effective part of their trading toolkit.

What is a Bullish Harami Pattern?
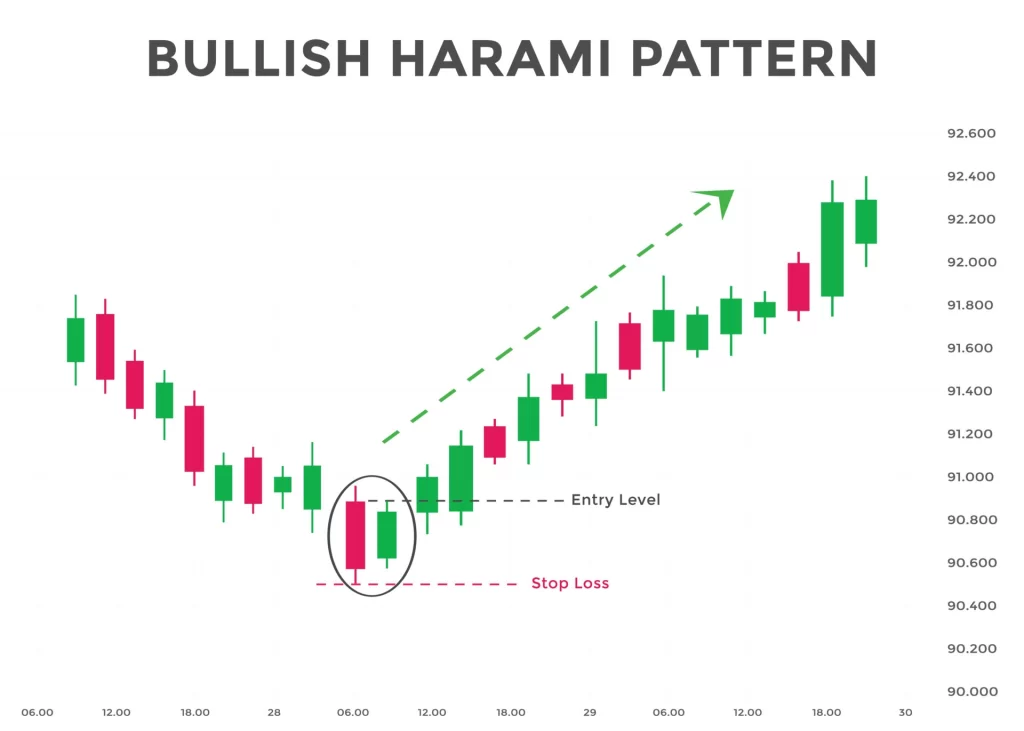
Photo: Shutterstock

The bullish harami pattern is a significant pattern in the realm of forex trading and technical analysis. It's a two-candlestick pattern that signifies a potential trend reversal from a previous bearish trend to a new bullish trend. Traders closely monitor this pattern as it can provide a buy signal, suggesting a good time to open a long position.

The name “harami” comes from an old Japanese word for “pregnant“. The metaphor is visually descriptive: the first candle in the pattern is a large bearish candle, followed by a smaller bullish candle. The small bullish candle is “encased” within the body of the prior candle, akin to a baby in a mother's womb. The formation of this pattern is where the bullish harami candle pattern gets its intriguing name.

Components of a Bullish Harami Pattern
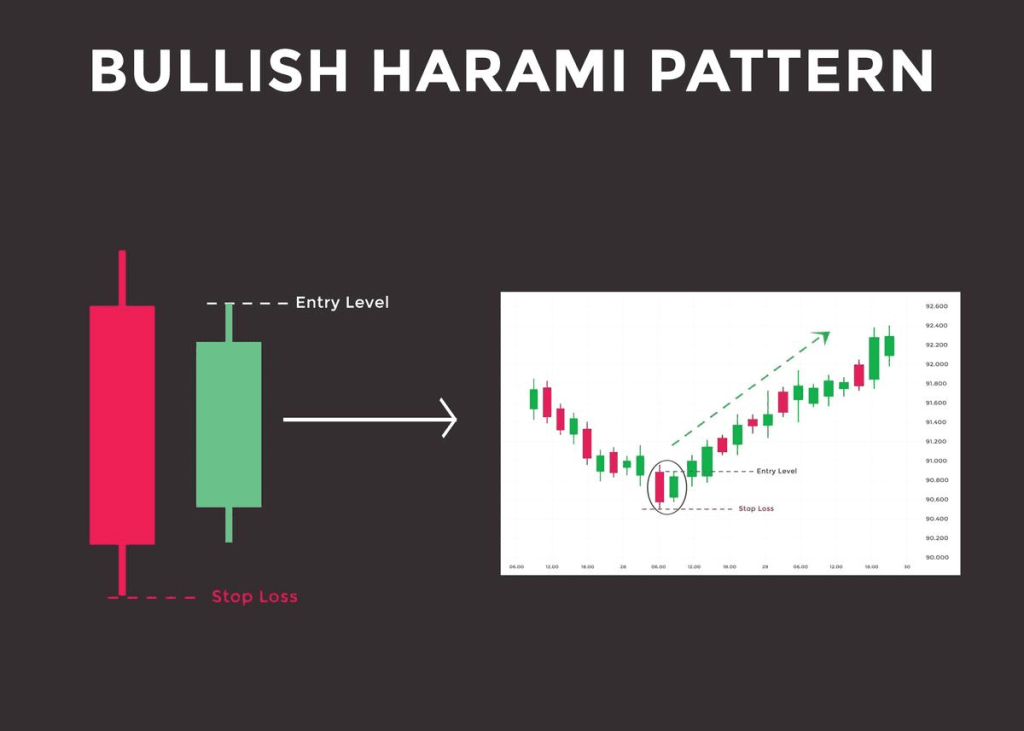
Photo: Shutterstock

A bullish harami consists of two main components. The first candlestick is a long bearish candle that occurs at the end of a downtrend. This candle represents strong negative market sentiment and is often a continuation of the previous trend.

The second candle, however, paints a different picture. This is a smaller bullish candle, which opens higher than the previous day's close and closes lower than the previous day's open. The second bullish candle is completely engulfed within the body of the first candle.

In a typical bullish harami setup, the first candle has a large real body representing a strong down-move or sell-off. The second candle is a small candlestick, signifying reduced selling pressure. It could be a white candle, a small green candle, or a doji candle (a candle with nearly the same opening and closing prices, indicating indecision in the market).

Recognizing a Bullish Harami Candlestick Pattern on a Stock Chart

Identifying a bullish harami on a stock chart is straightforward. You're looking for a long bearish candlestick followed by a smaller bullish candle, completely contained within the body of the first candle. Remember, this two-candlestick pattern appears after a downtrend.

Seeing this pattern occur frequently is not uncommon in the financial markets. However, you should always corroborate its appearance with other technical indicators before making a trading decision.

Understanding the Market Sentiment Behind the Bullish Harami Pattern
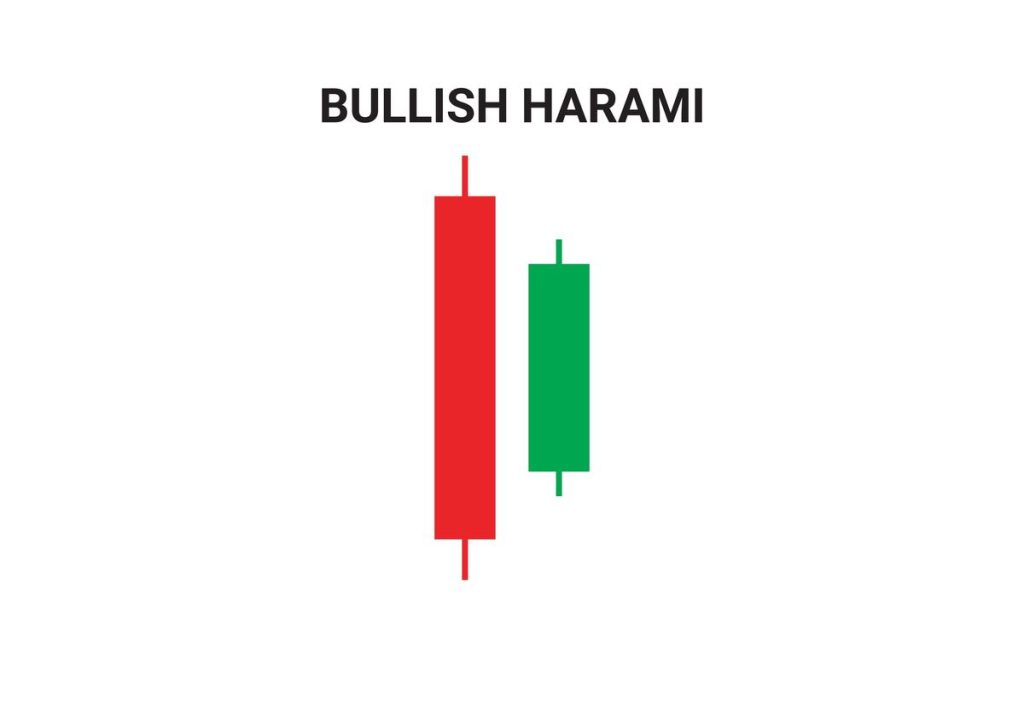
Photo: Shutterstock

When a bullish harami appears at the end of a downtrend, it hints at a shift in market sentiment. The long bearish candle of the first day shows that sellers are in control, pushing the stock price lower. However, the appearance of a small bullish candle on the following day suggests that selling pressure is weakening, and buyers are starting to step in.

The bullish harami pattern, therefore, signals that the bears' dominance is waning and a bullish reversal could be on the cards. It indicates a potential change in the price trend from bearish to bullish, reflecting a change in trader sentiment.

Trading the Bullish Harami Pattern

When you identify a bullish harami pattern on your trading chart, it's essential to understand that it's not an immediate call to action. A bullish harami is a bullish signal, but it's only a preliminary indication of a potential reversal.

To trade a bullish harami, you should look for confirmation from the price chart and other indicators. One common method is to wait until the price breaks above the high of the harami's second candle. When the stock price moves above this level, it may be a good time to initiate a long position.

Another trading strategy could be to look for a bullish harami near a significant support level. The combination of a bullish harami pattern and a strong support level can enhance the reliability of the potential bullish reversal.

You might also consider using other technical indicators for further confirmation. These could include trend lines, moving averages, oscillators, or volume indicators.

Understanding the Bearish Harami Pattern
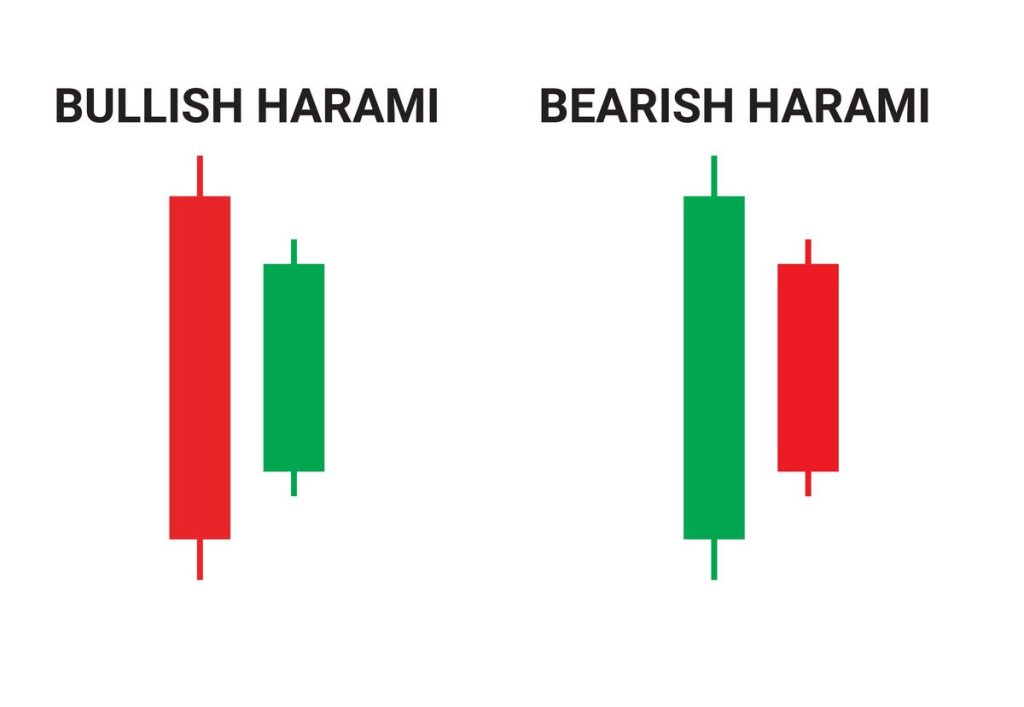
Photo: Shutterstock

While this article focuses on the bullish harami candlestick pattern, it's worth mentioning its counterpart, the bearish harami pattern. This pattern is the exact opposite of the bullish harami. Instead of indicating a bullish reversal after a downtrend, a bearish harami indicates a bearish reversal after an uptrend.

The bearish harami consists of a large bullish candle followed by a small bearish candle, with the second candle being within the real body of the prior candle. The appearance of this pattern hints at a weakening of the bullish sentiment and the possibility of a downward trend. Just like with the bullish harami, traders should always use other technical indicators for confirmation before deciding to trade based on this pattern.

Variations of the Bullish Harami Pattern: The Bullish Harami Cross

Photo: Shutterstock

A variation of the bullish harami pattern is the bullish harami cross. This pattern occurs when the second candle is a doji instead of a regular bullish candle. The presence of the doji indicates indecision in the market, which can make the potential trend reversal even more significant.

The Importance of Candlestick Patterns
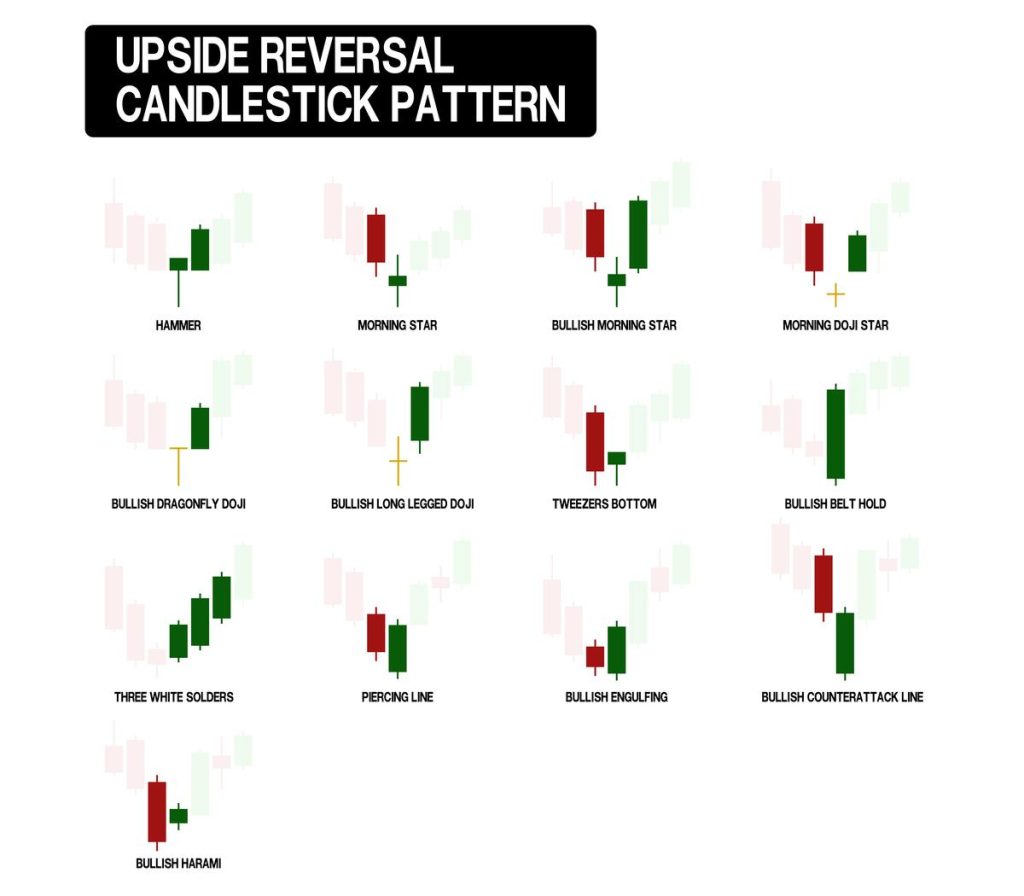
Photo: Shutterstock

While we've concentrated on the bullish harami candlestick pattern, it's just one of many candlestick patterns used in forex trading and technical analysis. These patterns are the language of the market. They provide a visual representation of market sentiment and offer clues about potential price reversals and continuation patterns.

In essence, candlestick chart patterns are a way of understanding the ongoing battle between buyers and sellers. Some patterns suggest that buyers are in control (bullish patterns), while others suggest sellers are in control (bearish patterns). There are also neutral patterns, indicating a balanced market with no clear winner.

Using candlestick patterns for trading decisions is not new. The first documented use of candlestick patterns can be traced back to 18th century Japan when rice merchants used them to trade rice contracts. Today, these patterns are applied to all financial markets, including forex, stocks, commodities, and indices.

Other Notable Candlestick Patterns
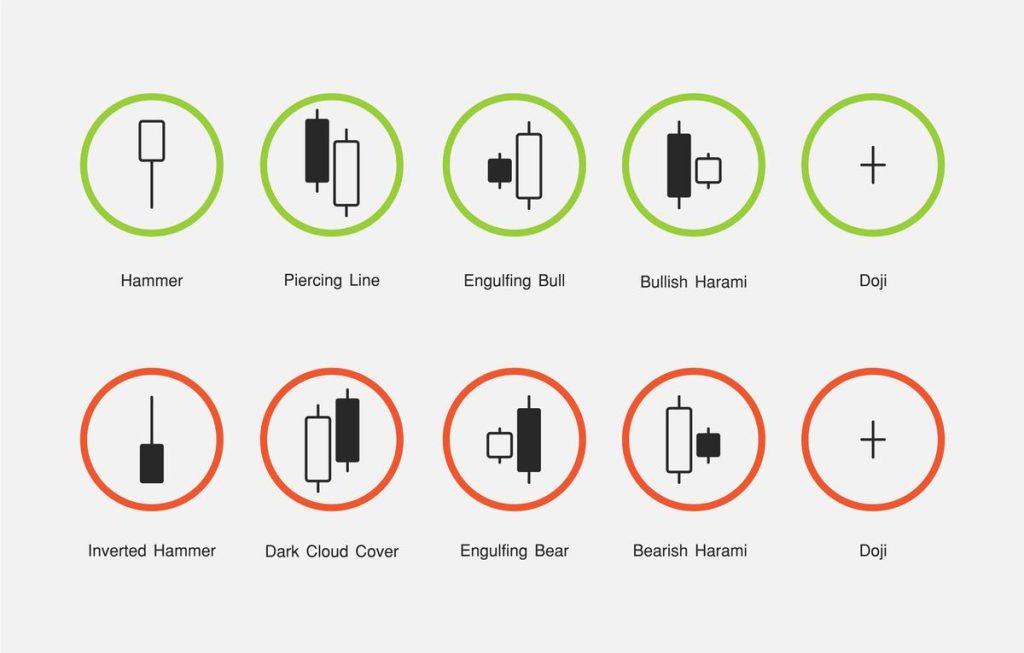
Photo: Shutterstock

While the bullish harami is a valuable pattern to understand, there are other candlestick patterns also worth learning. These include the bullish engulfing pattern, bearish harami, bearish engulfing, piercing line, and hammer, to name just a few.

Like this harami, each of these patterns provides unique insights into market dynamics and potential future price action. However, similar to the bullish harami, these patterns should not be used in isolation. Instead, they should form part of a broader trading strategy that incorporates other indicators and risk management techniques.

Using Bullish Harami with Other Technical Indicators

The bullish harami pattern can be used more effectively when combined with other technical indicators. These additional tools can help confirm the pattern and increase the probability of a successful trade. For example, a moving average can help identify the overall trend, while the Relative Strength Index (RSI) can provide information about market overbought or oversold conditions.

Another crucial concept is support and resistance levels. These are price levels at which the price trend has historically reversed. A bullish harami pattern that appears near a support level might carry more weight than one that appears at random.

False Signals and Risk Management

Photo: Canva

Although the this pattern is a powerful tool in technical analysis, it's important to remember that no pattern is 100% reliable. False signals can and do occur. Therefore, risk management is an essential part of any trading strategy.

One practical risk management technique is to set a stop loss. A stop loss is a predetermined price at which you will close your trade if the market moves against you. It helps limit potential losses.

Similarly, a profit target is a price at which you plan to close your trade when the market moves in your favor. It helps ensure that you exit your trade at a profitable point before the market can reverse and erase your gains.

Also Read: How To Read Candlesticks Like A Pro

Conclusion

The bullish harami candlestick pattern is a versatile and insightful tool that can enrich any trader's technical analysis toolkit. Its ability to signal potential bullish reversals makes it a favored pattern among forex traders. However, it should not be used in isolation. Instead, it should be part of a comprehensive trading strategy that includes other technical indicators, sound risk management, and a deep understanding of the financial markets.

By understanding the bullish harami and other candlestick patterns, traders can gain a deeper understanding of market sentiment, which can aid in making informed trading decisions. However, like all trading strategies, using candlestick patterns requires practice, patience, and an ongoing commitment to learning and improving.

FAQs

Why is it important to wait for confirmation after identifying a bullish harami pattern?

While the this pattern indicates a potential bullish reversal, it's not a definitive buy signal. False signals can occur, and the pattern itself might not lead to a reversal if the broader market conditions aren't supportive. Hence, waiting for confirmation, such as a price break above the high of the harami's second candle, or corroboration from other technical indicators, helps verify the reversal and increase the probability of a successful trade.

How can I distinguish between a bullish harami and a bullish harami cross?

The difference between a bullish and a bearish harami cross lies in the second candle of the pattern. In a harami, the second candle is a small bullish candle that is completely contained within the first, large bearish candle. On the other hand, in a bullish harami cross, the second candle is a doji—a candlestick with nearly the same opening and closing prices—instead of a regular bullish candle. The doji symbolizes market indecision, which can make the potential trend reversal more significant.

Can I use the bullish harami pattern in all market conditions?

The harami pattern can occur in any market; however, it's most significant when it appears after a clear downtrend. The pattern signals a potential reversal from bearish to bullish market conditions. If it forms during an uptrend or within a range-bound market, its predictive power may be less reliable. Always consider the overall market trend when interpreting this pattern. Also, remember to use other technical indicators to confirm the potential reversal signaled by a bullish harami.


About Ezekiel Chew​

Ezekiel Chew, founder and head of training at Asia Forex Mentor, is a renowned forex expert, frequently invited to speak at major industry events. Known for his deep market insights, Ezekiel is one of the top traders committed to supporting the trading community. Making six figures per trade, he also trains traders working in banks, fund management, and prop trading firms.

Is Forex Trading Profitable for Most Traders

Is forex trading profitable? The honest answer is yes, but not in the way most people entering the market expect it to be. Forex trading is profitable for a minority of traders. Most retail traders lose money. That is not a secret. Brokers in the European Union must disclose the

Read More

Understanding What Is Price Action Trading in 2026

What is price action trading and why do institutional traders rely on it while most retail traders still lose money with indicators? Price action trading is the method of making trading decisions based entirely on the market’s price chart. No lagging indicators, moving averages. No RSI or MACD cluttering the

Read More

What Is Revenge Trading And How To Prevent It In Forex

ABOUT THIS GUIDE Written by Ezekiel Chew, founder of Asia Forex Mentor and a former bank trader with over 20 years of experience. Ezekiel has coached more than 100,000 students across Singapore, the Philippines, Malaysia, Indonesia, and over 50 countries through the AFM One Core Program. Revenge trading is one

Read More

What Is a Stop Loss Before You Lose Another Trade

What is a stop loss? It is the one trading instruction that separates traders who survive from those who blow their accounts. Most traders understand the concept. Far fewer use it correctly. A stop loss is not just a safety net. It is a pre-defined decision made before emotion enters

Read More

7 Best Trading Strategies That Actually Work in 2026

Most traders cycle through the best trading strategies they find online — and still blow their accounts within six months. The trading strategy itself is rarely the problem. The problem is how it gets taught. Most sources strip out the institutional logic, skip the risk management, and hand over a

Read More

AFM Trading Summit Live

Date: Coming Soon

Join us at the AFM Trading Summit Live and learn from top industry experts through live trading sessions, market insights, and actionable strategies.

Bullish Harami Pattern Every Trader Should Know

4.0
Overall Trust Index

Written by:

Updated:

January 29, 2025

Candlestick patterns are a crucial part of technical analysis, providing traders with visual cues about market sentiment and potential price reversals. Among the sequence of these patterns, the bullish harami stands out as a strong indicator of a possible shift in market momentum.

In this article, we delve into the nature, recognition, and interpretation of the bullish harami candlestick pattern. Furthermore, we'll explore its variations, implications for forex trading, and the importance of its use alongside other technical indicators for a comprehensive trading strategy. The knowledge gained here is aimed at enabling both novice and experienced traders to understand and use the bullish harami pattern as an effective part of their trading toolkit.

What is a Bullish Harami Pattern?

Photo: Shutterstock

The bullish harami pattern is a significant pattern in the realm of forex trading and technical analysis. It's a two-candlestick pattern that signifies a potential trend reversal from a previous bearish trend to a new bullish trend. Traders closely monitor this pattern as it can provide a buy signal, suggesting a good time to open a long position.

The name "harami" comes from an old Japanese word for "pregnant". The metaphor is visually descriptive: the first candle in the pattern is a large bearish candle, followed by a smaller bullish candle. The small bullish candle is "encased" within the body of the prior candle, akin to a baby in a mother's womb. The formation of this pattern is where the bullish harami candle pattern gets its intriguing name.

Components of a Bullish Harami Pattern

Photo: Shutterstock

A bullish harami consists of two main components. The first candlestick is a long bearish candle that occurs at the end of a downtrend. This candle represents strong negative market sentiment and is often a continuation of the previous trend.

The second candle, however, paints a different picture. This is a smaller bullish candle, which opens higher than the previous day's close and closes lower than the previous day's open. The second bullish candle is completely engulfed within the body of the first candle.

In a typical bullish harami setup, the first candle has a large real body representing a strong down-move or sell-off. The second candle is a small candlestick, signifying reduced selling pressure. It could be a white candle, a small green candle, or a doji candle (a candle with nearly the same opening and closing prices, indicating indecision in the market).

Recognizing a Bullish Harami Candlestick Pattern on a Stock Chart

Identifying a bullish harami on a stock chart is straightforward. You're looking for a long bearish candlestick followed by a smaller bullish candle, completely contained within the body of the first candle. Remember, this two-candlestick pattern appears after a downtrend.

Seeing this pattern occur frequently is not uncommon in the financial markets. However, you should always corroborate its appearance with other technical indicators before making a trading decision.

Understanding the Market Sentiment Behind the Bullish Harami Pattern

Photo: Shutterstock

When a bullish harami appears at the end of a downtrend, it hints at a shift in market sentiment. The long bearish candle of the first day shows that sellers are in control, pushing the stock price lower. However, the appearance of a small bullish candle on the following day suggests that selling pressure is weakening, and buyers are starting to step in.

The bullish harami pattern, therefore, signals that the bears' dominance is waning and a bullish reversal could be on the cards. It indicates a potential change in the price trend from bearish to bullish, reflecting a change in trader sentiment.

Trading the Bullish Harami Pattern

When you identify a bullish harami pattern on your trading chart, it's essential to understand that it's not an immediate call to action. A bullish harami is a bullish signal, but it's only a preliminary indication of a potential reversal.

To trade a bullish harami, you should look for confirmation from the price chart and other indicators. One common method is to wait until the price breaks above the high of the harami's second candle. When the stock price moves above this level, it may be a good time to initiate a long position.

Another trading strategy could be to look for a bullish harami near a significant support level. The combination of a bullish harami pattern and a strong support level can enhance the reliability of the potential bullish reversal.

You might also consider using other technical indicators for further confirmation. These could include trend lines, moving averages, oscillators, or volume indicators.

Understanding the Bearish Harami Pattern

Photo: Shutterstock

While this article focuses on the bullish harami candlestick pattern, it's worth mentioning its counterpart, the bearish harami pattern. This pattern is the exact opposite of the bullish harami. Instead of indicating a bullish reversal after a downtrend, a bearish harami indicates a bearish reversal after an uptrend.

The bearish harami consists of a large bullish candle followed by a small bearish candle, with the second candle being within the real body of the prior candle. The appearance of this pattern hints at a weakening of the bullish sentiment and the possibility of a downward trend. Just like with the bullish harami, traders should always use other technical indicators for confirmation before deciding to trade based on this pattern.

Variations of the Bullish Harami Pattern: The Bullish Harami Cross

Photo: Shutterstock

A variation of the bullish harami pattern is the bullish harami cross. This pattern occurs when the second candle is a doji instead of a regular bullish candle. The presence of the doji indicates indecision in the market, which can make the potential trend reversal even more significant.

The Importance of Candlestick Patterns

Photo: Shutterstock

While we've concentrated on the bullish harami candlestick pattern, it's just one of many candlestick patterns used in forex trading and technical analysis. These patterns are the language of the market. They provide a visual representation of market sentiment and offer clues about potential price reversals and continuation patterns.

In essence, candlestick chart patterns are a way of understanding the ongoing battle between buyers and sellers. Some patterns suggest that buyers are in control (bullish patterns), while others suggest sellers are in control (bearish patterns). There are also neutral patterns, indicating a balanced market with no clear winner.

Using candlestick patterns for trading decisions is not new. The first documented use of candlestick patterns can be traced back to 18th century Japan when rice merchants used them to trade rice contracts. Today, these patterns are applied to all financial markets, including forex, stocks, commodities, and indices.

Other Notable Candlestick Patterns

Photo: Shutterstock

While the bullish harami is a valuable pattern to understand, there are other candlestick patterns also worth learning. These include the bullish engulfing pattern, bearish harami, bearish engulfing, piercing line, and hammer, to name just a few.

Like this harami, each of these patterns provides unique insights into market dynamics and potential future price action. However, similar to the bullish harami, these patterns should not be used in isolation. Instead, they should form part of a broader trading strategy that incorporates other indicators and risk management techniques.

Using Bullish Harami with Other Technical Indicators

The bullish harami pattern can be used more effectively when combined with other technical indicators. These additional tools can help confirm the pattern and increase the probability of a successful trade. For example, a moving average can help identify the overall trend, while the Relative Strength Index (RSI) can provide information about market overbought or oversold conditions.

Another crucial concept is support and resistance levels. These are price levels at which the price trend has historically reversed. A bullish harami pattern that appears near a support level might carry more weight than one that appears at random.

False Signals and Risk Management

Photo: Canva

Although the this pattern is a powerful tool in technical analysis, it's important to remember that no pattern is 100% reliable. False signals can and do occur. Therefore, risk management is an essential part of any trading strategy.

One practical risk management technique is to set a stop loss. A stop loss is a predetermined price at which you will close your trade if the market moves against you. It helps limit potential losses.

Similarly, a profit target is a price at which you plan to close your trade when the market moves in your favor. It helps ensure that you exit your trade at a profitable point before the market can reverse and erase your gains.

Also Read: How To Read Candlesticks Like A Pro

Conclusion

The bullish harami candlestick pattern is a versatile and insightful tool that can enrich any trader's technical analysis toolkit. Its ability to signal potential bullish reversals makes it a favored pattern among forex traders. However, it should not be used in isolation. Instead, it should be part of a comprehensive trading strategy that includes other technical indicators, sound risk management, and a deep understanding of the financial markets.

By understanding the bullish harami and other candlestick patterns, traders can gain a deeper understanding of market sentiment, which can aid in making informed trading decisions. However, like all trading strategies, using candlestick patterns requires practice, patience, and an ongoing commitment to learning and improving.

FAQs

Why is it important to wait for confirmation after identifying a bullish harami pattern?

While the this pattern indicates a potential bullish reversal, it's not a definitive buy signal. False signals can occur, and the pattern itself might not lead to a reversal if the broader market conditions aren't supportive. Hence, waiting for confirmation, such as a price break above the high of the harami's second candle, or corroboration from other technical indicators, helps verify the reversal and increase the probability of a successful trade.

How can I distinguish between a bullish harami and a bullish harami cross?

The difference between a bullish and a bearish harami cross lies in the second candle of the pattern. In a harami, the second candle is a small bullish candle that is completely contained within the first, large bearish candle. On the other hand, in a bullish harami cross, the second candle is a doji—a candlestick with nearly the same opening and closing prices—instead of a regular bullish candle. The doji symbolizes market indecision, which can make the potential trend reversal more significant.

Can I use the bullish harami pattern in all market conditions?

The harami pattern can occur in any market; however, it's most significant when it appears after a clear downtrend. The pattern signals a potential reversal from bearish to bullish market conditions. If it forms during an uptrend or within a range-bound market, its predictive power may be less reliable. Always consider the overall market trend when interpreting this pattern. Also, remember to use other technical indicators to confirm the potential reversal signaled by a bullish harami.

ezekiel chew asiaforexmentor

About Ezekiel Chew

Ezekiel Chew, founder and head of training at Asia Forex Mentor, is a renowned forex expert, frequently invited to speak at major industry events. Known for his deep market insights, Ezekiel is one of the top traders committed to supporting the trading community. Making six figures per trade, he also trains traders working in banks, fund management, and prop trading firms.

RELATED ARTICLES

Bullish Harami Pattern Every Trader Should Know

4.0
Overall Trust Index

Written by:

Updated:

January 29, 2025

Candlestick patterns are a crucial part of technical analysis, providing traders with visual cues about market sentiment and potential price reversals. Among the sequence of these patterns, the bullish harami stands out as a strong indicator of a possible shift in market momentum.

In this article, we delve into the nature, recognition, and interpretation of the bullish harami candlestick pattern. Furthermore, we'll explore its variations, implications for forex trading, and the importance of its use alongside other technical indicators for a comprehensive trading strategy. The knowledge gained here is aimed at enabling both novice and experienced traders to understand and use the bullish harami pattern as an effective part of their trading toolkit.

What is a Bullish Harami Pattern?

Photo: Shutterstock

The bullish harami pattern is a significant pattern in the realm of forex trading and technical analysis. It's a two-candlestick pattern that signifies a potential trend reversal from a previous bearish trend to a new bullish trend. Traders closely monitor this pattern as it can provide a buy signal, suggesting a good time to open a long position.

The name "harami" comes from an old Japanese word for "pregnant". The metaphor is visually descriptive: the first candle in the pattern is a large bearish candle, followed by a smaller bullish candle. The small bullish candle is "encased" within the body of the prior candle, akin to a baby in a mother's womb. The formation of this pattern is where the bullish harami candle pattern gets its intriguing name.

Components of a Bullish Harami Pattern

Photo: Shutterstock

A bullish harami consists of two main components. The first candlestick is a long bearish candle that occurs at the end of a downtrend. This candle represents strong negative market sentiment and is often a continuation of the previous trend.

The second candle, however, paints a different picture. This is a smaller bullish candle, which opens higher than the previous day's close and closes lower than the previous day's open. The second bullish candle is completely engulfed within the body of the first candle.

In a typical bullish harami setup, the first candle has a large real body representing a strong down-move or sell-off. The second candle is a small candlestick, signifying reduced selling pressure. It could be a white candle, a small green candle, or a doji candle (a candle with nearly the same opening and closing prices, indicating indecision in the market).

Recognizing a Bullish Harami Candlestick Pattern on a Stock Chart

Identifying a bullish harami on a stock chart is straightforward. You're looking for a long bearish candlestick followed by a smaller bullish candle, completely contained within the body of the first candle. Remember, this two-candlestick pattern appears after a downtrend.

Seeing this pattern occur frequently is not uncommon in the financial markets. However, you should always corroborate its appearance with other technical indicators before making a trading decision.

Understanding the Market Sentiment Behind the Bullish Harami Pattern

Photo: Shutterstock

When a bullish harami appears at the end of a downtrend, it hints at a shift in market sentiment. The long bearish candle of the first day shows that sellers are in control, pushing the stock price lower. However, the appearance of a small bullish candle on the following day suggests that selling pressure is weakening, and buyers are starting to step in.

The bullish harami pattern, therefore, signals that the bears' dominance is waning and a bullish reversal could be on the cards. It indicates a potential change in the price trend from bearish to bullish, reflecting a change in trader sentiment.

Trading the Bullish Harami Pattern

When you identify a bullish harami pattern on your trading chart, it's essential to understand that it's not an immediate call to action. A bullish harami is a bullish signal, but it's only a preliminary indication of a potential reversal.

To trade a bullish harami, you should look for confirmation from the price chart and other indicators. One common method is to wait until the price breaks above the high of the harami's second candle. When the stock price moves above this level, it may be a good time to initiate a long position.

Another trading strategy could be to look for a bullish harami near a significant support level. The combination of a bullish harami pattern and a strong support level can enhance the reliability of the potential bullish reversal.

You might also consider using other technical indicators for further confirmation. These could include trend lines, moving averages, oscillators, or volume indicators.

Understanding the Bearish Harami Pattern

Photo: Shutterstock

While this article focuses on the bullish harami candlestick pattern, it's worth mentioning its counterpart, the bearish harami pattern. This pattern is the exact opposite of the bullish harami. Instead of indicating a bullish reversal after a downtrend, a bearish harami indicates a bearish reversal after an uptrend.

The bearish harami consists of a large bullish candle followed by a small bearish candle, with the second candle being within the real body of the prior candle. The appearance of this pattern hints at a weakening of the bullish sentiment and the possibility of a downward trend. Just like with the bullish harami, traders should always use other technical indicators for confirmation before deciding to trade based on this pattern.

Variations of the Bullish Harami Pattern: The Bullish Harami Cross

Photo: Shutterstock

A variation of the bullish harami pattern is the bullish harami cross. This pattern occurs when the second candle is a doji instead of a regular bullish candle. The presence of the doji indicates indecision in the market, which can make the potential trend reversal even more significant.

The Importance of Candlestick Patterns

Photo: Shutterstock

While we've concentrated on the bullish harami candlestick pattern, it's just one of many candlestick patterns used in forex trading and technical analysis. These patterns are the language of the market. They provide a visual representation of market sentiment and offer clues about potential price reversals and continuation patterns.

In essence, candlestick chart patterns are a way of understanding the ongoing battle between buyers and sellers. Some patterns suggest that buyers are in control (bullish patterns), while others suggest sellers are in control (bearish patterns). There are also neutral patterns, indicating a balanced market with no clear winner.

Using candlestick patterns for trading decisions is not new. The first documented use of candlestick patterns can be traced back to 18th century Japan when rice merchants used them to trade rice contracts. Today, these patterns are applied to all financial markets, including forex, stocks, commodities, and indices.

Other Notable Candlestick Patterns

Photo: Shutterstock

While the bullish harami is a valuable pattern to understand, there are other candlestick patterns also worth learning. These include the bullish engulfing pattern, bearish harami, bearish engulfing, piercing line, and hammer, to name just a few.

Like this harami, each of these patterns provides unique insights into market dynamics and potential future price action. However, similar to the bullish harami, these patterns should not be used in isolation. Instead, they should form part of a broader trading strategy that incorporates other indicators and risk management techniques.

Using Bullish Harami with Other Technical Indicators

The bullish harami pattern can be used more effectively when combined with other technical indicators. These additional tools can help confirm the pattern and increase the probability of a successful trade. For example, a moving average can help identify the overall trend, while the Relative Strength Index (RSI) can provide information about market overbought or oversold conditions.

Another crucial concept is support and resistance levels. These are price levels at which the price trend has historically reversed. A bullish harami pattern that appears near a support level might carry more weight than one that appears at random.

False Signals and Risk Management

Photo: Canva

Although the this pattern is a powerful tool in technical analysis, it's important to remember that no pattern is 100% reliable. False signals can and do occur. Therefore, risk management is an essential part of any trading strategy.

One practical risk management technique is to set a stop loss. A stop loss is a predetermined price at which you will close your trade if the market moves against you. It helps limit potential losses.

Similarly, a profit target is a price at which you plan to close your trade when the market moves in your favor. It helps ensure that you exit your trade at a profitable point before the market can reverse and erase your gains.

Also Read: How To Read Candlesticks Like A Pro

Conclusion

The bullish harami candlestick pattern is a versatile and insightful tool that can enrich any trader's technical analysis toolkit. Its ability to signal potential bullish reversals makes it a favored pattern among forex traders. However, it should not be used in isolation. Instead, it should be part of a comprehensive trading strategy that includes other technical indicators, sound risk management, and a deep understanding of the financial markets.

By understanding the bullish harami and other candlestick patterns, traders can gain a deeper understanding of market sentiment, which can aid in making informed trading decisions. However, like all trading strategies, using candlestick patterns requires practice, patience, and an ongoing commitment to learning and improving.

FAQs

Why is it important to wait for confirmation after identifying a bullish harami pattern?

While the this pattern indicates a potential bullish reversal, it's not a definitive buy signal. False signals can occur, and the pattern itself might not lead to a reversal if the broader market conditions aren't supportive. Hence, waiting for confirmation, such as a price break above the high of the harami's second candle, or corroboration from other technical indicators, helps verify the reversal and increase the probability of a successful trade.

How can I distinguish between a bullish harami and a bullish harami cross?

The difference between a bullish and a bearish harami cross lies in the second candle of the pattern. In a harami, the second candle is a small bullish candle that is completely contained within the first, large bearish candle. On the other hand, in a bullish harami cross, the second candle is a doji—a candlestick with nearly the same opening and closing prices—instead of a regular bullish candle. The doji symbolizes market indecision, which can make the potential trend reversal more significant.

Can I use the bullish harami pattern in all market conditions?

The harami pattern can occur in any market; however, it's most significant when it appears after a clear downtrend. The pattern signals a potential reversal from bearish to bullish market conditions. If it forms during an uptrend or within a range-bound market, its predictive power may be less reliable. Always consider the overall market trend when interpreting this pattern. Also, remember to use other technical indicators to confirm the potential reversal signaled by a bullish harami.

ezekiel chew asiaforexmentor

About Ezekiel Chew

Ezekiel Chew, founder and head of training at Asia Forex Mentor, is a renowned forex expert, frequently invited to speak at major industry events. Known for his deep market insights, Ezekiel is one of the top traders committed to supporting the trading community. Making six figures per trade, he also trains traders working in banks, fund management, and prop trading firms.

RELATED ARTICLES

Join the Live Event
Get Your Free Ticket Now

I consent to receiving emails and/or text message reminders for this event.

REGISTER FOR THE MASTERCLASS!