The bullish stalled candlestick pattern is a technical analysis tool that can provide valuable insights for traders, especially when navigating volatile markets. Recognizing and effectively trading this pattern can help identify potential bullish reversals and optimize trading strategies. This candlestick pattern, known for its distinctive formation of three successive candles, signals a potential shift in market momentum, making it an essential element in a trader's toolkit.
In this article, we will explore what the bullish stalled pattern is, how to spot it, and the best practices for trading it. By understanding the nuances of this pattern and incorporating it into your trading strategy, you can gain a competitive edge in predicting market movements.
Also Read: Mastering Japanese Candlestick Patterns
What is the Bullish Stalled Candlestick Pattern?
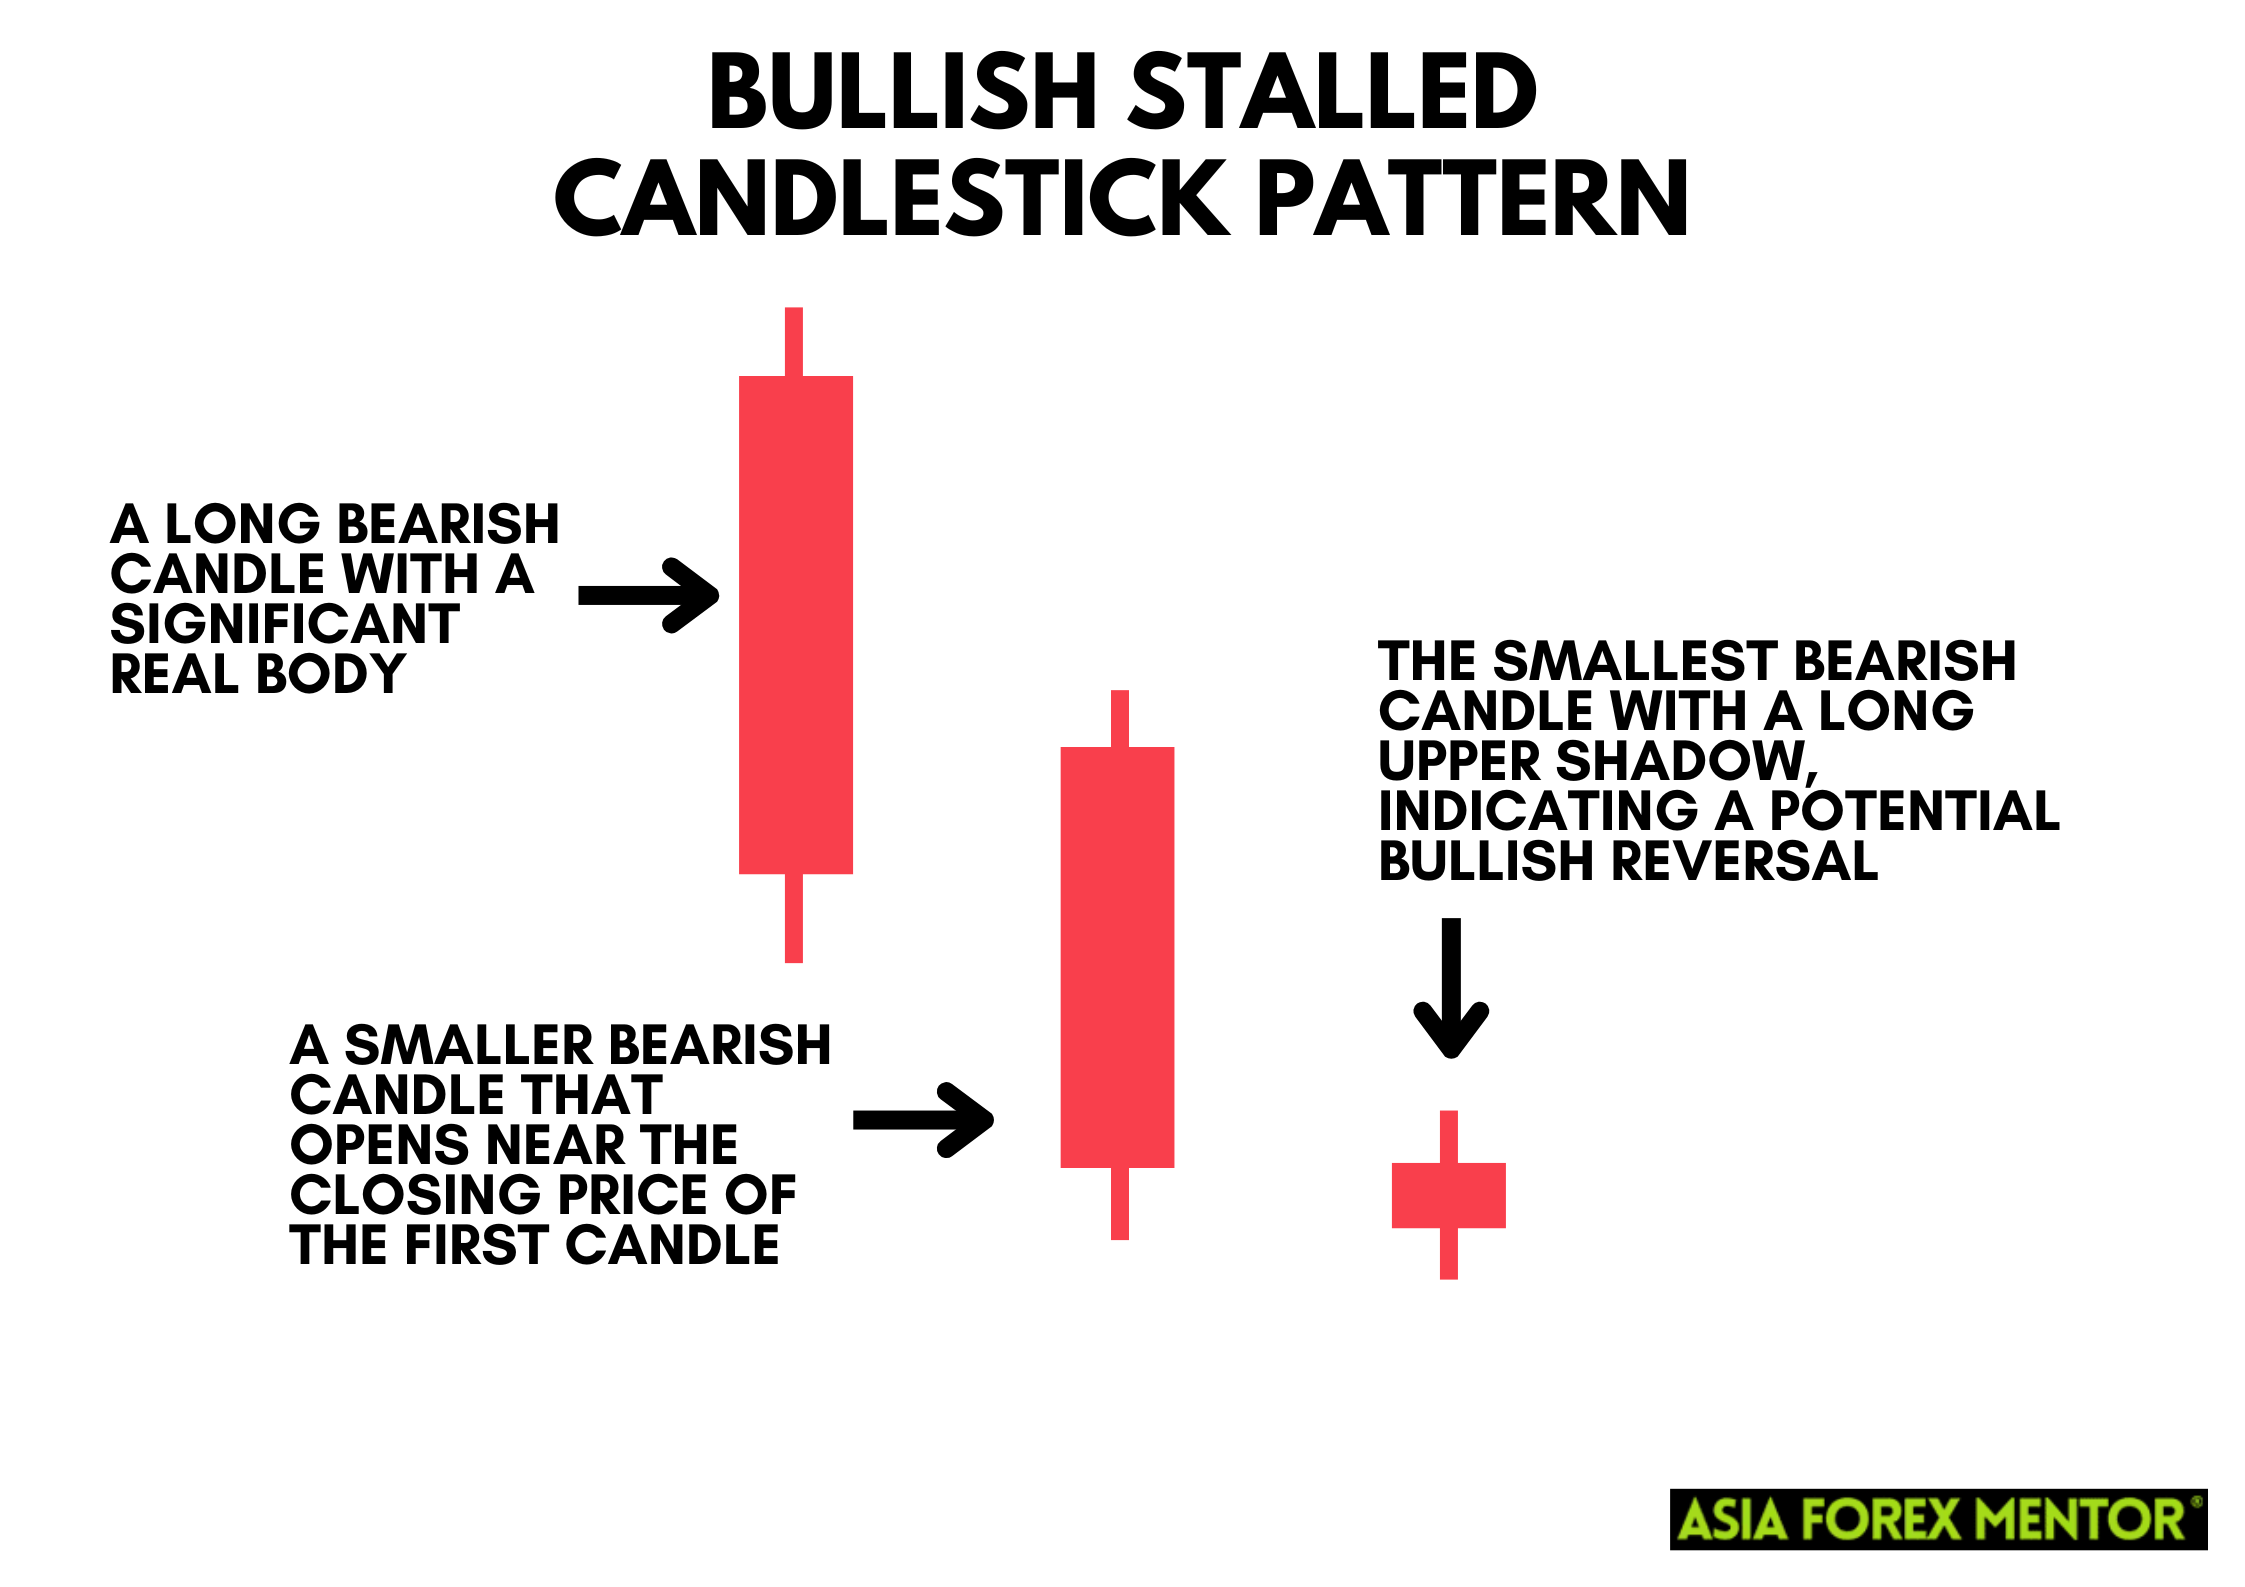
The bullish stalled candlestick pattern, also known as the deliberation pattern, is a key technical analysis tool that traders use to identify potential bullish reversals during a downtrend. This pattern is distinguished by its three-candle formation, where each successive candle has a smaller body than the one before. The first candle is typically a long bearish candle, followed by a second candle with a smaller real body, and finally, the third candle is the smallest, often featuring a long upper shadow. This gradual reduction in the size of the candles indicates a slowdown in bearish momentum and suggests that the market may be gearing up for a bullish reversal.
Recognizing the bullish stalled candlestick pattern is essential for traders aiming to forecast market shifts and capitalize on trading opportunities. The pattern signals that the bearish trend is weakening and a bullish trend might be on the horizon. This potential shift is crucial for making informed trading decisions, as it helps in determining the best entry and exit points.
Key Characteristics:
- First Candle: A long bearish candle with a significant real body.
- Second Candle: A smaller bearish candle that opens near the closing price of the first candle.
- Third Candle: The smallest bearish candle with a long upper shadow, indicating a potential bullish reversal.
How to Spot the Bullish Stalled Candlestick Pattern
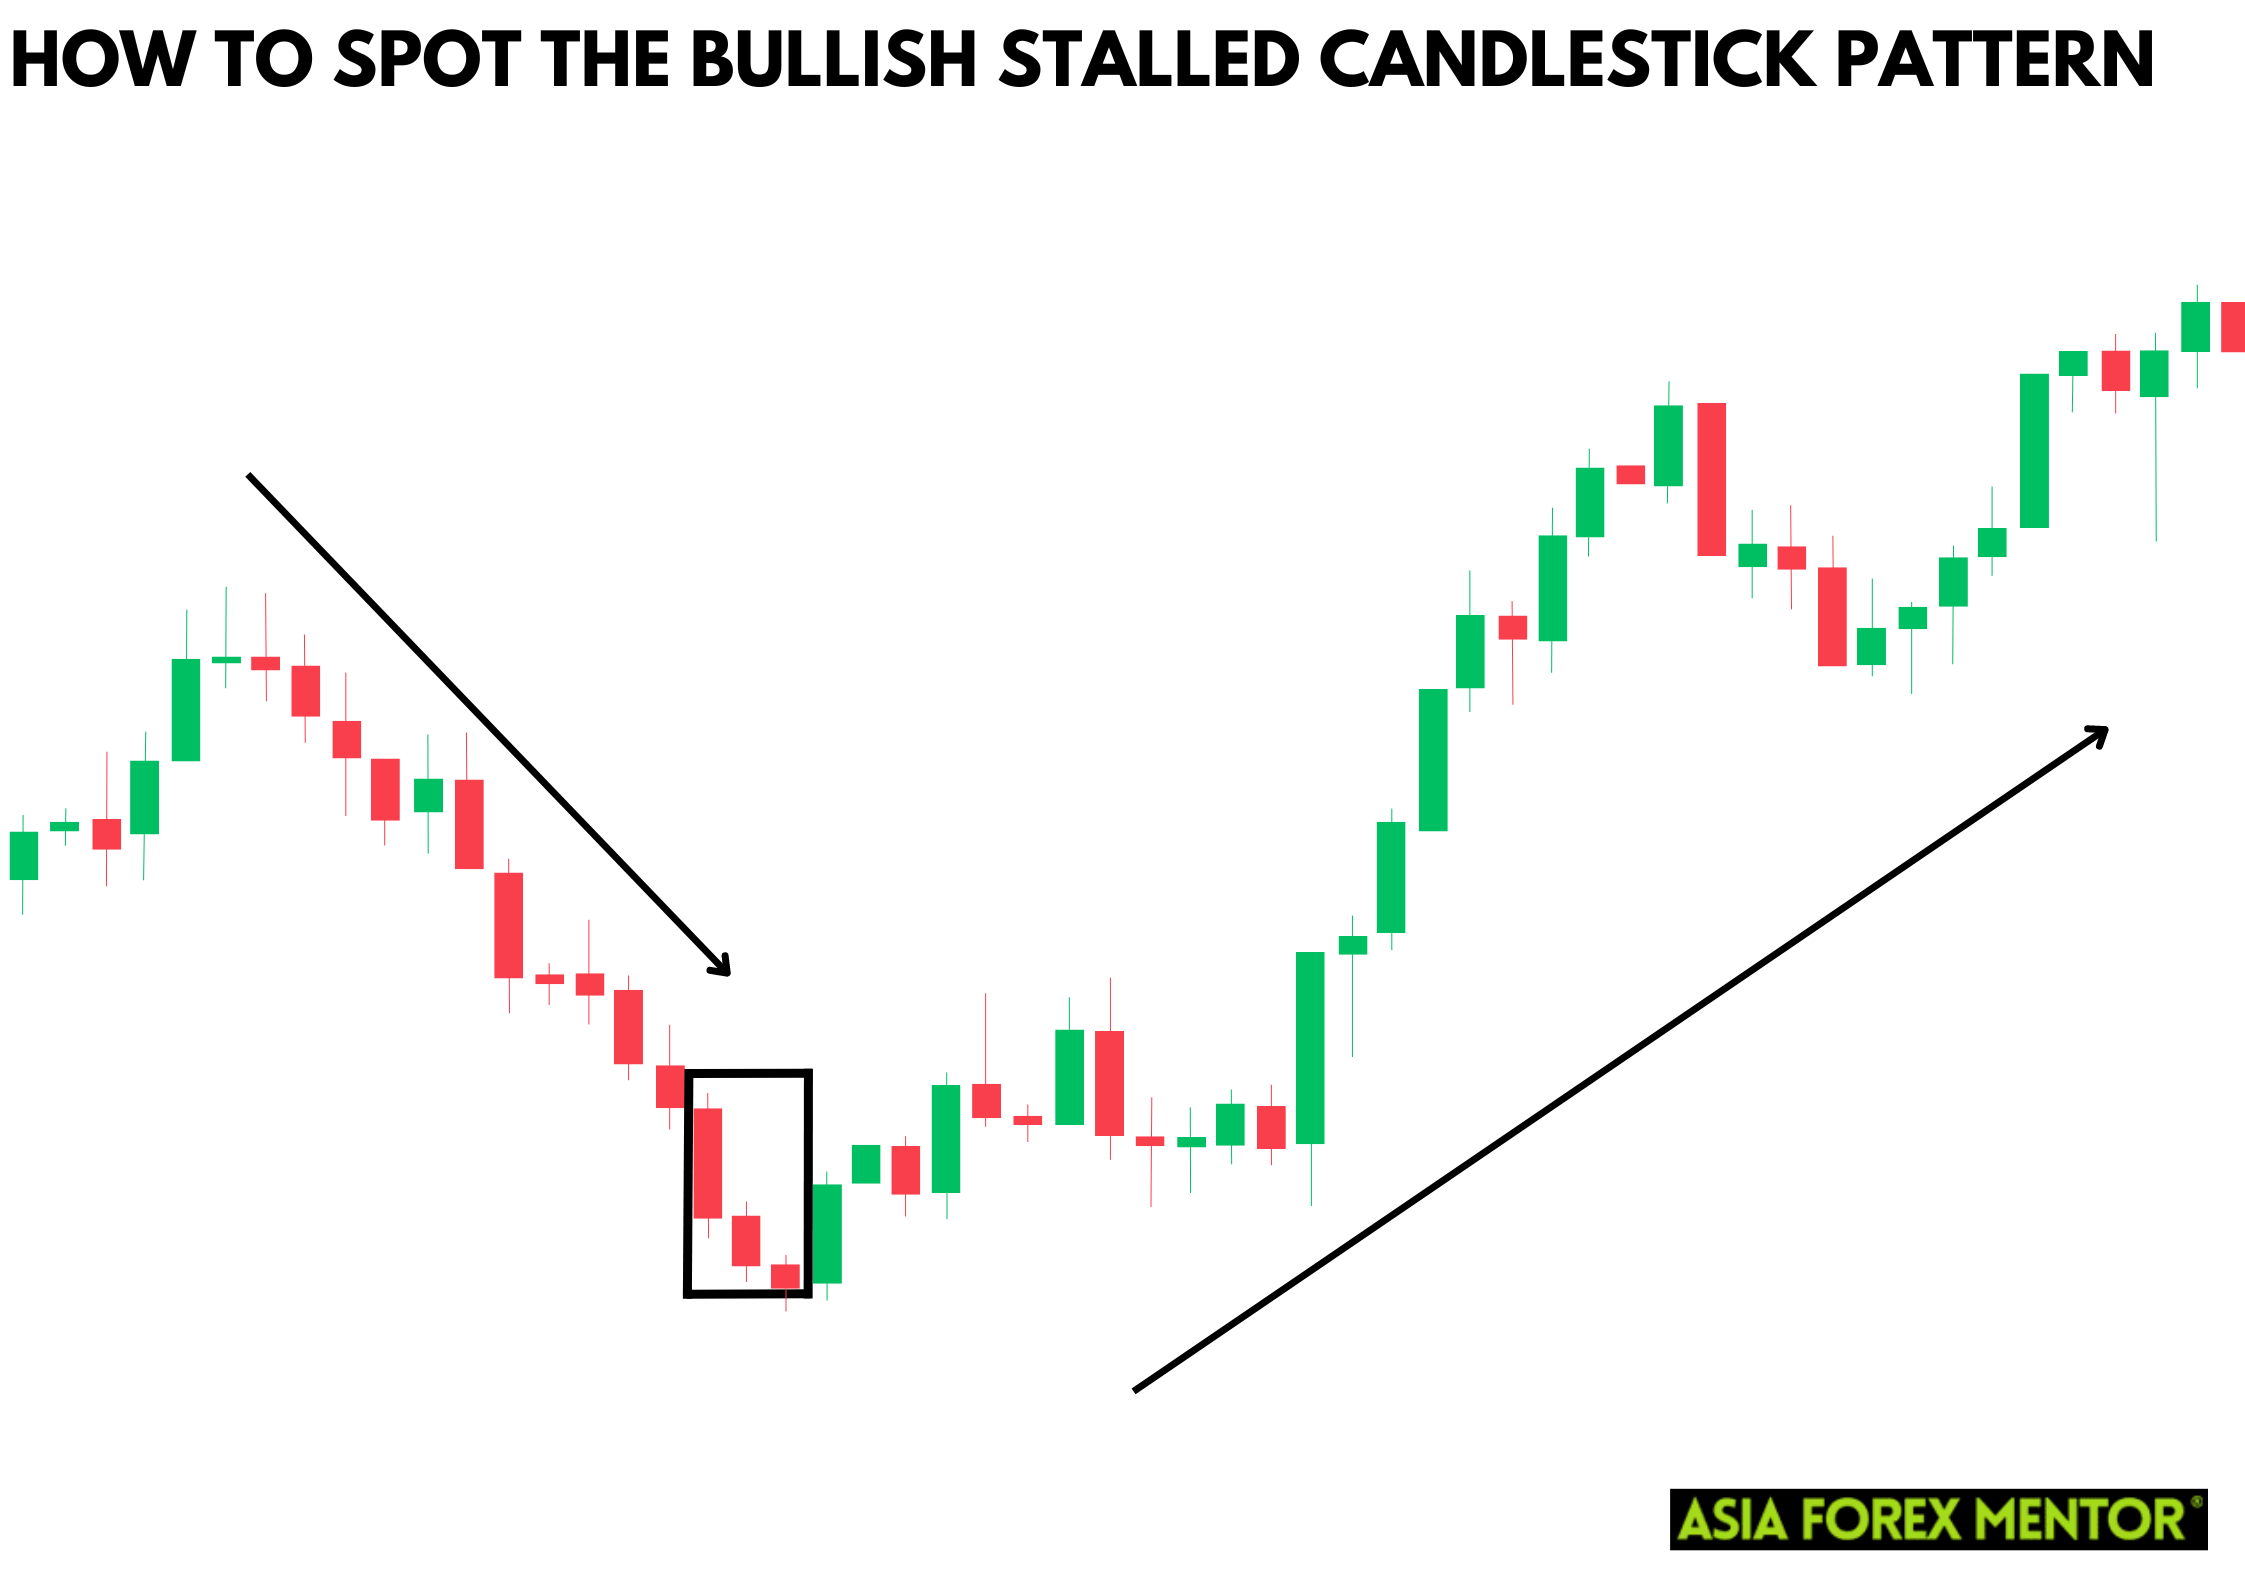
Spotting the bullish stalled candlestick pattern involves careful analysis of candlestick charts. Here are the steps to identify this pattern:
- Identify a Downtrend: The pattern usually appears after a series of bearish candles.
- Observe the First Candle: Look for a long bearish candle with a large real body.
- Check the Second Candle: The second candle should also be bearish but smaller in size, indicating a reduction in selling pressure.
- Find the Third Candle: The third candle is the smallest with a long upper shadow, suggesting the bears are losing control and a bullish reversal might be imminent.
How to Trade the Bullish Stalled Candlestick Pattern
Entry Point
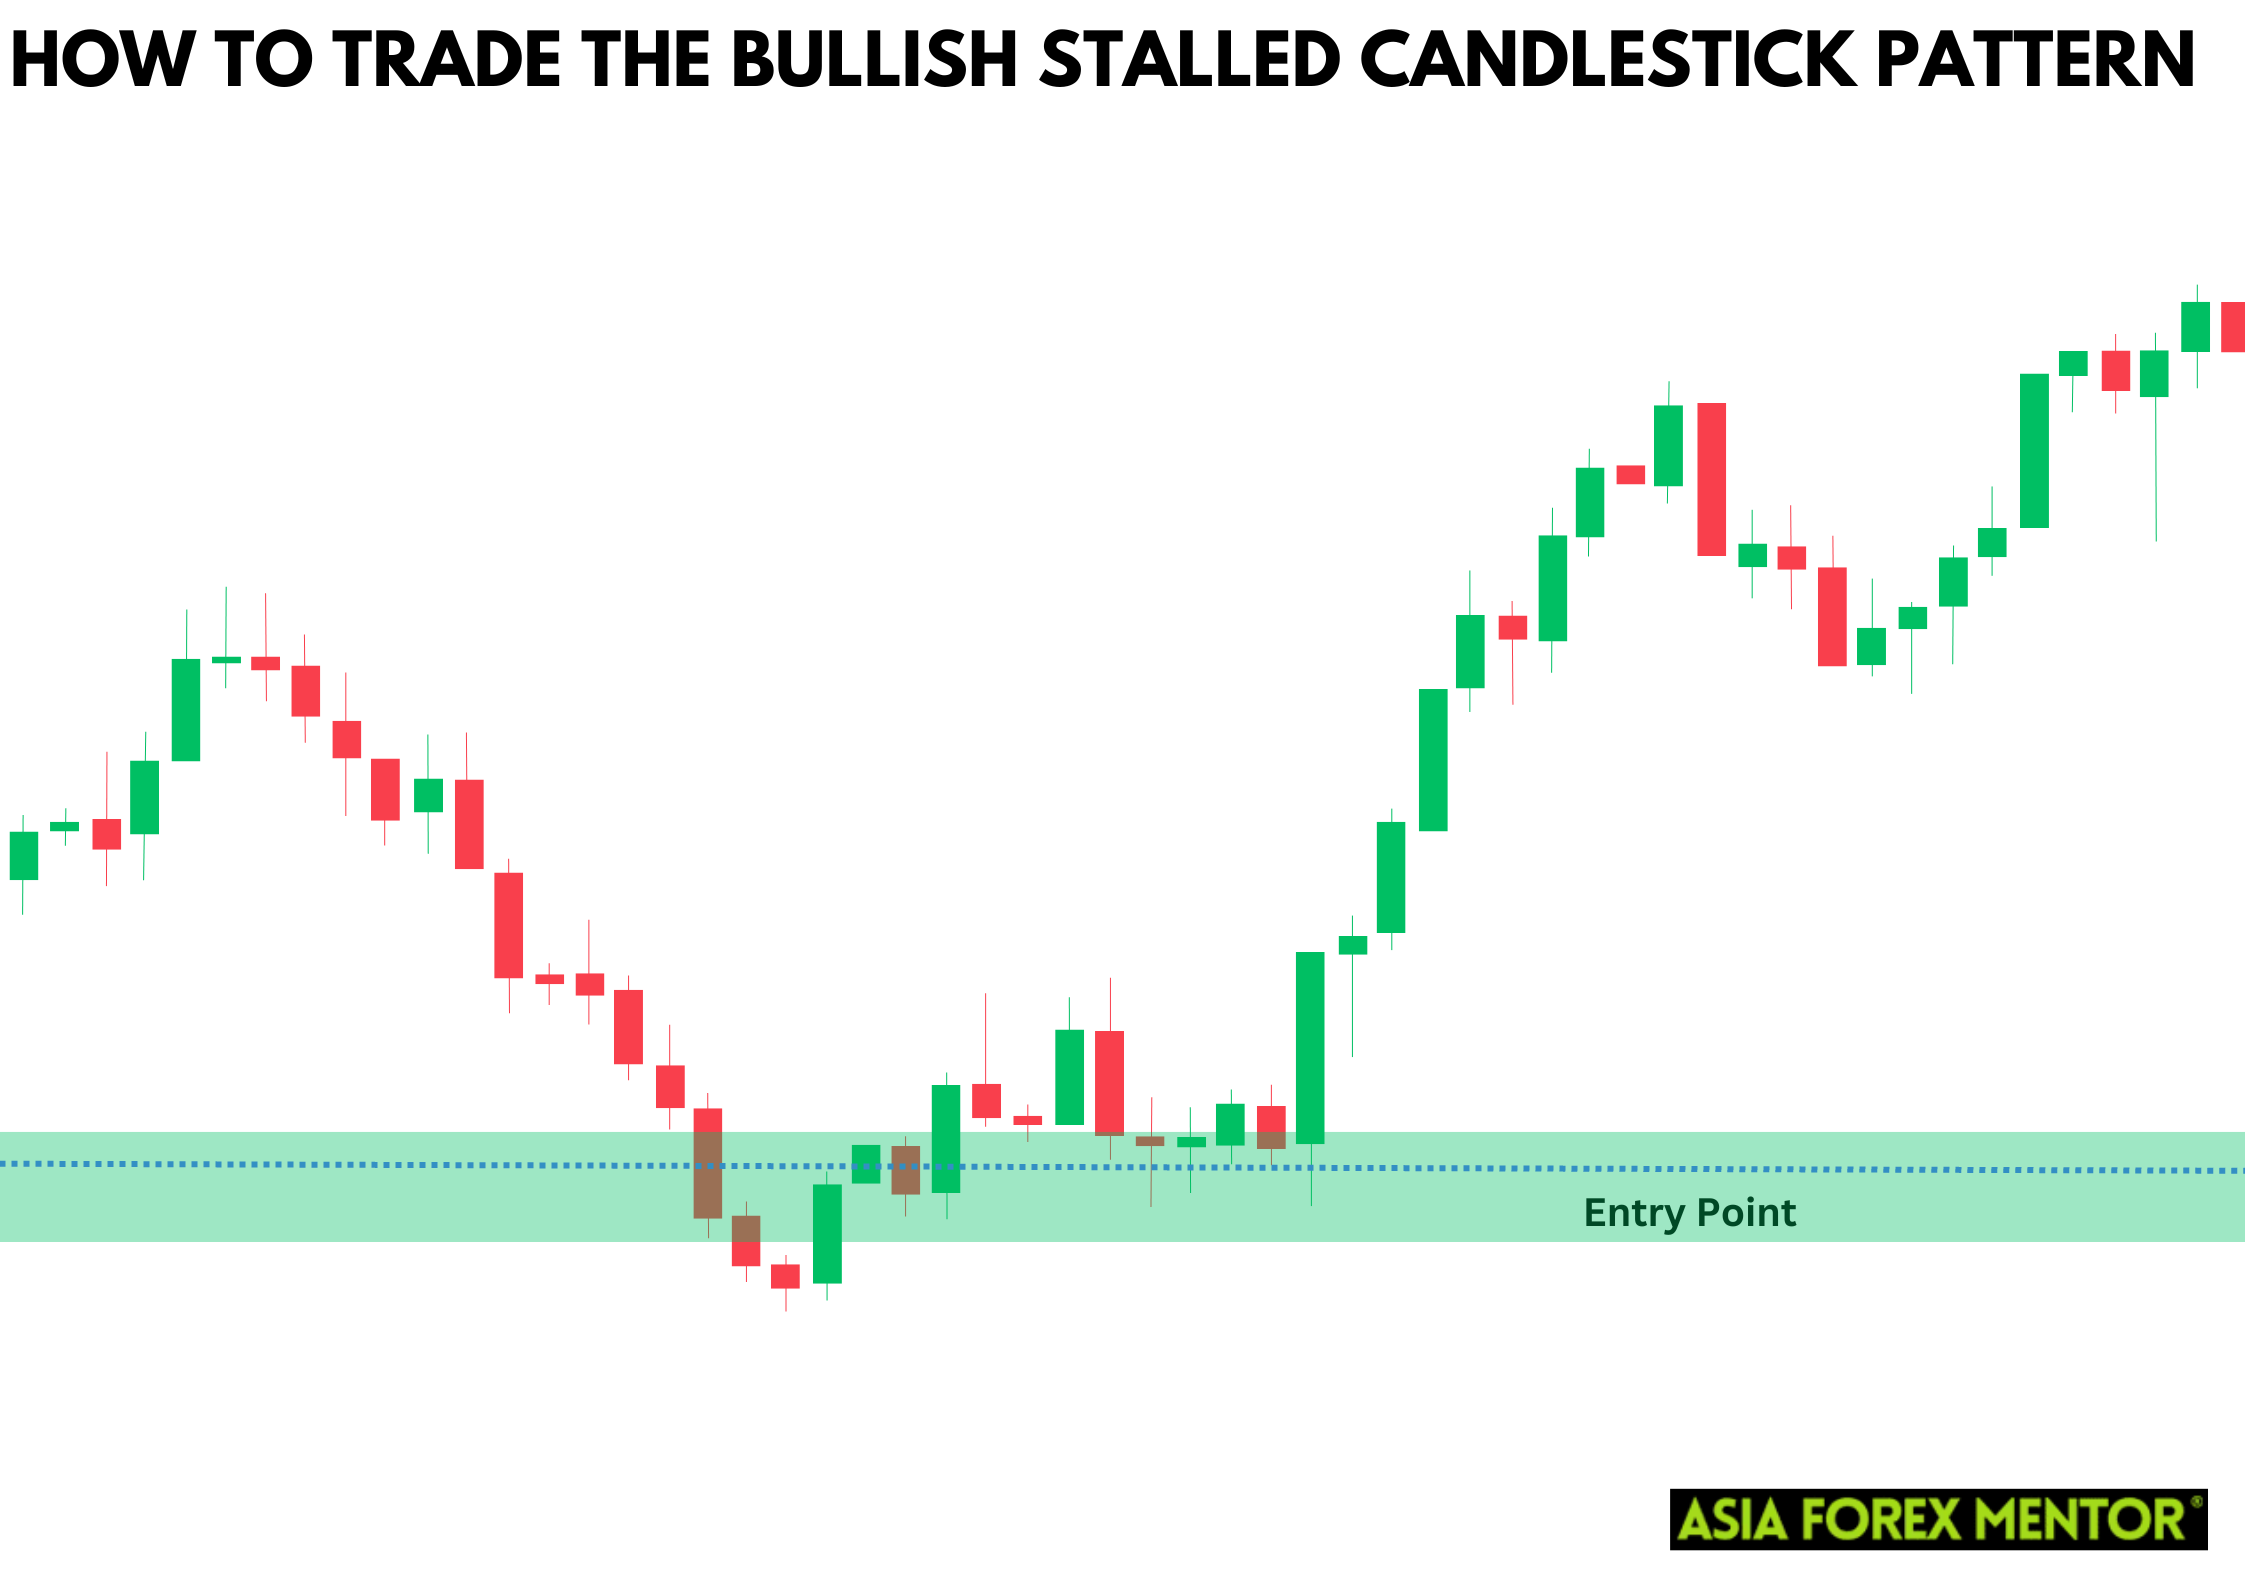
To trade the bullish stalled candlestick pattern, you should enter the trade at the opening price of the subsequent bullish candle that confirms the reversal. This next candle must close above the high of the third candle in the pattern, indicating a significant shift in market sentiment from bearish to bullish. By waiting for this confirmation, traders can reduce the risk of entering too early and ensure that the bullish reversal is genuinely taking place. This method relies on the idea that the closing price above the previous high is a strong signal that the market has embraced the bullish trend.
Stop Loss
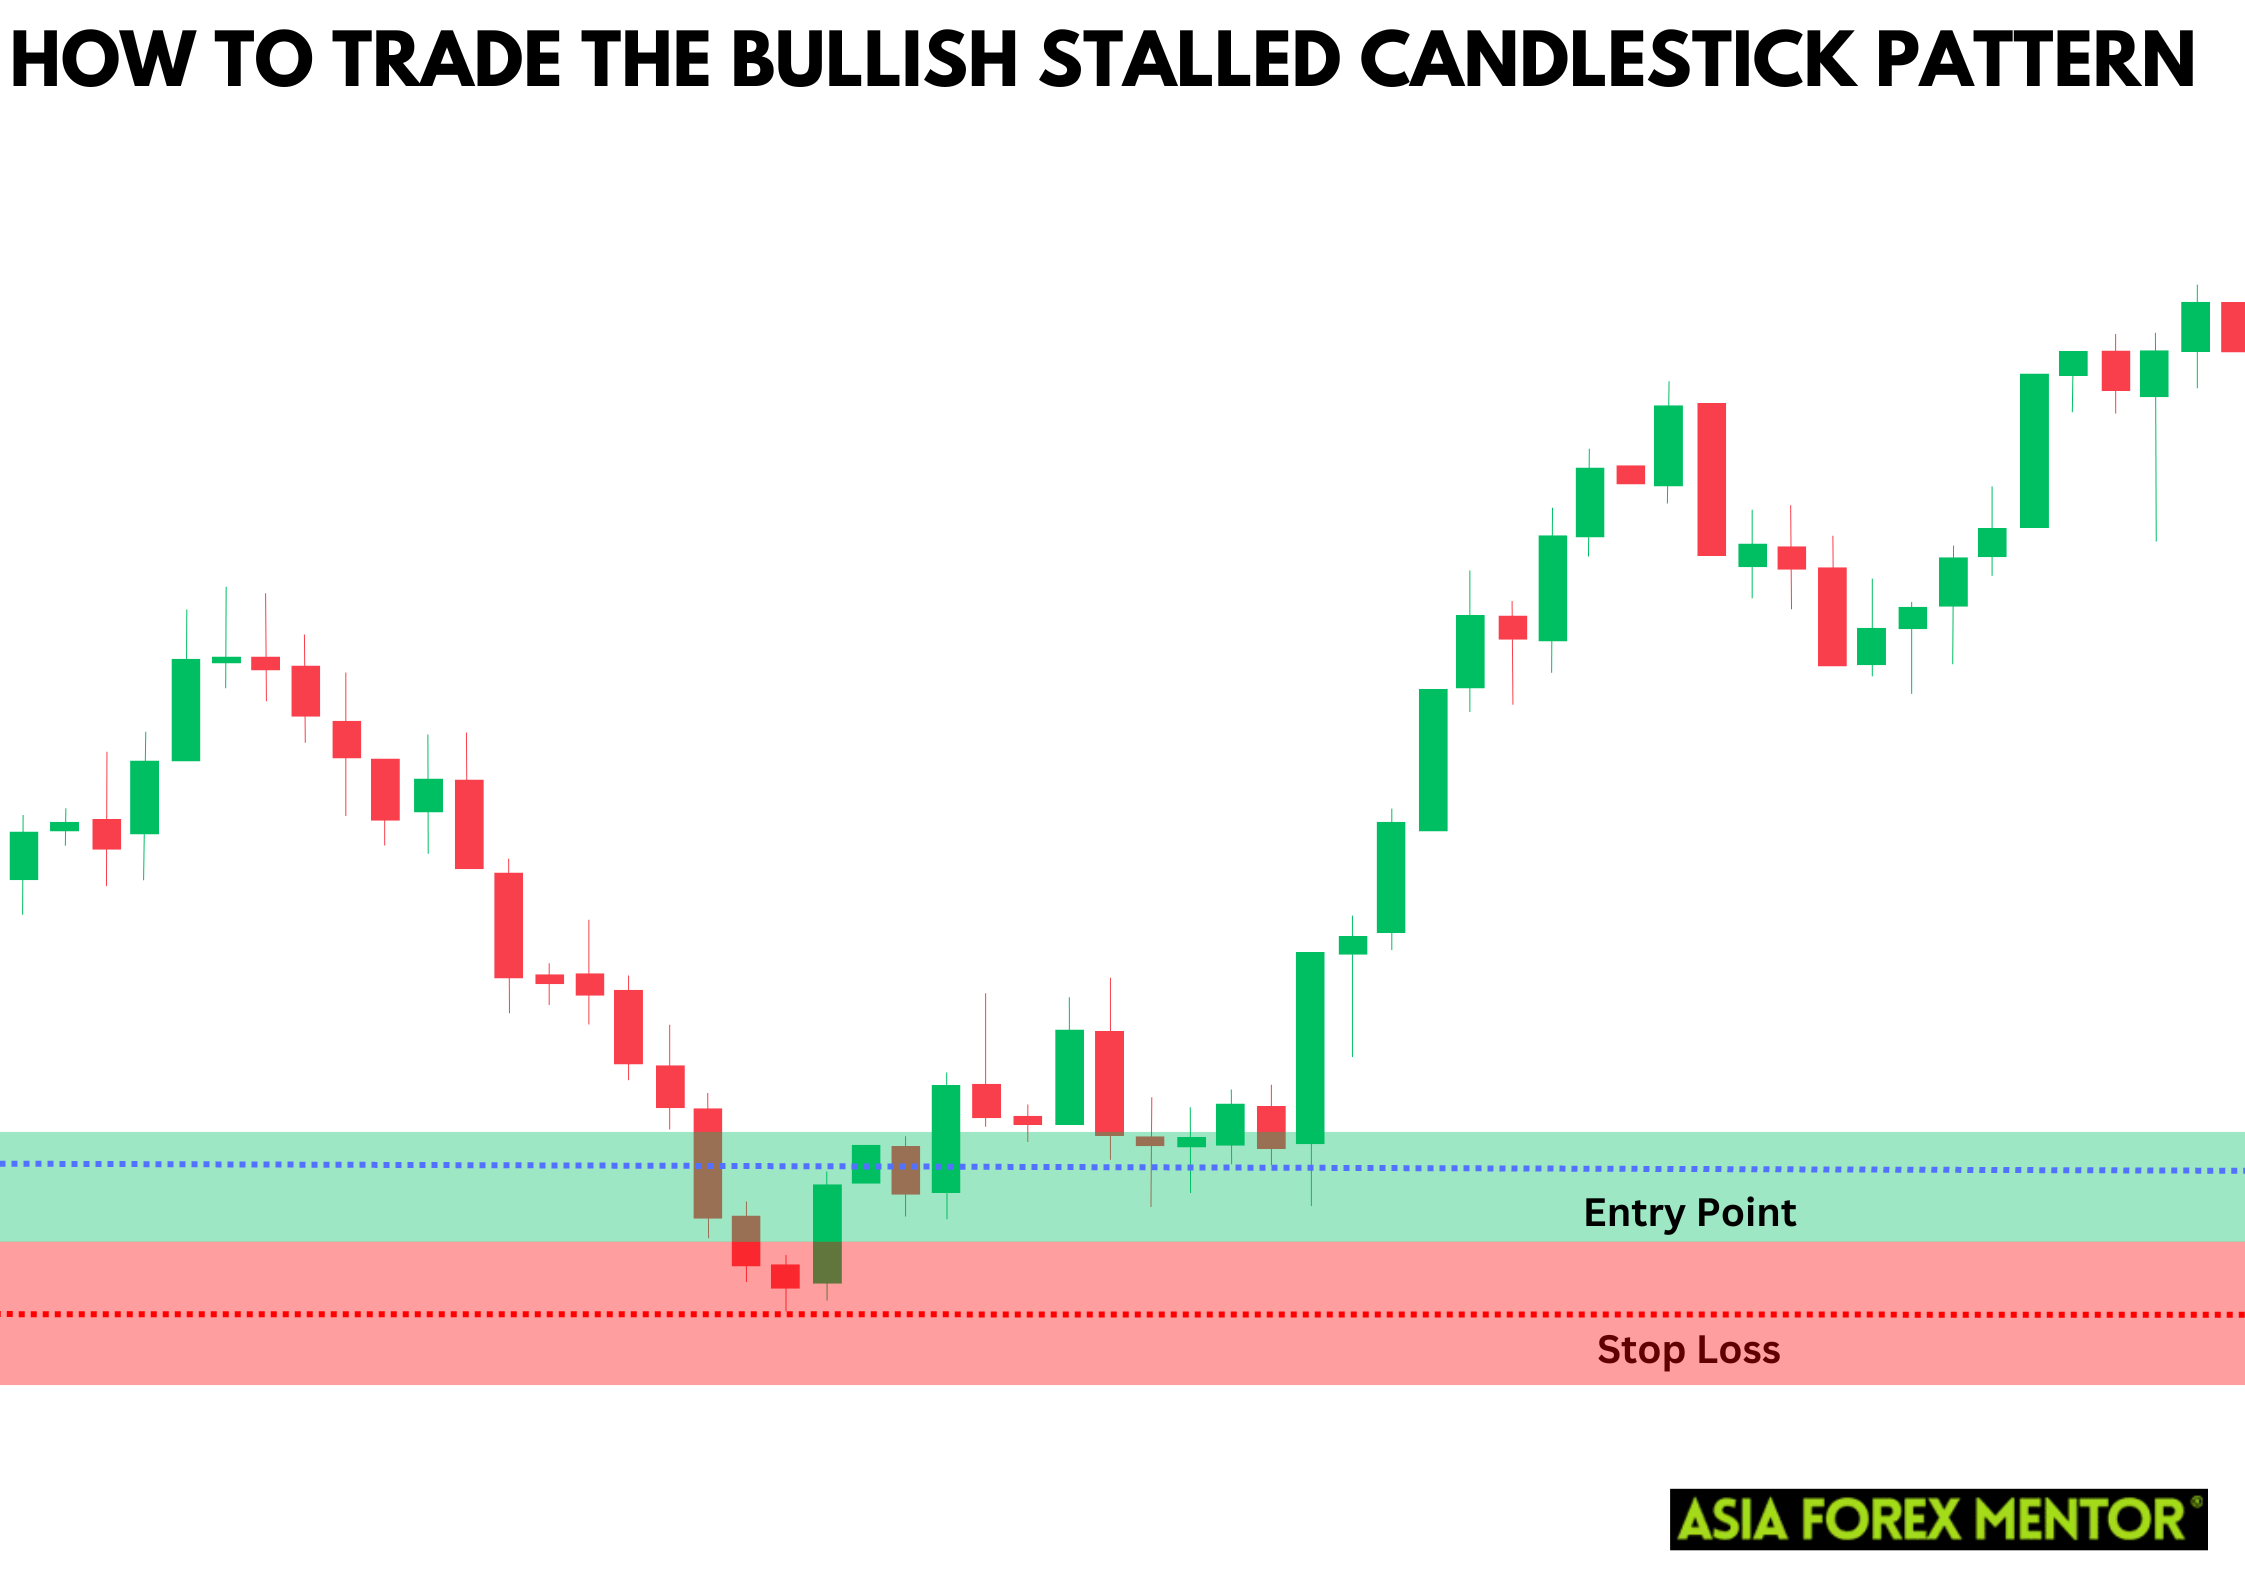
When trading the bullish stalled candlestick pattern, placing a stop-loss order below the low of the third candle is essential for risk management. This strategy helps protect against potential false signals and minimizes losses if the bearish trend unexpectedly continues. By setting the stop loss at this point, traders create a safety net that automatically exits the trade if the market moves against them, preserving capital and preventing significant financial damage. This precautionary measure is crucial in volatile markets, where sudden reversals can occur.
Profit Target
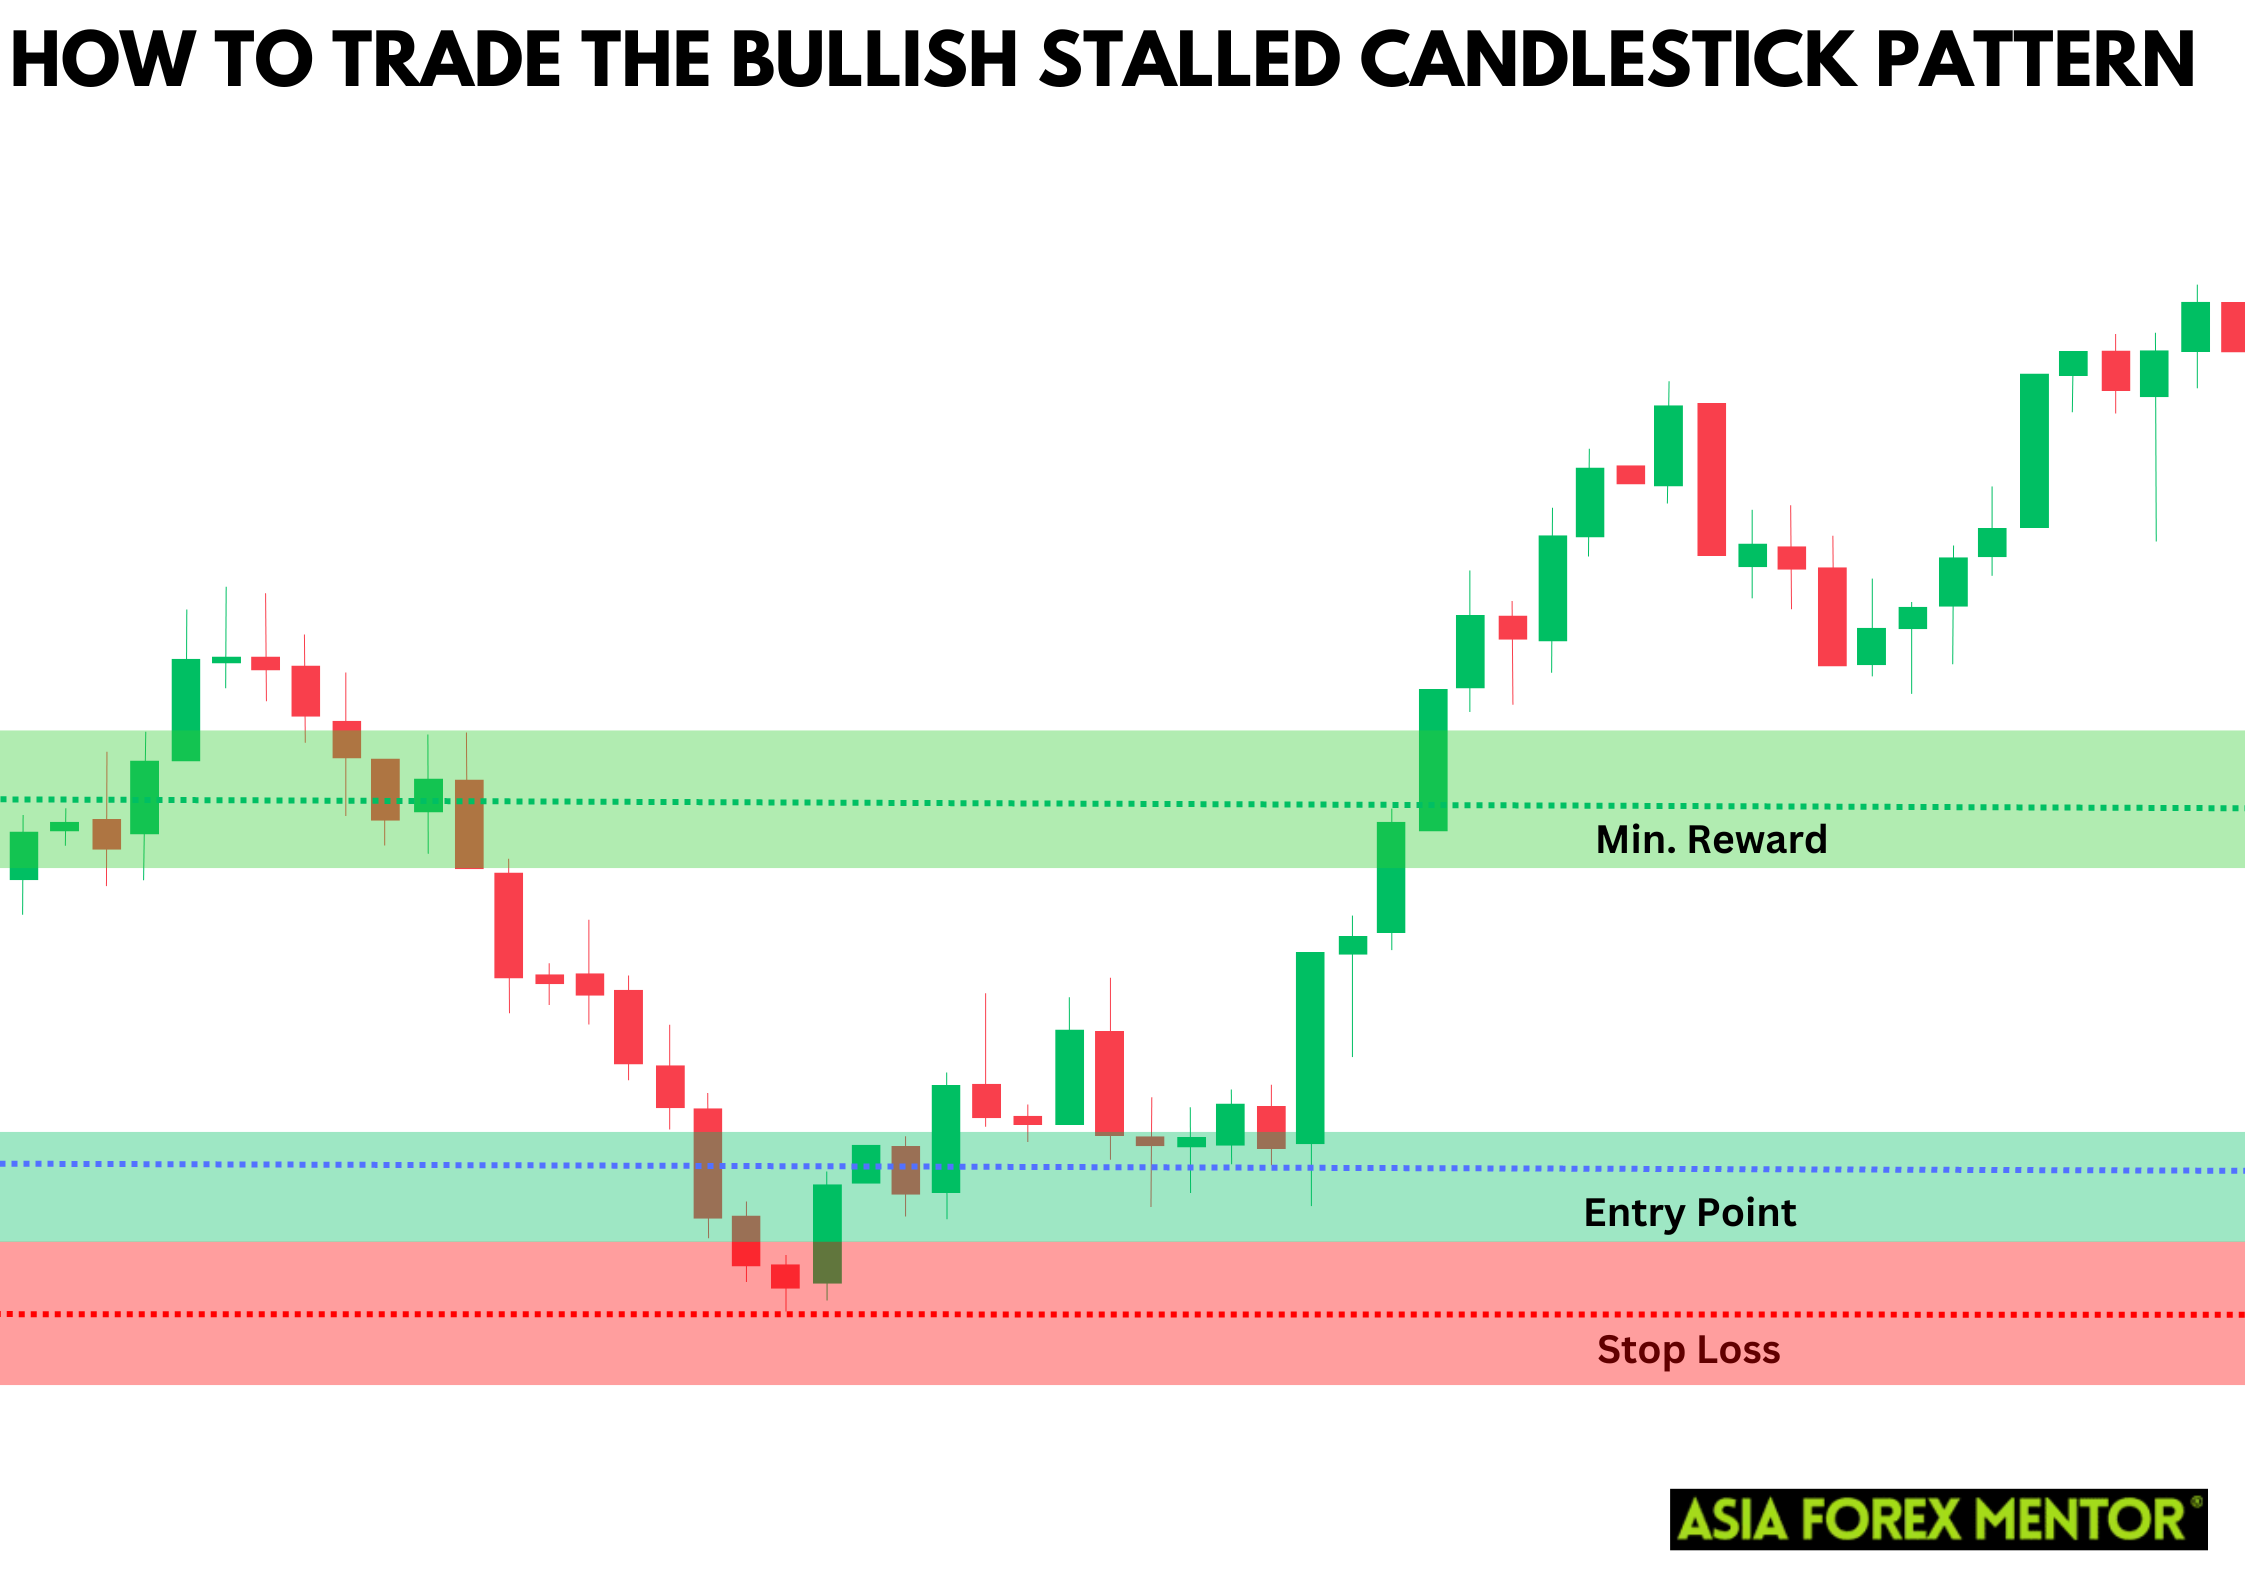
When trading the bullish stalled candlestick pattern, it is crucial to set a well-defined profit target to ensure that the potential profit justifies the risk taken on the trade. One effective method is to base your profit target on previous resistance levels. These levels act as potential barriers where the price might reverse or stall, providing a logical point to exit the trade and realize profits. Alternatively, using a risk-reward ratio of at least 2:1 can be a sound strategy. This means that for every unit of risk, you aim to make at least two units of profit, ensuring that your trades have a favorable balance between risk and reward.
Pros and Cons of the Bullish Stalled Candlestick Pattern
Pros:
- The pattern's clear structure makes it easy to spot on candlestick charts.
- It can provide early signals of a potential bullish reversal during a downtrend.
Cons:
- The pattern is not always reliable and can sometimes lead to false signals.
- It is crucial to confirm the pattern with other technical indicators to ensure its validity.
Indicators to Use to Confirm the Pattern
To increase the reliability of the bullish stalled candlestick pattern, use additional technical indicators such as:
- Moving Averages: To identify the overall trend and confirm the reversal.
- Relative Strength Index (RSI): To determine if the asset is oversold and ripe for a reversal.
- Volume: Increased trading volume can confirm the strength of the reversal signal.
Conclusion
The bullish stalled candlestick pattern is a valuable tool for traders looking to identify potential trend reversals. By understanding its characteristics and using additional technical indicators for confirmation, traders can make more informed decisions and optimize their trading strategies.
Also Read: How to Trade the Bearish Counterattack Lines Pattern
FAQs
What does the bullish stalled candlestick pattern indicate?
The pattern indicates a potential bullish reversal during a downtrend, suggesting that the bearish momentum is weakening and a bullish trend may emerge.
How reliable is the bullish stalled candlestick pattern?
While it can be a useful indicator, the pattern is not always reliable on its own. It should be confirmed with other technical analysis tools for better accuracy.
Can the bullish stalled candlestick pattern appear in an uptrend?
No, the bullish stalled candlestick pattern typically appears during a downtrend and signals a potential reversal to a bullish trend.