Also Read: Crypto Leverage
Contents
- What is a Heat Map in Crypto?
- Understanding the Heat Map
- The Function of a Heat Map
- What Is the Purpose of Heat Maps?
- Advantages and Disadvantages
- Conclusion
- FAQs
What is a Heat Map in Crypto?
A heat map is a visual graph chart illustration of data that uses colours to illustrate variables.
They aggregate data and then portray it in graphical form, because of this heat maps give an effective visible overview of the information.
The fundamental benefit of a heat map above a worksheet as a visualization instrument is that it enables real-time communication of a high-level volume of data and price.
Understanding the Heat Map
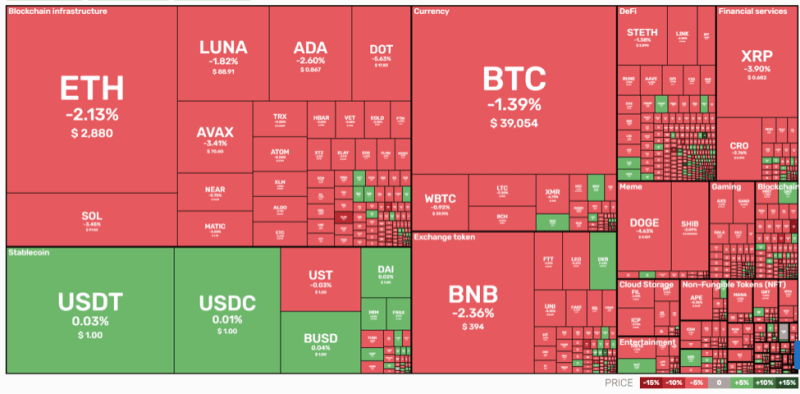
You can view a visual chart including the percentile performance coins have made during the day by hovering over any region of the heat map.

Heat maps may provide a wealth of information and log in a short amount of time.
The fascinating thing with heat maps is that they started out as 2-dimensional representations of data matrix values, with greater values illustrated by black squares or a heavy gray and lesser values shown with a softer square.
The Function of a Heat Map
A heat map is a type of visualization technique that displays data in color. It is a two-dimensional visual representation of information in which distinct components are represented by different colors.
Heat maps may be a useful visual tool for interpreting data.
Conversely, from the other side of the scale, this data is partial and obscures the overall view. When basic information is needed, a map is employed.
A heat map is a type of representation that highlights a certain piece of data or dataset and has specialized applications.
Heat maps are used to analyze info and might include a high level of customization to provide as much information to the user as feasible.
Consider a heat map as a computation painting that is superimposed over imagery and is dependent on statistics on a painting.
A picture is split into squares, and the heat map within every square enables your eye to record the relationship between the intensity of the readings by giving each measurement a colour representation.
Also Read: What Is Crypto Halving
What Is the Purpose of Heat Maps?
Heat maps are visual representations of where money is in the crypto market and how money suppliers are acting.
It's a method of determining where genuine market orders are placed in various markets.
The heat map is a visual depiction of the pending orders that are entered into the order book of account.
Advantages and Disadvantages
Advantages
There are several types of heat maps, and most of them have varied color and patterns for illustrating the heat map. This has both perceived benefits and drawbacks.
Rainbow color mappings, for example, are frequently utilized since individuals can sense greater tones of color than gray areas, increasing the number of trading features perceptible by a single view.
Please remember that heat maps are utilized in a variety of analytics applications, such as displaying asset prices. They are, however, sometimes used to display user activity on certain internet pages or site layouts.
In reality, heat maps may be used to illustrate where people have visited a website page, how much they've browsed, or the outcomes of other experiments.
Experts use heat maps in corporate structures to determine the degree of performance of the firm's many segments, define goals and priorities, and indicate points of risk.
Improved communication, increased engagement, and the capacity to gain meaningful insights from large data volumes are all advantages.
Disadvantages
Heatmaps may be deceiving sometimes because they use enormous amounts of data that may not have all of the necessary info to make an accurate prediction about a certain tendency.
Heat maps depict specific events, but they don't tell you why they happened, what causes were at play at the time, or what the future holds.
They are frequently created before all the statistics on a certain issue are published in order to present readers with some early insights.
Conclusion
A Crypto heat map may not be useful to certain types of traders, but lots of professional analysts use it to monitor how money flows from large-cap to small-cap.
It shows the market cap of the various coins in a single graph. If properly used, it can change the dynamics of your trading plan.
FAQs
What is a crypto heat map?
By examining heatmaps, one may determine how cash flow in the market behaves. It assists us in determining how requests are carried out. The trade book's pending orders are shown by the heat mapping.
What is COIN360?
COIN360 is an internet data aggregation platform that collects data from bitcoin exchanges as well as real-time data. We want to make crucial market data aesthetically appealing.
What is crypto dominance?
BTC Supremacy is a metric that determines how much of the overall cryptocurrency market value is made up of BTC.
It can assist you in deciphering the Bitcoin and altcoin trends. Take a look at the latest BTC market share.
In the crypto world, what does staking imply?
Staking allows cryptocurrency owners to place their holdings to work hard and support with residual income without having to sell.
Staking may be compared to placing money in a savings account in the cryptocurrency industry.