What if I told you there was a low-risk trick you could employ to sell near the top during an uptrend and buy near the bottom after a downtrend? It’s one of the most sought-after “holy grails” in the trading realm, after all.
Better yet, what if when you’re in long positions, you could know in advance when it’s time to exist instead of watching as your “not yet locked-in profits” (aka. your future Christian Louboutin high heels or your potential Aston Martin) slowly vanish before your very eyes because the bullish or bearish trend has started to reverse?
Well, today is your lucky day, as it’s the day you learn how to accomplish everything listed above. It’s called divergence trading.
Using the divergence trading cheat sheet we’re going to share today, some traders have even been able to short currency pairs that they believed would keep falling at perfect entry levels and better price points. Without further ado, let’s jump right into it and learn how to improve your chances of always buying high and selling low.
Also Read: What Is Hidden Bullish Divergence
Contents
- What Is Are Trade Divergences?
- Two Kinds of Trading Divergence Signals
- The Best Indicator for Identifying Divergences
- Additional Divergence Cheat Sheet Tips
What Is Are Trade Divergences?
Simply think of lower lows and higher highs.
Price and momentum oscillators usually move hand in hand, like salt and pepper, Shaq and Kobe, Beyonce and Jay Z, Batman and Robin, Ryu and Ken, Hansel and Gretel, and avocado and toast… I hope you get the point we’re trying to drive.
So, when the price makes higher highs on the price chart, the momentum oscillator should also make higher high price points. And if the price makes lower lows on the price chart, then the momentum technical indicator should also make lower low price points.
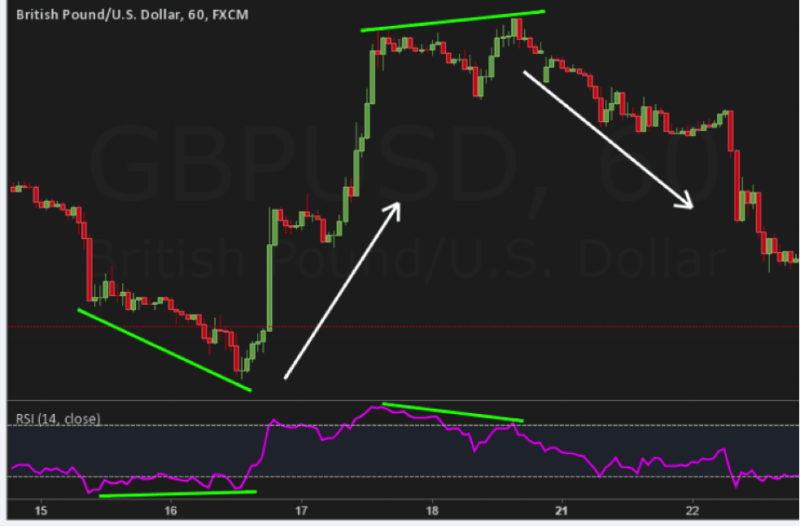
That said, if the two above aren’t in alignment, as shown in the image above, that means the price and the technical indicator are diverging from one another. That’s what is called a trade divergence.
Now, as you’re about to learn, the ability to detect divergence signals is an excellent skill all traders should have in their toolboxes. Why? Because when a divergence occurs, it signals that something peculiar is happening in the market, and you need to pay close attention to the currency pair in front of you.
Divergences usually signify that the uptrend or downtrend is weakening and the price changing direction is imminent. Sometimes you can even use it as a trend continuation indicator. But first, you’ll need to understand the two kinds of trading divergences.
Two Kinds of Trading Divergence Signals
There are two kinds of divergences in any financial market: the regular divergence and hidden divergence. A regular divergence indicates a possible trend reversal, while a hidden divergence indicates trend continuation.
The general idea is that regular divergence signals show momentum may be leaving the trend, which awards traders early signs of a trend reversal (be it an uptrend or downtrend.) With hidden divergences, however, it’s an indication that more momentum is pouring into the current bullish or bearish trend, making a trend continuation extremely likely.
What’s more? Both regular divergence and hidden divergence signals have been further subdivided into two categories.
Under regular divergence patterns, you’ll find:
- Regular bullish divergence signals
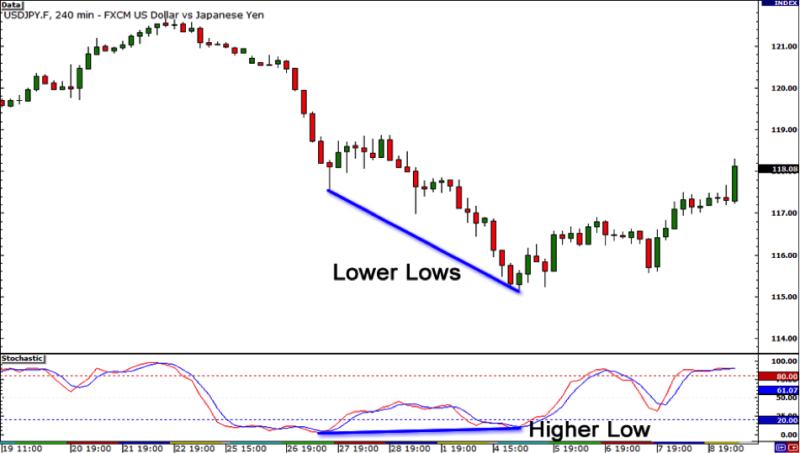
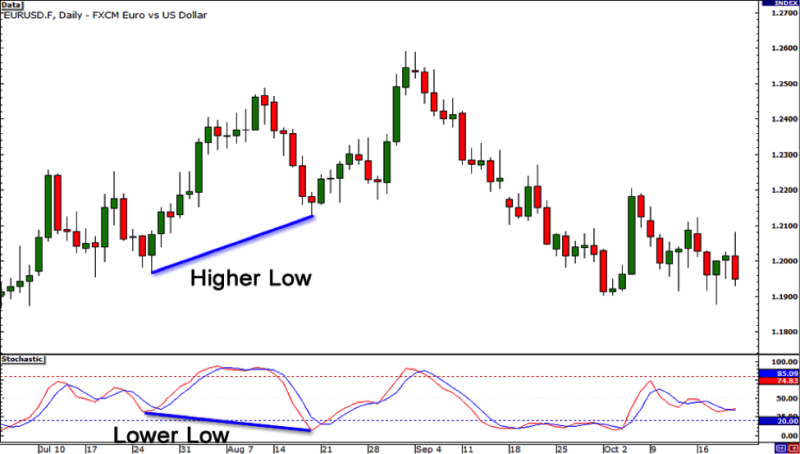
Regular bullish divergence signals occur when prices fall to a lower low, but the momentum oscillator fails to fall to a lower low. The situation demonstrates that bears in the market are losing power, and bulls are beginning to control the market again. As you can probably already deduce, regular bullish divergence signals occur during a downtrend and usually mark its end.
- Regular bearish divergence signals
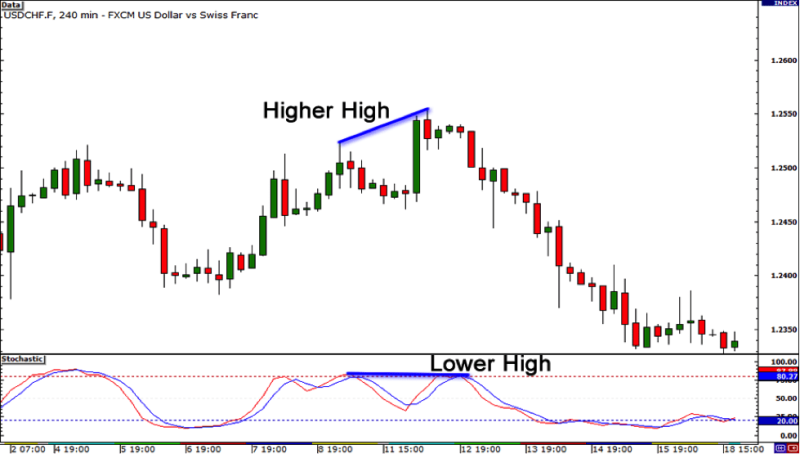
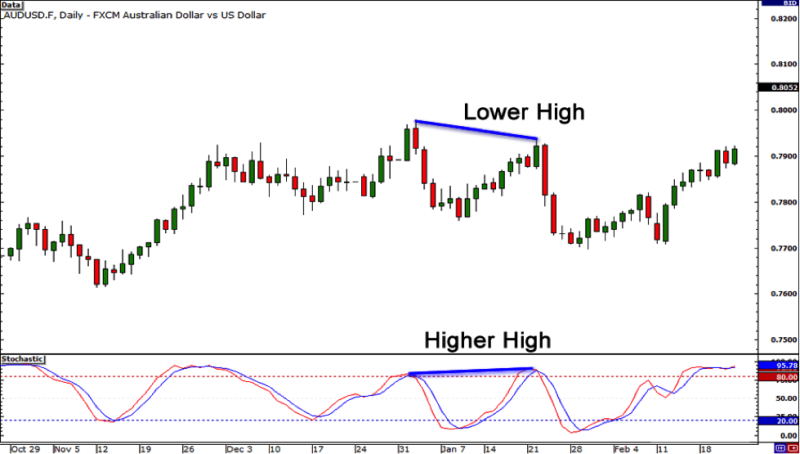
Regular bearish divergence signals occur during an uptrend and usually mark the end of the trend before a movement in the opposite direction. These regular bearish divergence signals occur when the market price shows a higher high, but the indicator shows a lower high.
In this situation, the market shows that bullish traders are starting to lose their grip on the market, and the price could only be on its current uptrend due to surplus inertia. On the other side, bearish traders are ready to retake market control.
Under hidden divergence patterns, you’ll find:
- Hidden bearish divergence signals
As pointed out earlier, the hidden bearish divergence occurs during a bearish trend and signals that more momentum is pouring into the trend, which means you can expect a continuation. While trading, you can recognize these hidden bearish divergence patterns when the market price makes a lower high, but the momentum indicator makes a higher high.
- Hidden bullish divergence signals
Hidden bullish divergence patterns are market setups where the momentum indicator forms a lower low, but the price chart shows a higher low. After everything we’ve discussed, you probably already know that hidden bullish divergence patterns occur in a bullish trend.
Also worth noting, these hidden bullish divergence patterns can frequently be seen in market trading conditions where the price has executed a pullback from a strong bullish trend or is consolidating.
The Best Indicator for Identifying Divergences
I hope you love where this divergence cheat sheet is headed so far. But we’re not done. Next, we’ll look at the best indicator you should use to identify divergence signals, after which we’ll look at additional tips to keep in mind while trading both regular and hidden divergences.
Honestly, no single technical analysis indicator will be perfect for trading divergence formation. In truth, however, some are more reliable than others. The three most popular in the trading realm are the relative strength index rsi indicator, the commodity channel index, and the moving average convergence divergence (MACD.)
If we had to pick one of the three, the rsi indicator would easily win as the most popular. For new traders, the RSI indicator is a momentum indicator plotted on financial markets as an oscillator under the candlesticks chart: hence why the rsi is also known as an underlay indicator.
The rsi shows the speed and change of price movements by calculating the average price gain and losses over the last 14 days, then plotting them as an oscillator between 0 and 100. Oh, and by the way, the 14-day rsi period is just the default setting. You can change it to any figure you wish, but remember that 14 is the most reliable figure.
Another thing worth noting: if you set our rsi period to 14, expect the indicator to give way fewer rsi divergences than if you used a lower figure. On the other hand, however, this allows you to rest assured that the rsi divergence signals you receive are highly reliable.
Also Read: The RSI Forex Indicator Complete Guide
Additional Divergence Cheat Sheet Tips
Here are 3 additional tips and tricks you should add to your divergence cheat sheet table.
- Keep Your Trail of Thought Clean
Without this point, any guide on creating a divergence cheat sheet would be incomplete. For a divergence to be reliable, the price chart should form one of the following:
- Double Bottom
- Double Top
- Lower low than the previous low
- Higher high than the previous high
You shouldn’t even bother looking at an rsi indicator for a sell or buy signal if NONE of these four scenarios has occurred.
- Take A Step on The Time Frame
Divergence signals tend to be way more accurate if they’re on a higher time frame. You’ll get fewer signals, sure, but if you structure your trades well, the profit potential will be huge as well. On lower time frames, however, divergences occur more frequently but are always way less reliable.
- If The Divergence Ship Has Failed On The Time Frame You’re Trading, Catch The Next One
If you spot a rsi divergence or otherwise, but the price has already reversed and has been moving in opposite directions for a while, you should consider the rsi divergence already played out. Accept that you’ve missed the boat this round.
Instead, watch the price chart, wait for new higher lows or lower highs to form, and begin your search for rsi divergence formations all over again.