Learn To Trade Forex • Best Forex Trading Course • AsiaForexMentor

How to Trade the Dumpling Top Pattern

Written by

Ezekiel Chew

Updated on

January 21, 2025

i

How to Trade the Dumpling Top Pattern

Written by:

Last updated on:

January 21, 2025

The dumpling top pattern is a unique candlestick pattern that traders use to predict potential bearish reversals in the market. Originating from Japanese candlesticks analysis, this pattern is visually reminiscent of a rounded top, similar to the western rounded bottom top. Often compared to the japanese fry pan bottom, the dumpling top signals the opposite market direction. Understanding and utilizing the dumpling top can help traders anticipate market shifts, providing opportunities to profit from bearish reversal trends.

To effectively trade the dumpling top pattern, traders need to recognize its formation and understand its implications. The pattern suggests a gradual shift from bullish to bearish sentiment, often marked by a bearish gap opening following the rounded top. This structure, akin to a frying pan, indicates weakening bullish momentum and the start of a bearish trend. By spotting these cues, traders can strategically position themselves to benefit from the resulting price action. Market gaps and several Japanese candlesticks forming a smooth, rounded top provide further confirmation for this reversal pattern.

Also Read: Mastering Japanese Candlestick Patterns

What is the Dumpling Top Pattern?
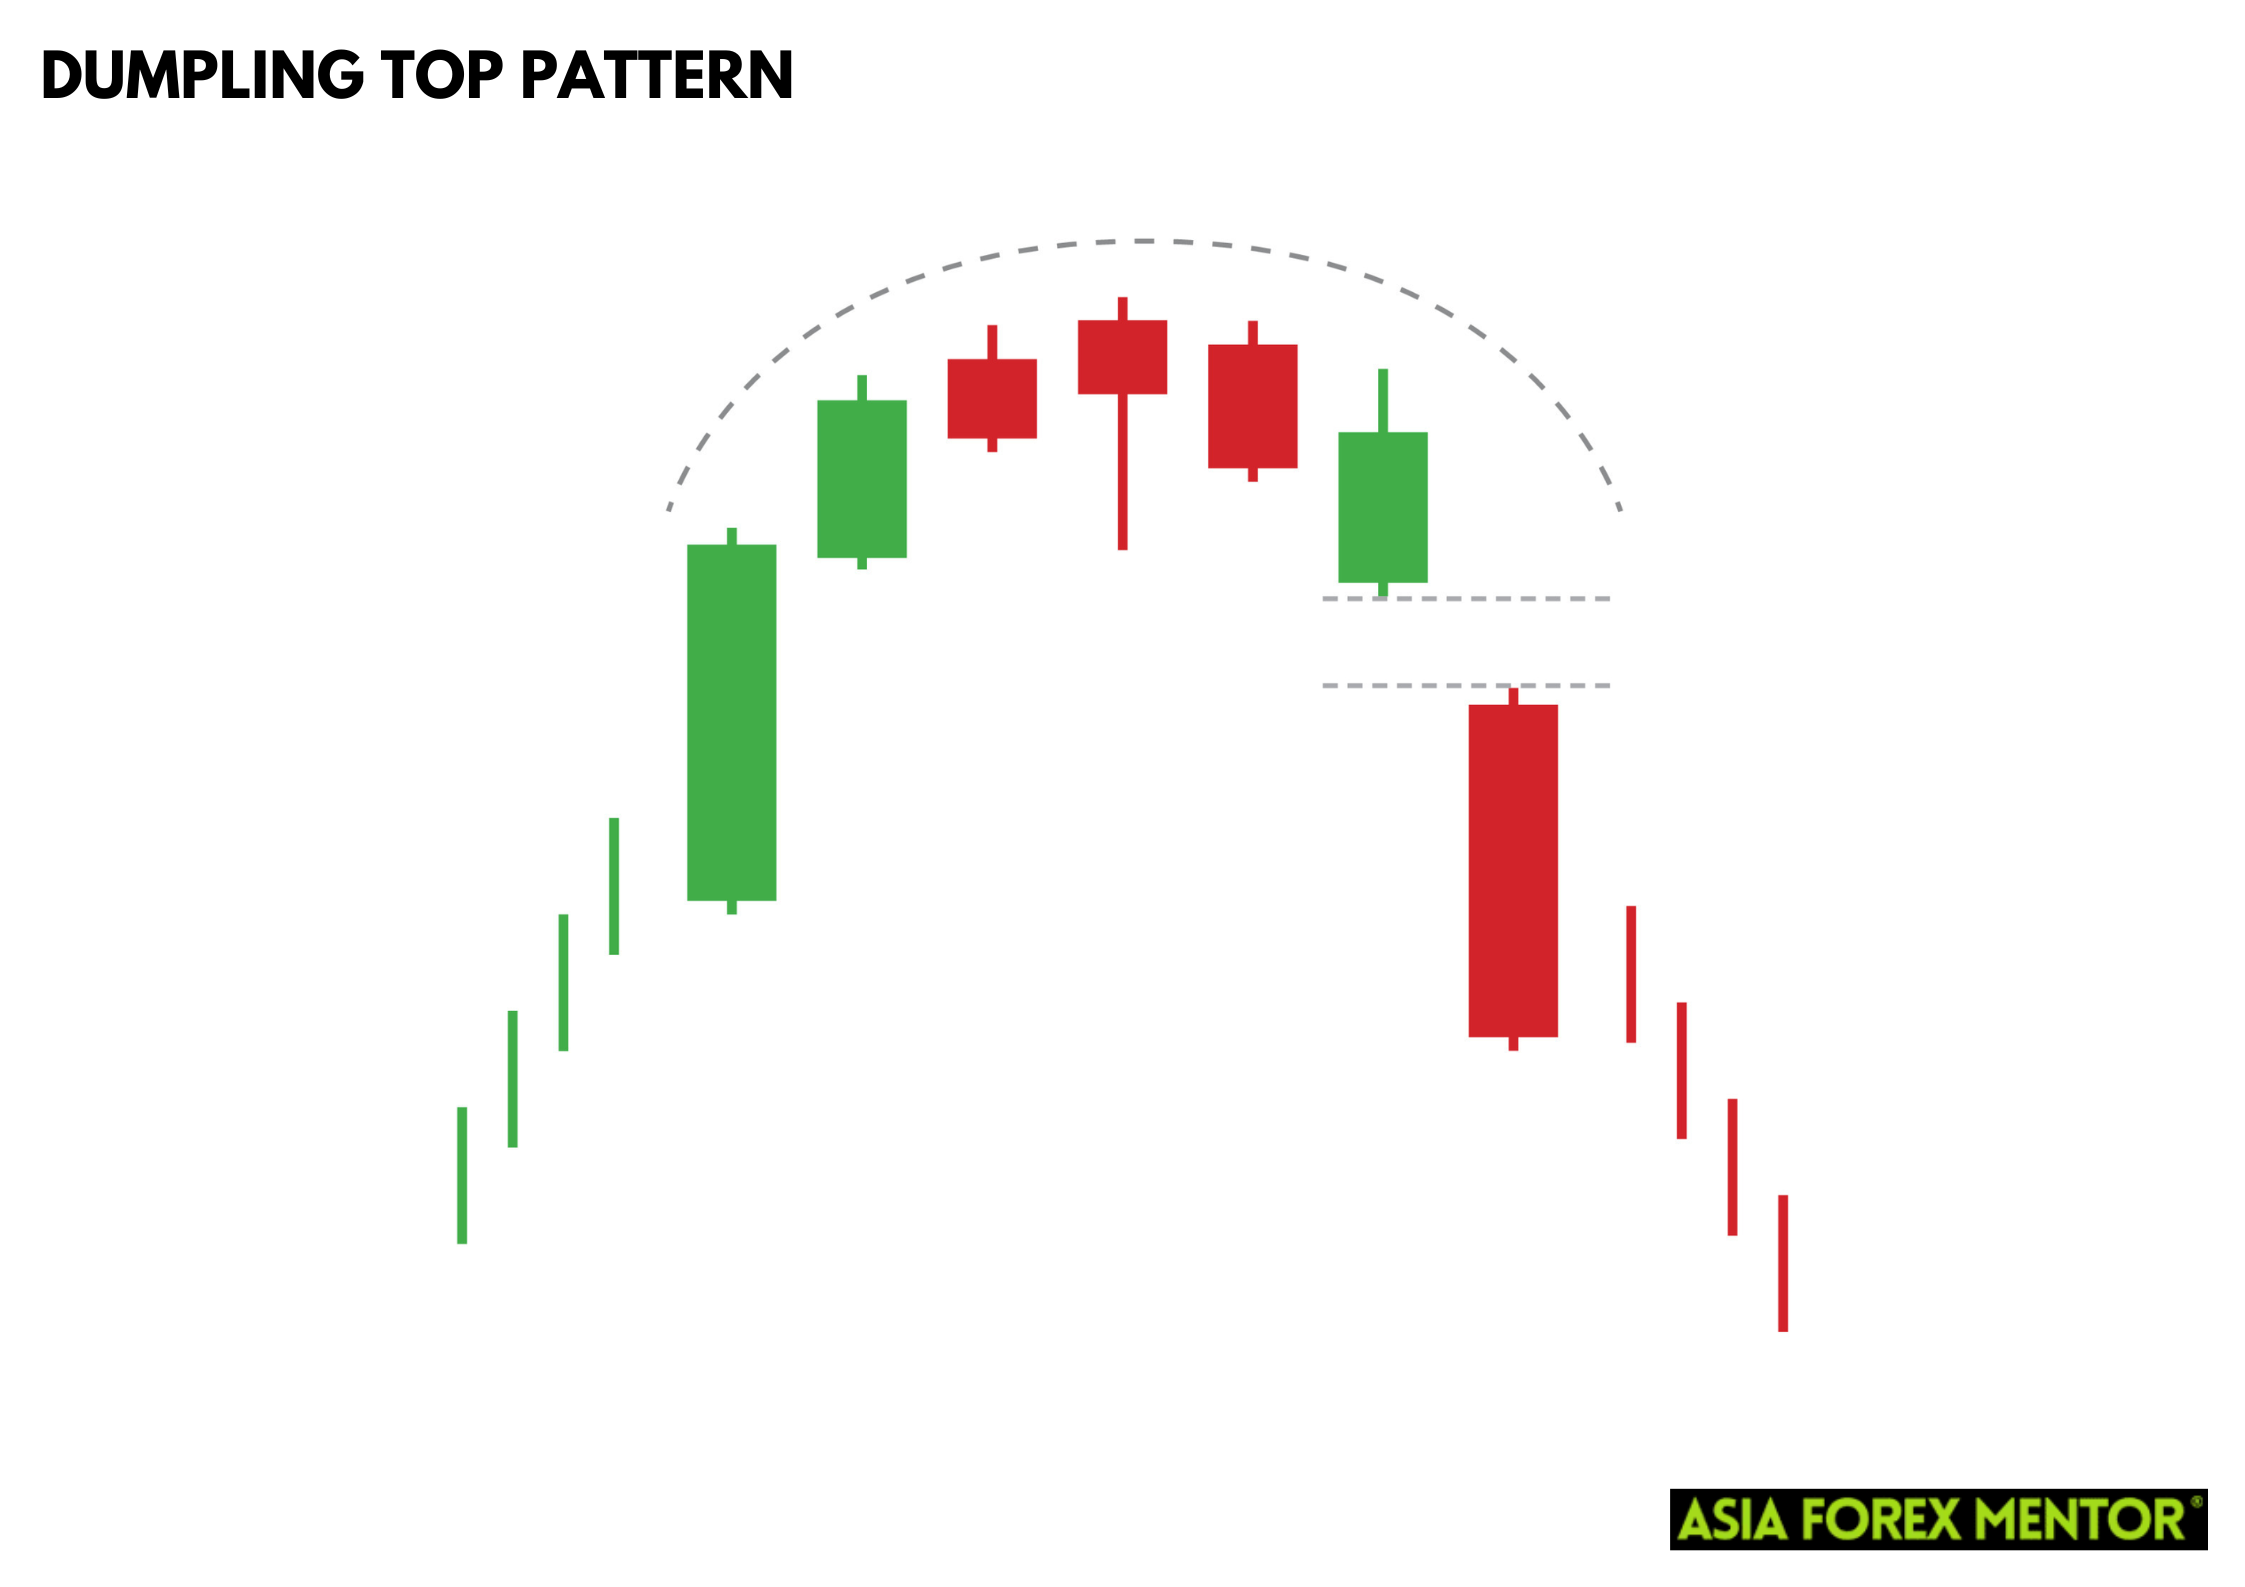
The dumpling top pattern occurs when the price action forms a rounded top, indicating a gradual transition from a bullish to a bearish market sentiment. This pattern starts with a series of small-bodied candlesticks that signify indecision in the market, followed by a bearish gap opening that confirms the reversal. The dumpling top structure is akin to a frying pan, where the first candlesticks create a smooth, rounded top, leading to a downward price action. This pattern suggests that the bullish momentum is weakening, and a bearish trend is about to begin.

As the market forms the dumpling top, traders should watch for several Japanese candlesticks forming a rounded top over time, similar to the western rounded bottom but in reverse. The key signal of this reversal pattern is the bearish gap opening, which typically follows the rounded top formation, marking the shift from bullish to bearish sentiment. Recognizing the dumpling top helps traders anticipate the onset of a bearish trend and take advantage of the impending price action. This pattern provides further confirmation of a weakening bullish trend, allowing traders to make more informed decisions and align their strategies with the current market conditions.

How to Spot the Dumpling Top Pattern
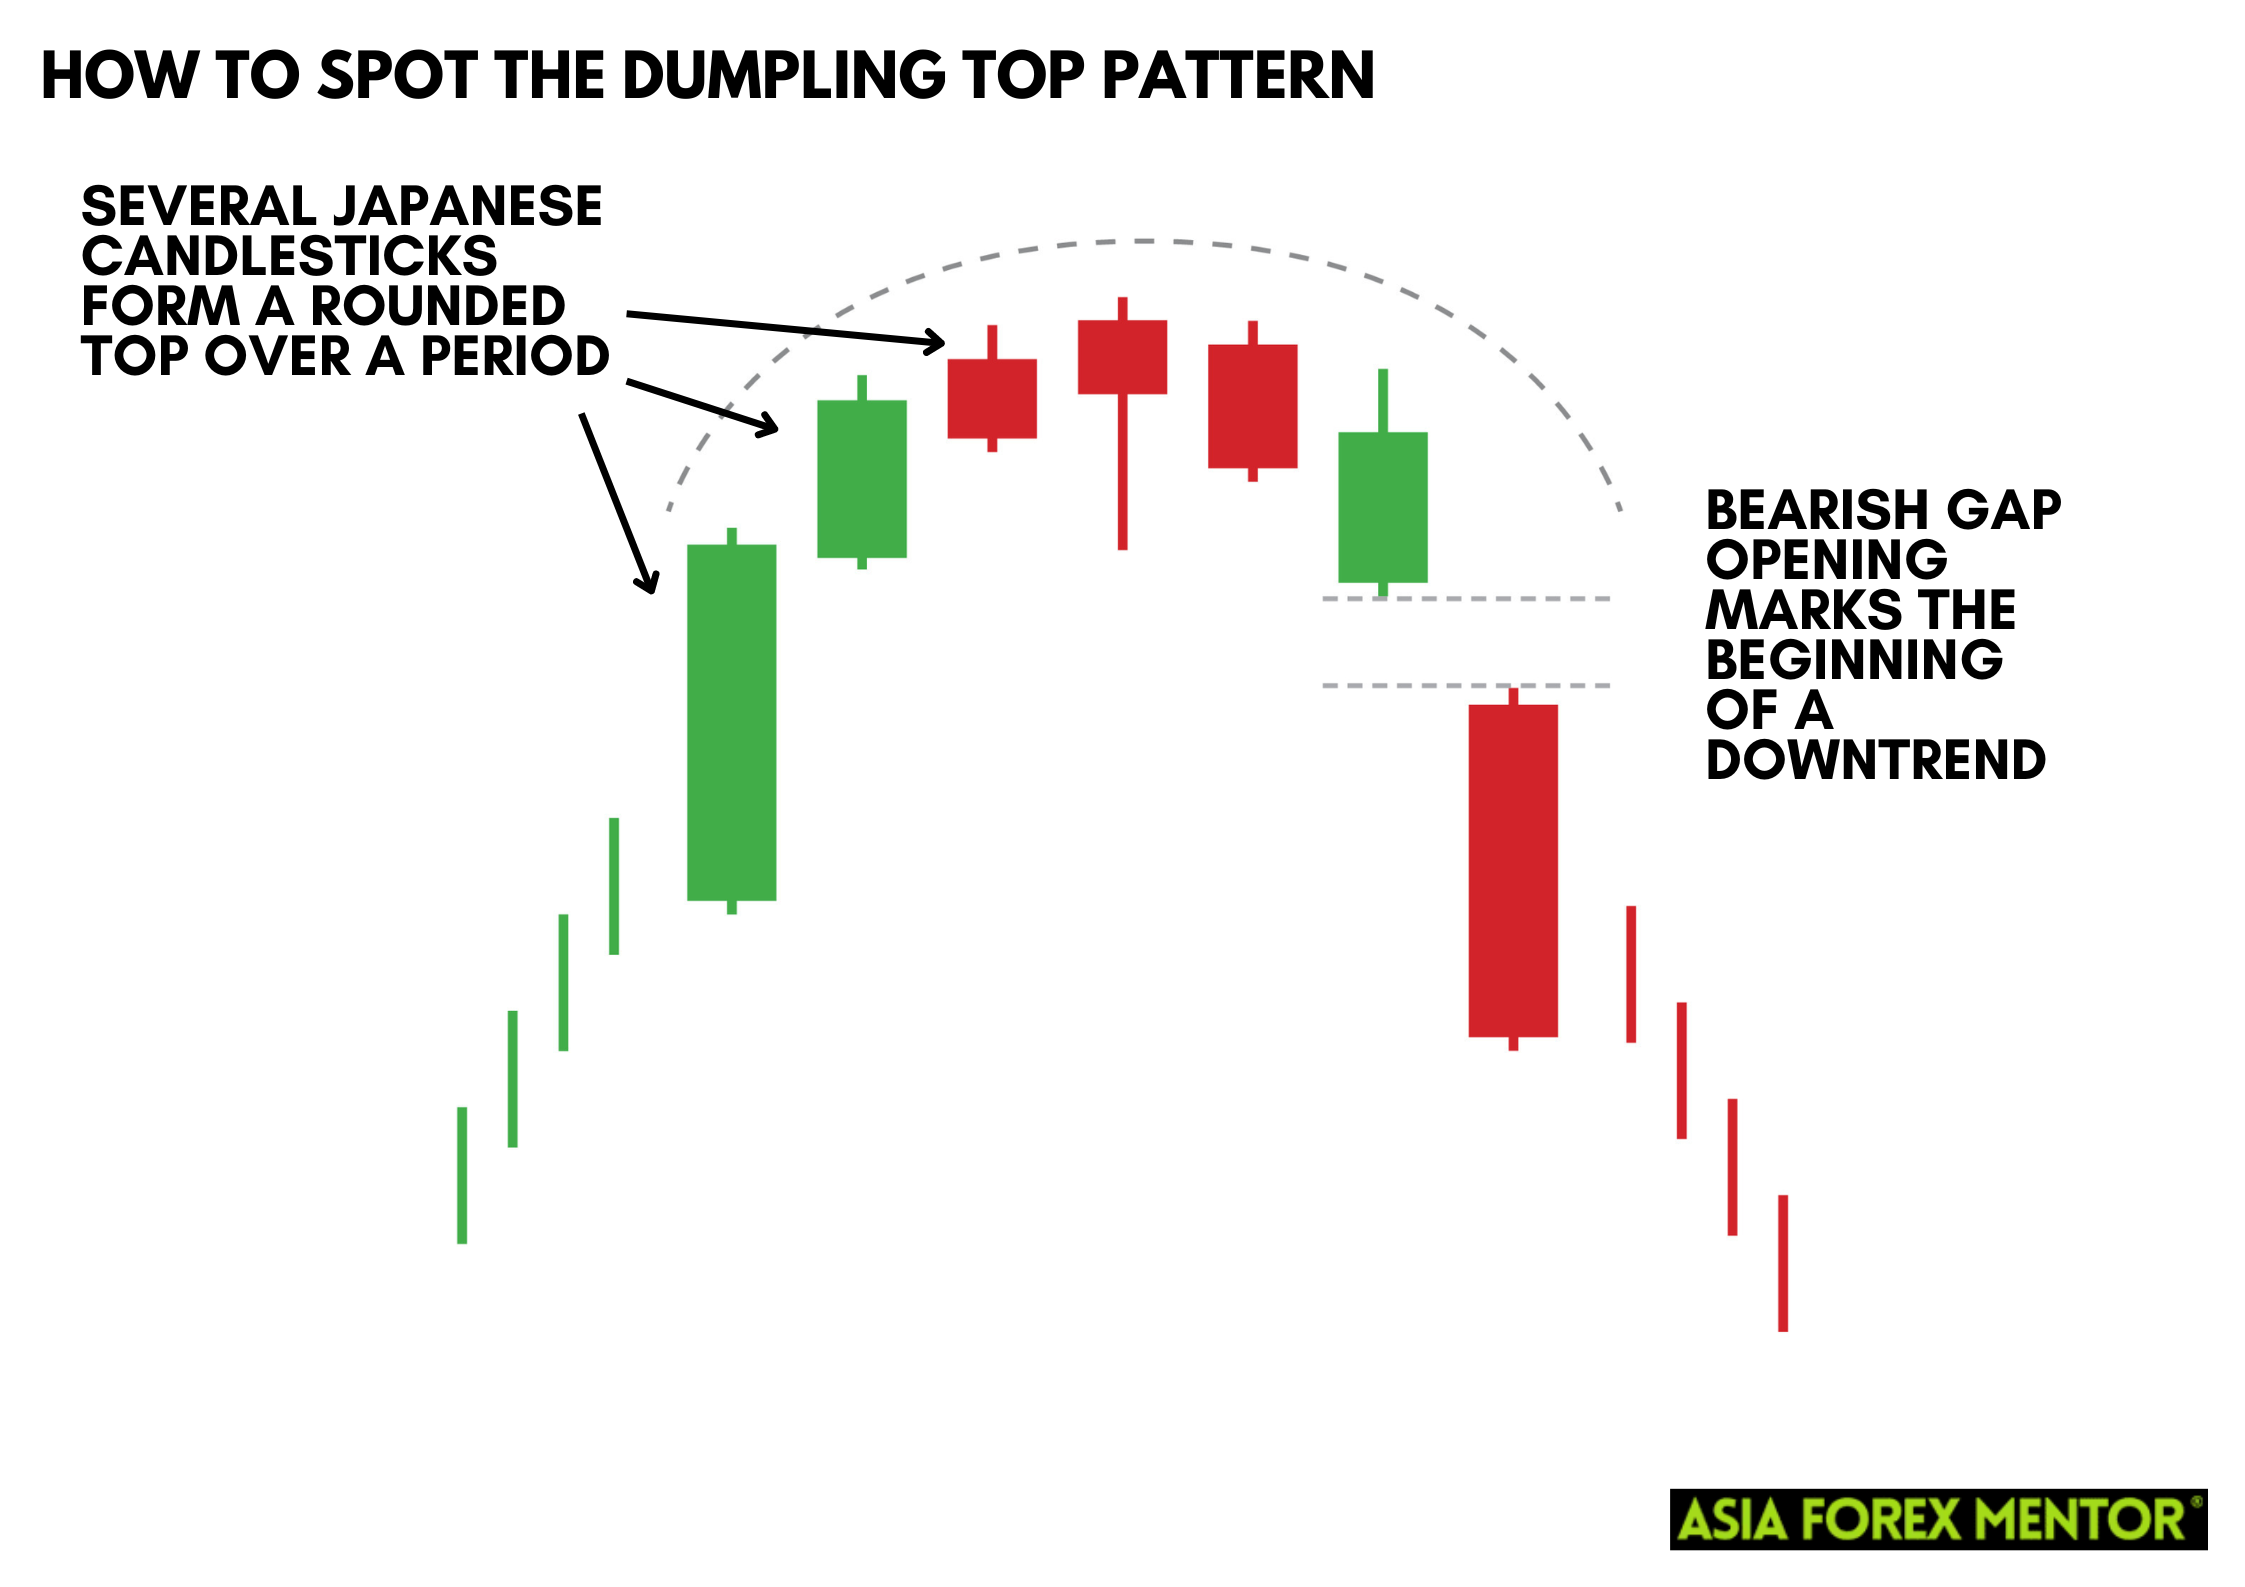
To identify the dumpling top pattern, traders should look for several japanese candlesticks forming a rounded top over a period. This formation is similar to a western rounded bottom, but in reverse. The pattern starts with small bodies indicating a lack of direction, and as the market forms this rounded shape, a sudden drop or a bearish gap opening marks the beginning of a downtrend. It’s crucial to differentiate this from the fry pan bottom, which signals a bullish reversal.

How to Trade the Dumpling Top Pattern

Entry Point
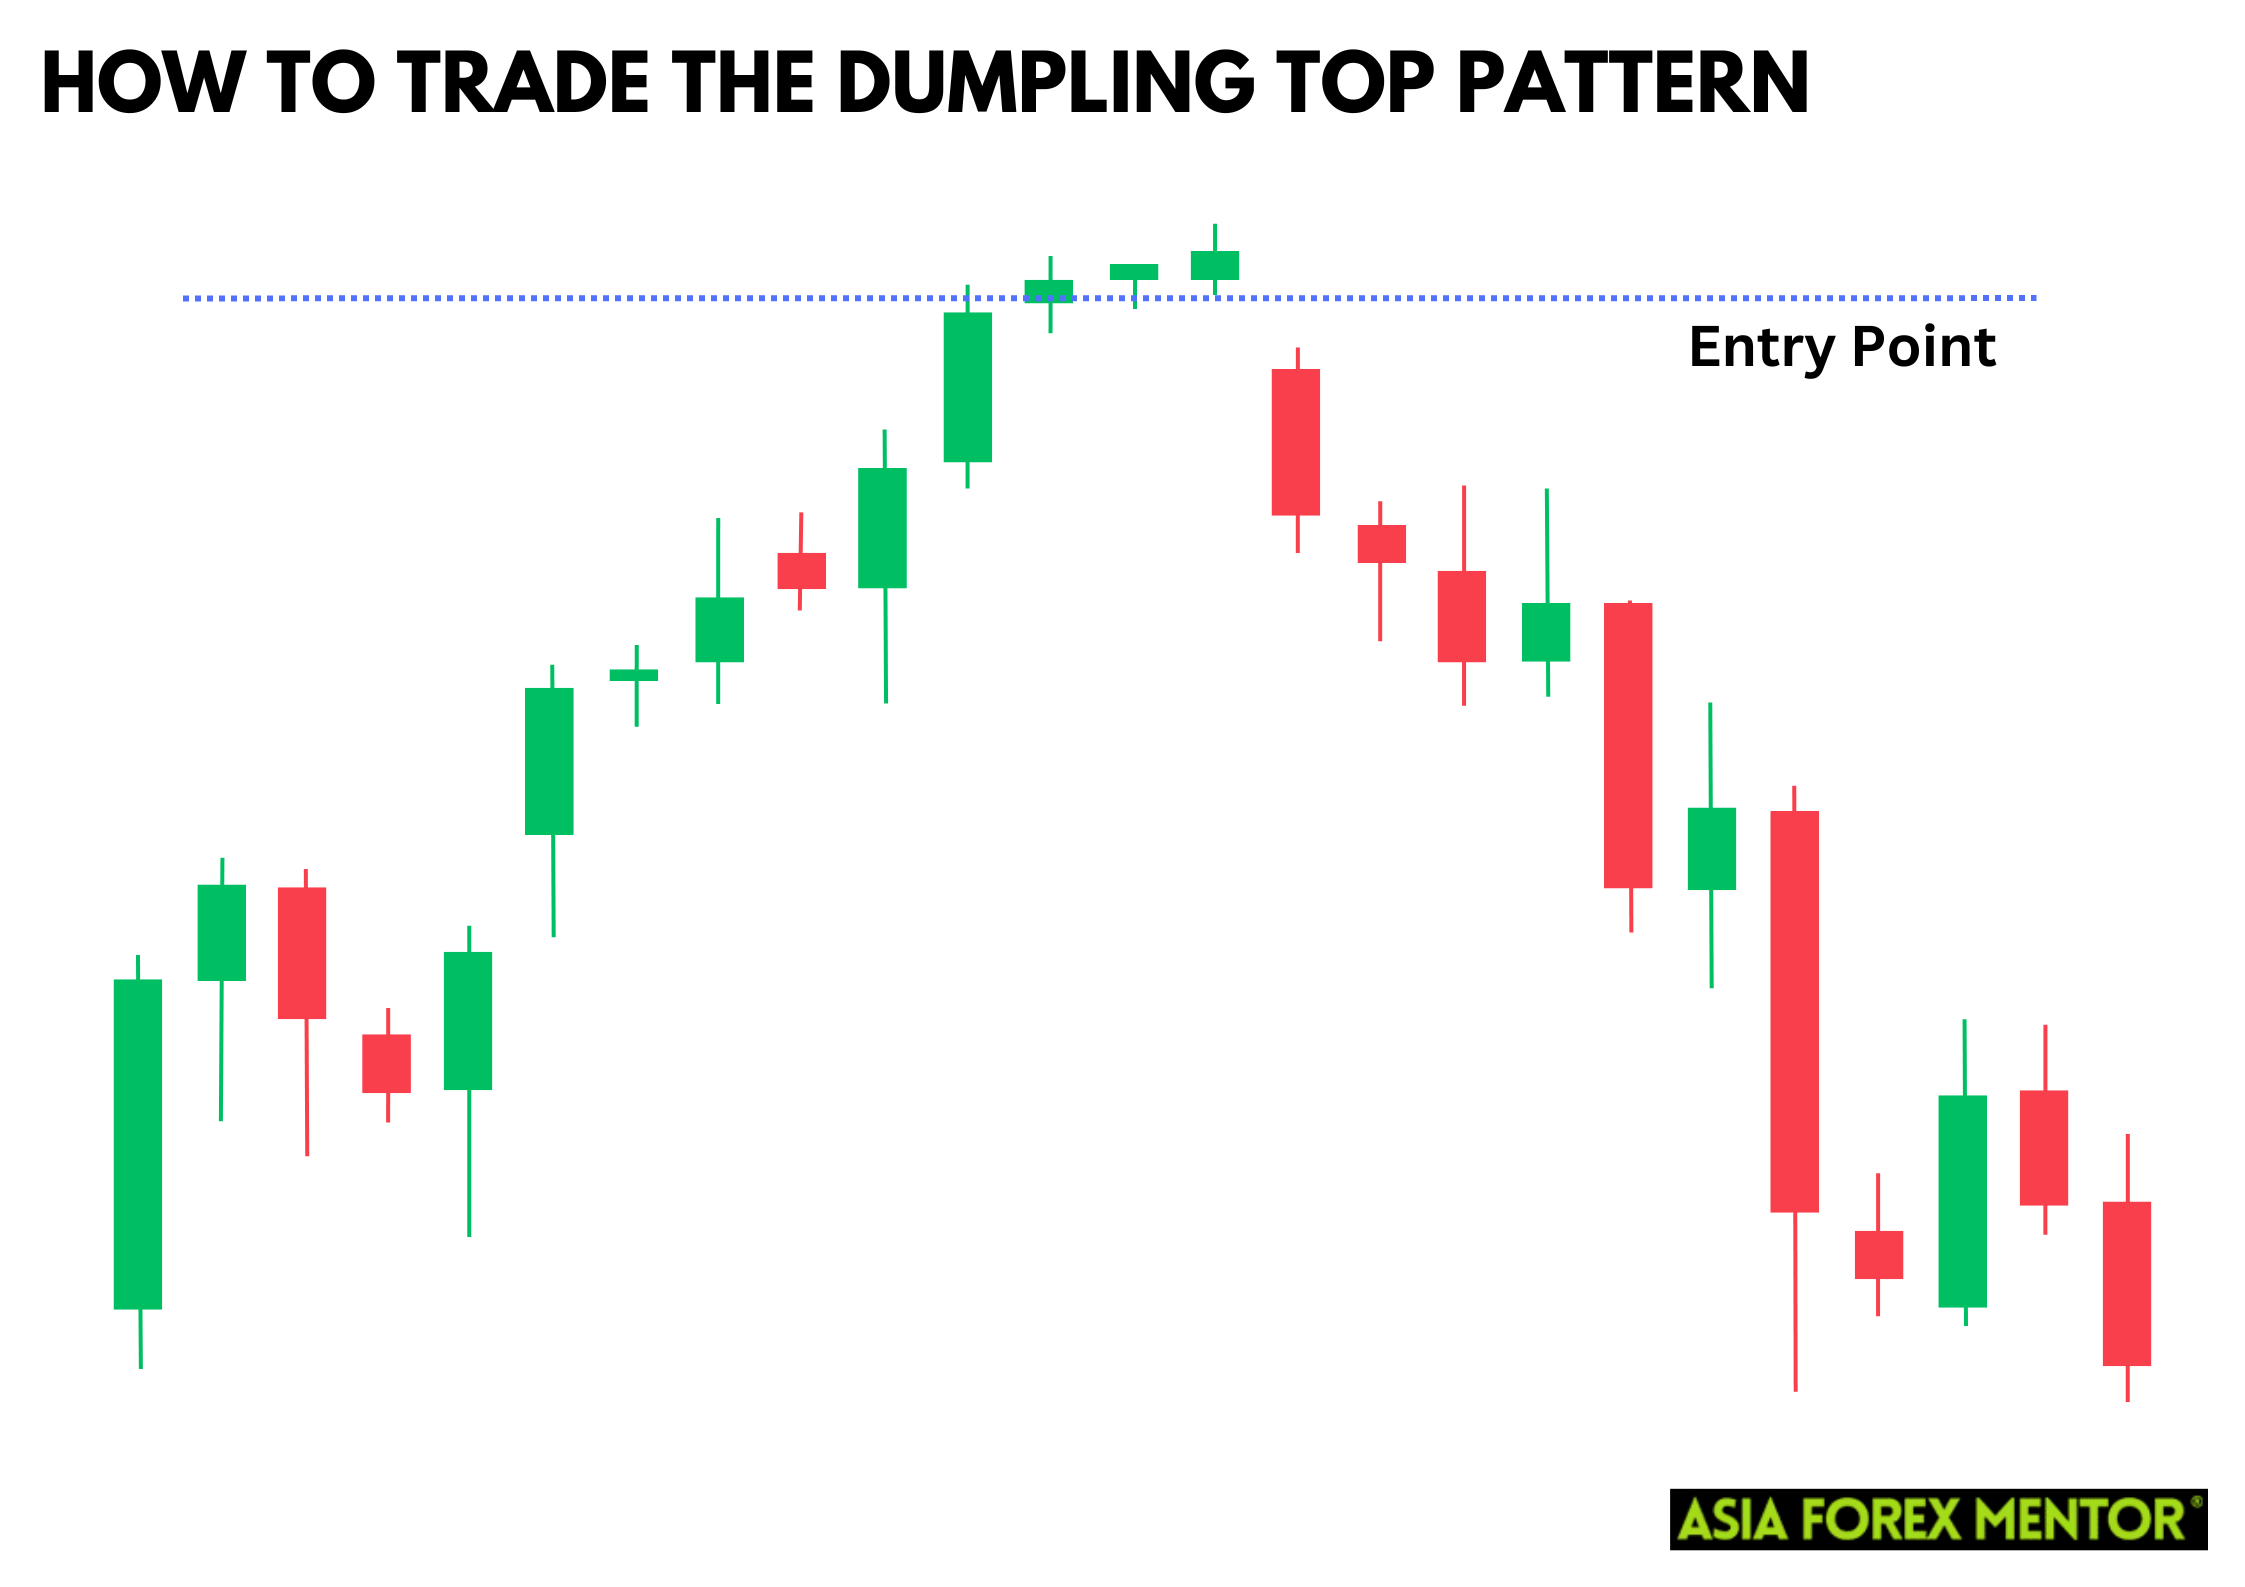
The entry point for trading the dumpling top pattern is typically right after the last candlestick closes and the bearish gap opening appears. This price action confirms the reversal pattern, allowing traders to enter a short position. Recognizing this critical moment helps traders capitalize on the dumpling top‘s indication of a market shift, enhancing their ability to profit from the ensuing bearish trend.

Stop Loss
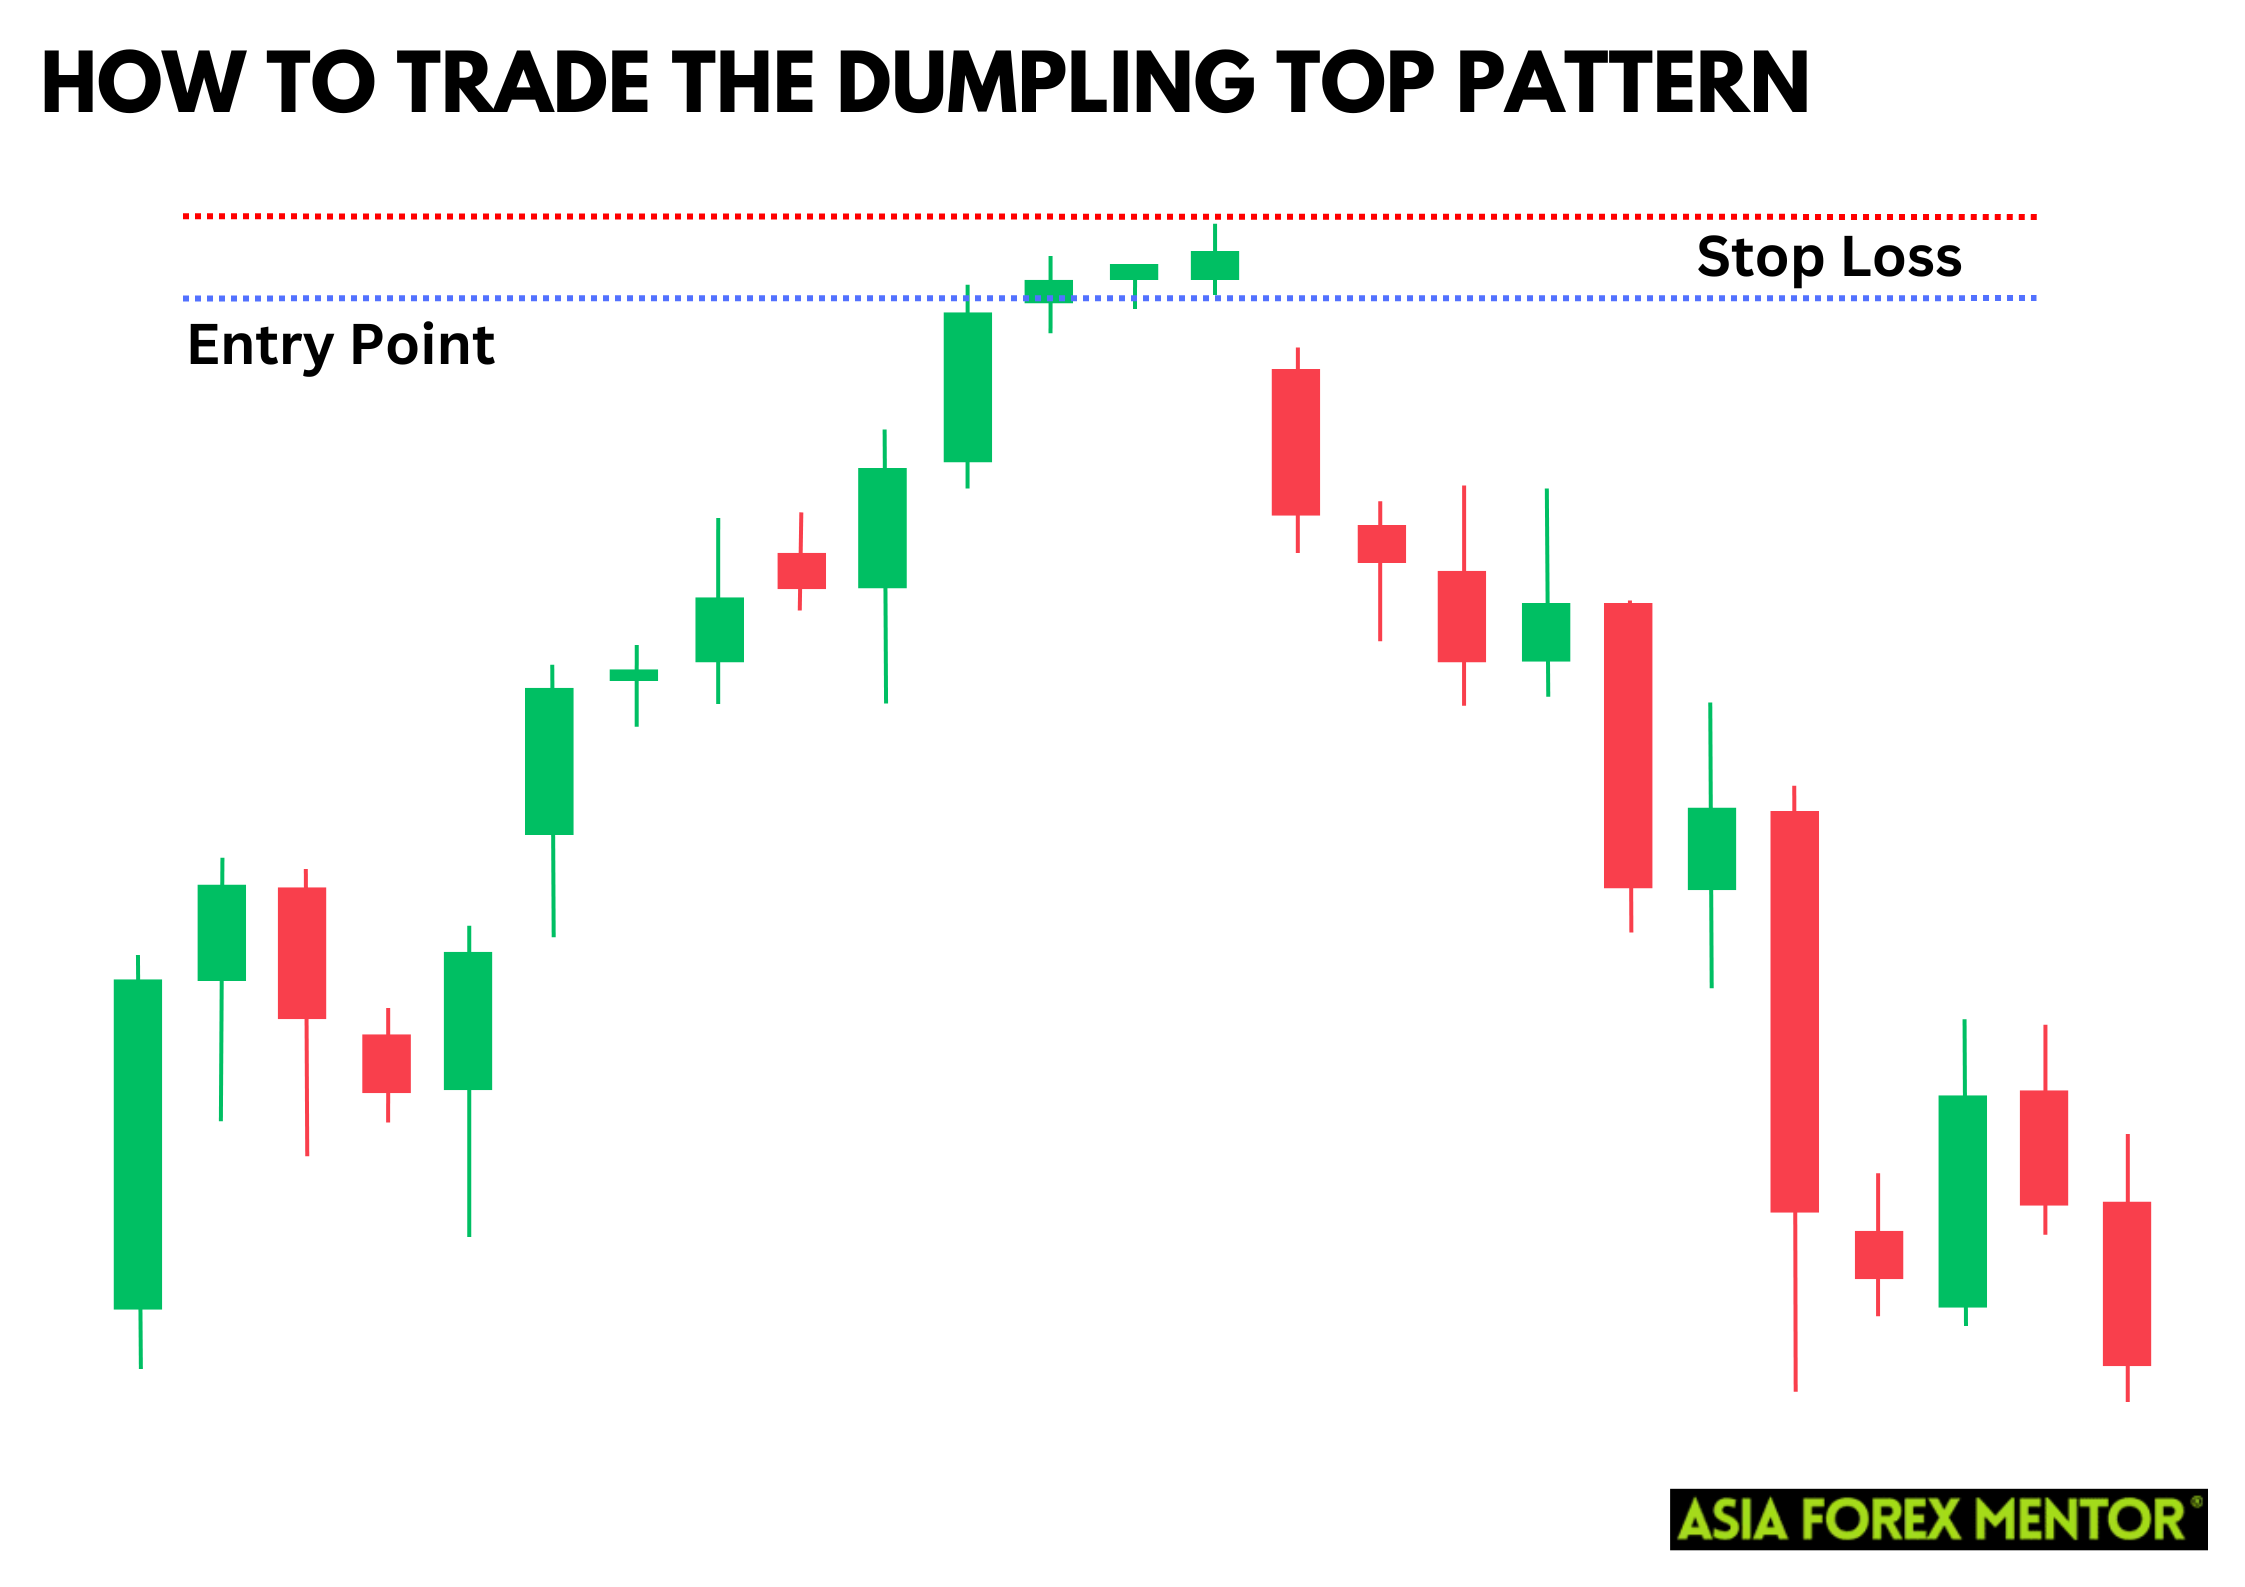
Setting a stop loss above the highest point of the dumpling top ensures protection against false signals. This stop loss level helps manage risk if the pattern suggests a temporary pullback rather than a sustained downtrend.

Profit Target
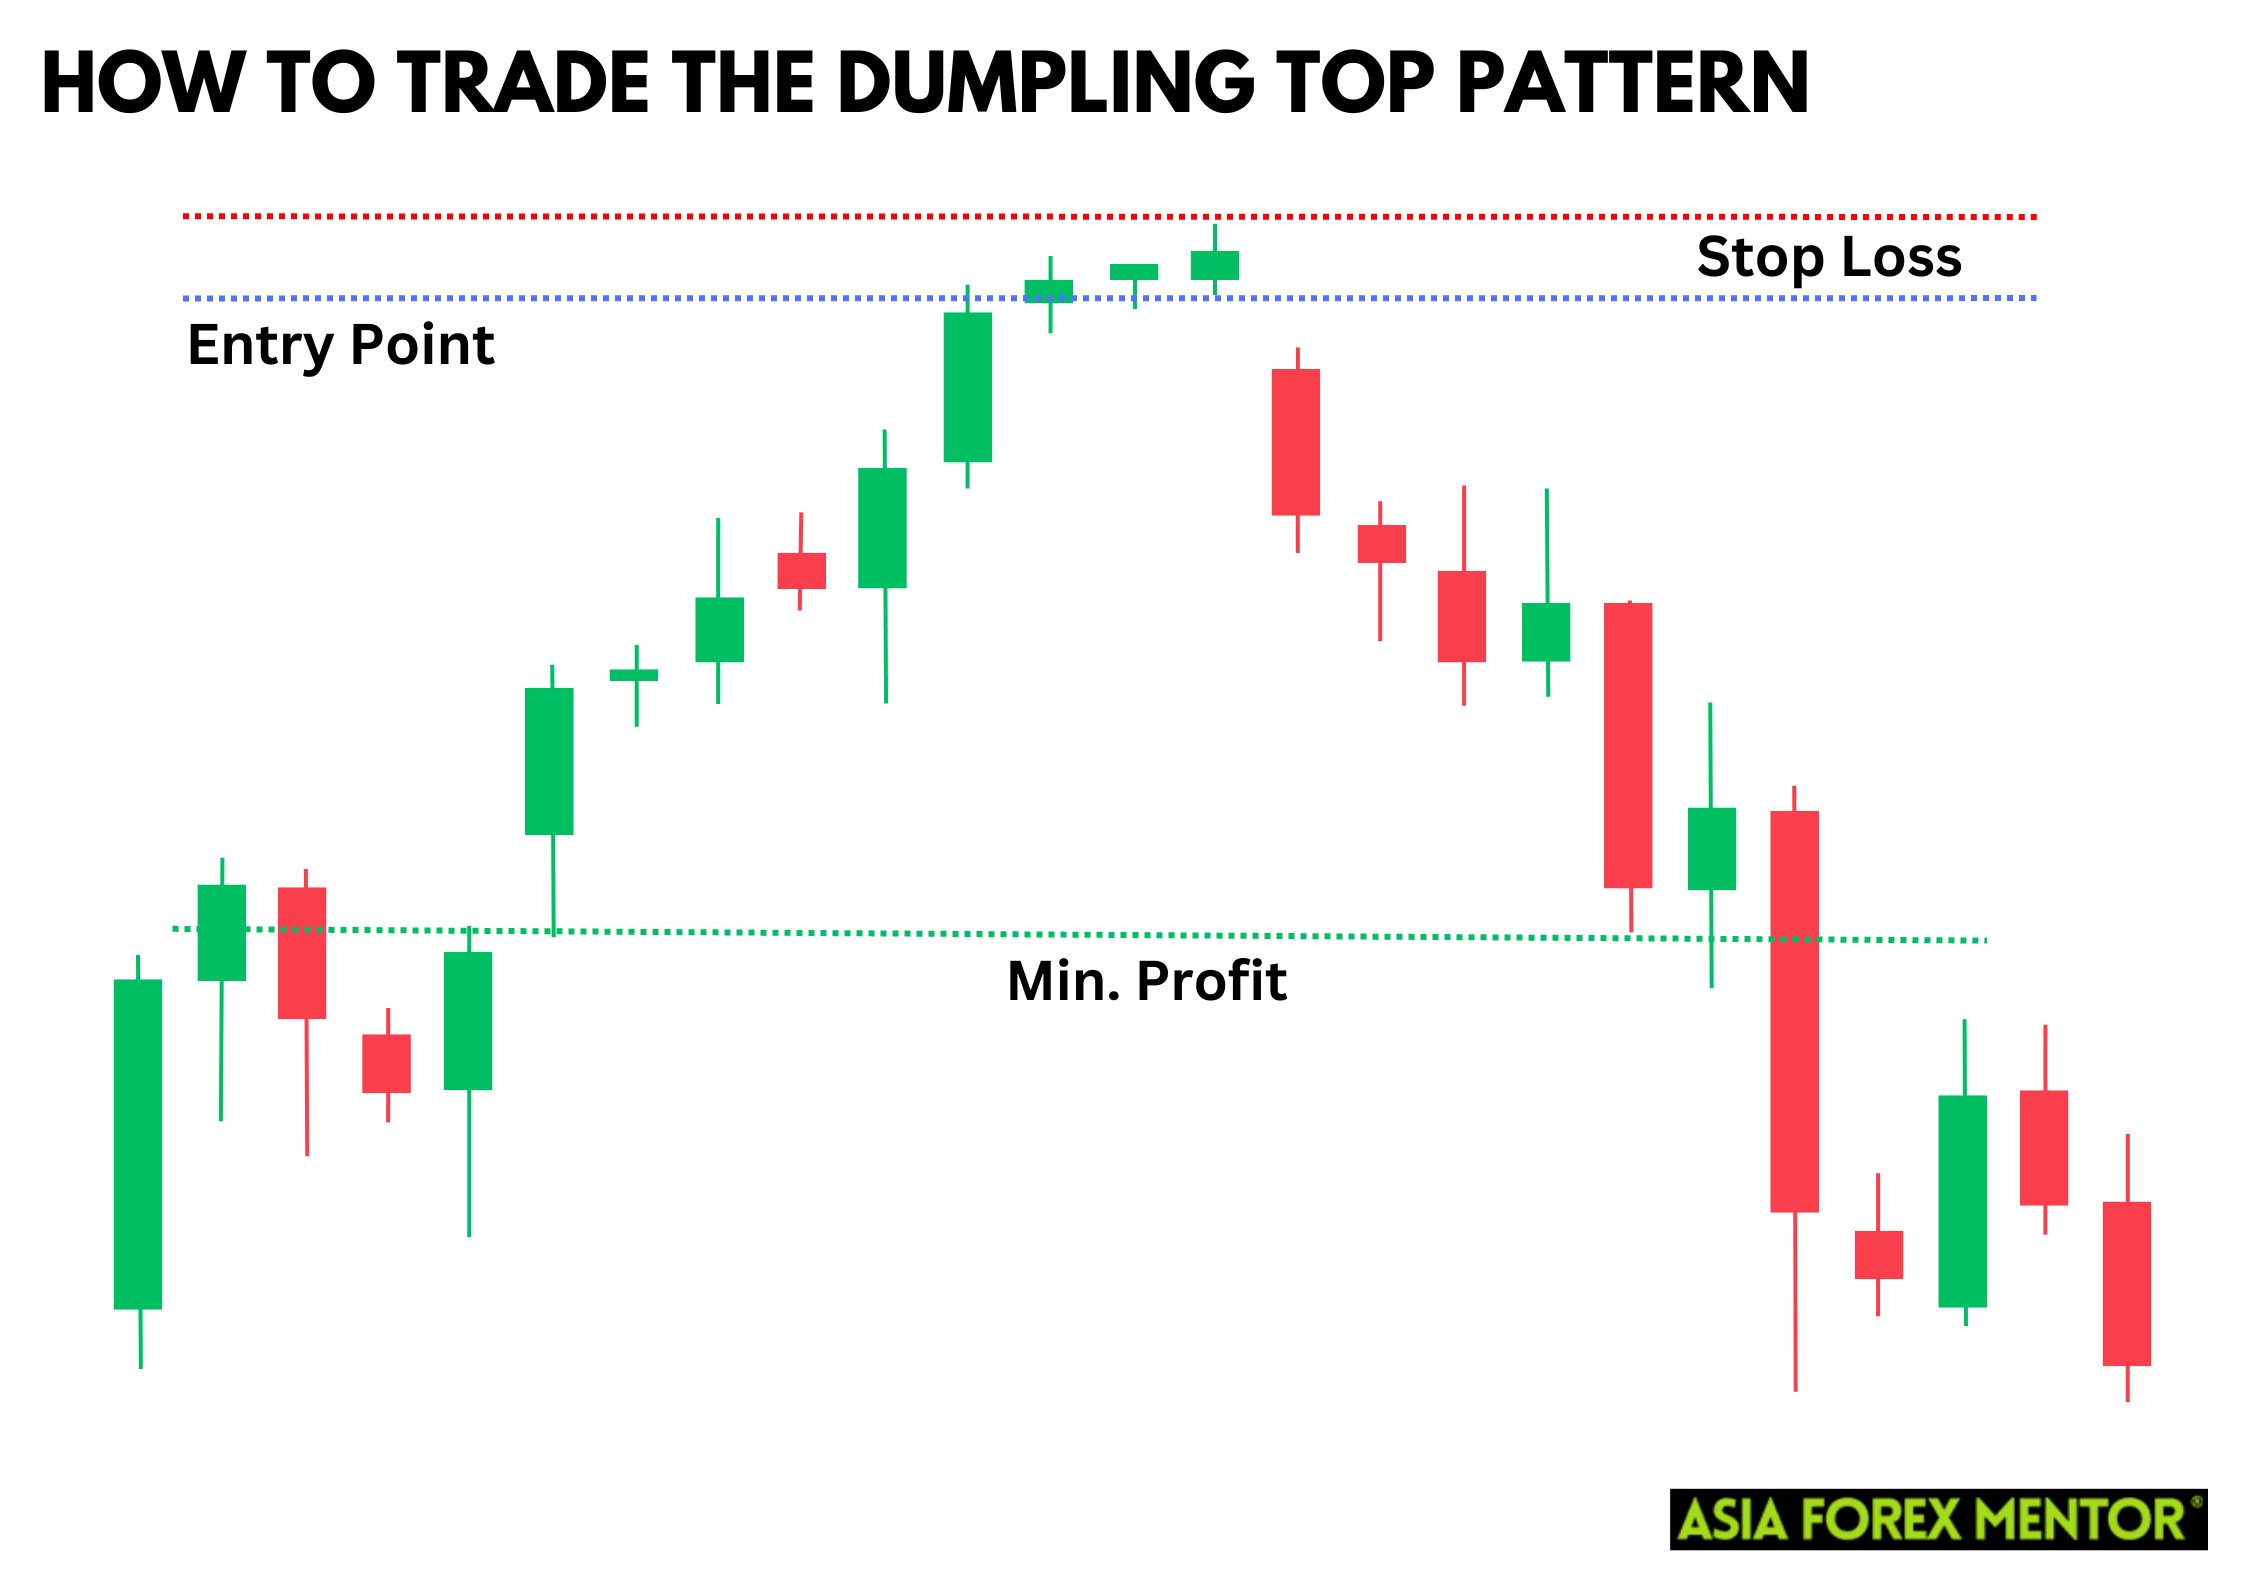
The profit target can be set by measuring the height of the dumpling top structure and projecting it downwards from the entry point. This method provides a balanced approach to capturing potential gains while considering the current trend.

Pros and Cons of the Dumpling Top Pattern

Pros

  • Clear bearish reversal signals.
  • Easy to recognize rounded top.
  • Predicts market sentiment shift early.
  • Precise entry and stop-loss points.
  • Versatile in various trading markets.

Cons

  • Potential for misleading signals.
  • Infrequent trading opportunities.
  • Challenging for novice traders.

Indicators to Use to Confirm the Pattern

To enhance the reliability of the dumpling top pattern, traders can use indicators like the Relative Strength Index (RSI) and Moving Averages. The RSI is particularly useful as it helps identify overbought conditions, signaling that the market may be due for a reversal. When the RSI reaches high levels, it indicates that the bullish momentum is waning, supporting the potential formation of a dumpling top. This further confirmation of market sentiment can make traders more confident in predicting a bearish reversal.

Moving Averages, on the other hand, provide insights into changes in the current trend. By tracking the average price over a specific period, Moving Averages can show the gradual shift in market momentum that often accompanies the formation of a dumpling top. When the shorter-term Moving Average crosses below the longer-term Moving Average, it suggests a bearish trend is starting. Using these indicators in conjunction with the dumpling top pattern helps traders identify more reliable entry and exit points, thereby improving their trading strategies.

Conclusion

The dumpling top pattern is a valuable tool in a trader's arsenal, signaling potential bearish reversals with visual clarity. Recognizing this candlestick pattern and understanding its implications can lead to more informed trading decisions. By identifying the rounded top formation and the subsequent bearish gap opening, traders can anticipate shifts in market sentiment. Utilizing this pattern alongside indicators like the Relative Strength Index (RSI) and Moving Averages provides further confirmation and enhances the accuracy of predicting a bearish reversal, ultimately leading to better strategic trades.

Also Read: How to Trade the Bullish Stalled Candlestick Pattern

FAQs

What is the difference between a dumpling top and a fry pan bottom?

A dumpling top indicates a bearish reversal, while a fry pan bottom signals a bullish reversal.

Can the dumpling top pattern appear in any market?

Yes, this pattern can form in various markets, including stocks, forex, and commodities.

What is the key signal for entering a trade using the dumpling top pattern?

The key signal is the bearish gap opening after the rounded top formation, indicating a shift from bullish to bearish sentiment.



Top 5 Forex Brokers Ranked by Traders in 2025

About Ezekiel Chew​

Ezekiel Chew, founder and head of training at Asia Forex Mentor, is a renowned forex expert, frequently invited to speak at major industry events. Known for his deep market insights, Ezekiel is one of the top traders committed to supporting the trading community. Making six figures per trade, he also trains traders working in banks, fund management, and prop trading firms.

10 Trading Discipline Every Forex Trader Needs

ABOUT THIS GUIDE Written by Ezekiel Chew, founder of Asia Forex Mentor and a former bank trader with over 20 years of experience. He has coached more than 100,000 students across 50+ countries through the AFM One Core Program. Trading discipline is the one trait he sees in every profitable

Read More

Leverage in Forex and Why Most Traders Abuse It

Leverage in forex is the most powerful tool available to retail traders, and the most dangerous one when used without understanding what it actually does. It allows traders to control positions far larger than their initial deposit. A $1,000 account with 100:1 leverage controls a $100,000 position. That amplifies every

Read More

Is Forex Trading Profitable for Most Traders

Is forex trading profitable? The honest answer is yes, but not in the way most people entering the market expect it to be. Forex trading is profitable for a minority of traders. Most retail traders lose money. That is not a secret. Brokers in the European Union must disclose the

Read More

Understanding What Is Price Action Trading in 2026

What is price action trading and why do institutional traders rely on it while most retail traders still lose money with indicators? Price action trading is the method of making trading decisions based entirely on the market’s price chart. No lagging indicators, moving averages. No RSI or MACD cluttering the

Read More

AFM Trading Summit Live

Date: Coming Soon

Join us at the AFM Trading Summit Live and learn from top industry experts through live trading sessions, market insights, and actionable strategies.

How to Trade the Dumpling Top Pattern

4.0
Overall Trust Index

Written by:

Updated:

January 21, 2025
The dumpling top pattern is a unique candlestick pattern that traders use to predict potential bearish reversals in the market. Originating from Japanese candlesticks analysis, this pattern is visually reminiscent of a rounded top, similar to the western rounded bottom top. Often compared to the japanese fry pan bottom, the dumpling top signals the opposite market direction. Understanding and utilizing the dumpling top can help traders anticipate market shifts, providing opportunities to profit from bearish reversal trends. To effectively trade the dumpling top pattern, traders need to recognize its formation and understand its implications. The pattern suggests a gradual shift from bullish to bearish sentiment, often marked by a bearish gap opening following the rounded top. This structure, akin to a frying pan, indicates weakening bullish momentum and the start of a bearish trend. By spotting these cues, traders can strategically position themselves to benefit from the resulting price action. Market gaps and several Japanese candlesticks forming a smooth, rounded top provide further confirmation for this reversal pattern. Also Read: Mastering Japanese Candlestick Patterns

What is the Dumpling Top Pattern?

The dumpling top pattern occurs when the price action forms a rounded top, indicating a gradual transition from a bullish to a bearish market sentiment. This pattern starts with a series of small-bodied candlesticks that signify indecision in the market, followed by a bearish gap opening that confirms the reversal. The dumpling top structure is akin to a frying pan, where the first candlesticks create a smooth, rounded top, leading to a downward price action. This pattern suggests that the bullish momentum is weakening, and a bearish trend is about to begin. As the market forms the dumpling top, traders should watch for several Japanese candlesticks forming a rounded top over time, similar to the western rounded bottom but in reverse. The key signal of this reversal pattern is the bearish gap opening, which typically follows the rounded top formation, marking the shift from bullish to bearish sentiment. Recognizing the dumpling top helps traders anticipate the onset of a bearish trend and take advantage of the impending price action. This pattern provides further confirmation of a weakening bullish trend, allowing traders to make more informed decisions and align their strategies with the current market conditions.

How to Spot the Dumpling Top Pattern

To identify the dumpling top pattern, traders should look for several japanese candlesticks forming a rounded top over a period. This formation is similar to a western rounded bottom, but in reverse. The pattern starts with small bodies indicating a lack of direction, and as the market forms this rounded shape, a sudden drop or a bearish gap opening marks the beginning of a downtrend. It’s crucial to differentiate this from the fry pan bottom, which signals a bullish reversal.

How to Trade the Dumpling Top Pattern

Entry Point

The entry point for trading the dumpling top pattern is typically right after the last candlestick closes and the bearish gap opening appears. This price action confirms the reversal pattern, allowing traders to enter a short position. Recognizing this critical moment helps traders capitalize on the dumpling top's indication of a market shift, enhancing their ability to profit from the ensuing bearish trend.

Stop Loss

Setting a stop loss above the highest point of the dumpling top ensures protection against false signals. This stop loss level helps manage risk if the pattern suggests a temporary pullback rather than a sustained downtrend.

Profit Target

The profit target can be set by measuring the height of the dumpling top structure and projecting it downwards from the entry point. This method provides a balanced approach to capturing potential gains while considering the current trend.

Pros and Cons of the Dumpling Top Pattern

Pros

  • Clear bearish reversal signals.
  • Easy to recognize rounded top.
  • Predicts market sentiment shift early.
  • Precise entry and stop-loss points.
  • Versatile in various trading markets.

Cons

  • Potential for misleading signals.
  • Infrequent trading opportunities.
  • Challenging for novice traders.

Indicators to Use to Confirm the Pattern

To enhance the reliability of the dumpling top pattern, traders can use indicators like the Relative Strength Index (RSI) and Moving Averages. The RSI is particularly useful as it helps identify overbought conditions, signaling that the market may be due for a reversal. When the RSI reaches high levels, it indicates that the bullish momentum is waning, supporting the potential formation of a dumpling top. This further confirmation of market sentiment can make traders more confident in predicting a bearish reversal. Moving Averages, on the other hand, provide insights into changes in the current trend. By tracking the average price over a specific period, Moving Averages can show the gradual shift in market momentum that often accompanies the formation of a dumpling top. When the shorter-term Moving Average crosses below the longer-term Moving Average, it suggests a bearish trend is starting. Using these indicators in conjunction with the dumpling top pattern helps traders identify more reliable entry and exit points, thereby improving their trading strategies.

Conclusion

The dumpling top pattern is a valuable tool in a trader's arsenal, signaling potential bearish reversals with visual clarity. Recognizing this candlestick pattern and understanding its implications can lead to more informed trading decisions. By identifying the rounded top formation and the subsequent bearish gap opening, traders can anticipate shifts in market sentiment. Utilizing this pattern alongside indicators like the Relative Strength Index (RSI) and Moving Averages provides further confirmation and enhances the accuracy of predicting a bearish reversal, ultimately leading to better strategic trades. Also Read: How to Trade the Bullish Stalled Candlestick Pattern

FAQs

What is the difference between a dumpling top and a fry pan bottom?

A dumpling top indicates a bearish reversal, while a fry pan bottom signals a bullish reversal.

Can the dumpling top pattern appear in any market?

Yes, this pattern can form in various markets, including stocks, forex, and commodities.

What is the key signal for entering a trade using the dumpling top pattern?

The key signal is the bearish gap opening after the rounded top formation, indicating a shift from bullish to bearish sentiment.


Top 5 Forex Brokers Ranked by Traders in 2025

ezekiel chew asiaforexmentor

About Ezekiel Chew

Ezekiel Chew, founder and head of training at Asia Forex Mentor, is a renowned forex expert, frequently invited to speak at major industry events. Known for his deep market insights, Ezekiel is one of the top traders committed to supporting the trading community. Making six figures per trade, he also trains traders working in banks, fund management, and prop trading firms.

RELATED ARTICLES

How to Trade the Dumpling Top Pattern

4.0
Overall Trust Index

Written by:

Updated:

January 21, 2025
The dumpling top pattern is a unique candlestick pattern that traders use to predict potential bearish reversals in the market. Originating from Japanese candlesticks analysis, this pattern is visually reminiscent of a rounded top, similar to the western rounded bottom top. Often compared to the japanese fry pan bottom, the dumpling top signals the opposite market direction. Understanding and utilizing the dumpling top can help traders anticipate market shifts, providing opportunities to profit from bearish reversal trends. To effectively trade the dumpling top pattern, traders need to recognize its formation and understand its implications. The pattern suggests a gradual shift from bullish to bearish sentiment, often marked by a bearish gap opening following the rounded top. This structure, akin to a frying pan, indicates weakening bullish momentum and the start of a bearish trend. By spotting these cues, traders can strategically position themselves to benefit from the resulting price action. Market gaps and several Japanese candlesticks forming a smooth, rounded top provide further confirmation for this reversal pattern. Also Read: Mastering Japanese Candlestick Patterns

What is the Dumpling Top Pattern?

The dumpling top pattern occurs when the price action forms a rounded top, indicating a gradual transition from a bullish to a bearish market sentiment. This pattern starts with a series of small-bodied candlesticks that signify indecision in the market, followed by a bearish gap opening that confirms the reversal. The dumpling top structure is akin to a frying pan, where the first candlesticks create a smooth, rounded top, leading to a downward price action. This pattern suggests that the bullish momentum is weakening, and a bearish trend is about to begin. As the market forms the dumpling top, traders should watch for several Japanese candlesticks forming a rounded top over time, similar to the western rounded bottom but in reverse. The key signal of this reversal pattern is the bearish gap opening, which typically follows the rounded top formation, marking the shift from bullish to bearish sentiment. Recognizing the dumpling top helps traders anticipate the onset of a bearish trend and take advantage of the impending price action. This pattern provides further confirmation of a weakening bullish trend, allowing traders to make more informed decisions and align their strategies with the current market conditions.

How to Spot the Dumpling Top Pattern

To identify the dumpling top pattern, traders should look for several japanese candlesticks forming a rounded top over a period. This formation is similar to a western rounded bottom, but in reverse. The pattern starts with small bodies indicating a lack of direction, and as the market forms this rounded shape, a sudden drop or a bearish gap opening marks the beginning of a downtrend. It’s crucial to differentiate this from the fry pan bottom, which signals a bullish reversal.

How to Trade the Dumpling Top Pattern

Entry Point

The entry point for trading the dumpling top pattern is typically right after the last candlestick closes and the bearish gap opening appears. This price action confirms the reversal pattern, allowing traders to enter a short position. Recognizing this critical moment helps traders capitalize on the dumpling top's indication of a market shift, enhancing their ability to profit from the ensuing bearish trend.

Stop Loss

Setting a stop loss above the highest point of the dumpling top ensures protection against false signals. This stop loss level helps manage risk if the pattern suggests a temporary pullback rather than a sustained downtrend.

Profit Target

The profit target can be set by measuring the height of the dumpling top structure and projecting it downwards from the entry point. This method provides a balanced approach to capturing potential gains while considering the current trend.

Pros and Cons of the Dumpling Top Pattern

Pros

  • Clear bearish reversal signals.
  • Easy to recognize rounded top.
  • Predicts market sentiment shift early.
  • Precise entry and stop-loss points.
  • Versatile in various trading markets.

Cons

  • Potential for misleading signals.
  • Infrequent trading opportunities.
  • Challenging for novice traders.

Indicators to Use to Confirm the Pattern

To enhance the reliability of the dumpling top pattern, traders can use indicators like the Relative Strength Index (RSI) and Moving Averages. The RSI is particularly useful as it helps identify overbought conditions, signaling that the market may be due for a reversal. When the RSI reaches high levels, it indicates that the bullish momentum is waning, supporting the potential formation of a dumpling top. This further confirmation of market sentiment can make traders more confident in predicting a bearish reversal. Moving Averages, on the other hand, provide insights into changes in the current trend. By tracking the average price over a specific period, Moving Averages can show the gradual shift in market momentum that often accompanies the formation of a dumpling top. When the shorter-term Moving Average crosses below the longer-term Moving Average, it suggests a bearish trend is starting. Using these indicators in conjunction with the dumpling top pattern helps traders identify more reliable entry and exit points, thereby improving their trading strategies.

Conclusion

The dumpling top pattern is a valuable tool in a trader's arsenal, signaling potential bearish reversals with visual clarity. Recognizing this candlestick pattern and understanding its implications can lead to more informed trading decisions. By identifying the rounded top formation and the subsequent bearish gap opening, traders can anticipate shifts in market sentiment. Utilizing this pattern alongside indicators like the Relative Strength Index (RSI) and Moving Averages provides further confirmation and enhances the accuracy of predicting a bearish reversal, ultimately leading to better strategic trades. Also Read: How to Trade the Bullish Stalled Candlestick Pattern

FAQs

What is the difference between a dumpling top and a fry pan bottom?

A dumpling top indicates a bearish reversal, while a fry pan bottom signals a bullish reversal.

Can the dumpling top pattern appear in any market?

Yes, this pattern can form in various markets, including stocks, forex, and commodities.

What is the key signal for entering a trade using the dumpling top pattern?

The key signal is the bearish gap opening after the rounded top formation, indicating a shift from bullish to bearish sentiment.


Top 5 Forex Brokers Ranked by Traders in 2025

ezekiel chew asiaforexmentor

About Ezekiel Chew

Ezekiel Chew, founder and head of training at Asia Forex Mentor, is a renowned forex expert, frequently invited to speak at major industry events. Known for his deep market insights, Ezekiel is one of the top traders committed to supporting the trading community. Making six figures per trade, he also trains traders working in banks, fund management, and prop trading firms.

RELATED ARTICLES

Join the Live Event
Get Your Free Ticket Now

I consent to receiving emails and/or text message reminders for this event.

REGISTER FOR THE MASTERCLASS!