Despite the innovation of automated trading bots and advanced trading indicators, professional traders still recognize Elliott Wave Theory as one of the most effective methods for technical analysis.
Ralph Nelson, a famous accountant, and author, innovated the Elliott Wave Theory in 1930. While developing the theory, he noticed stock price follows a natural movement pattern. He also found this pattern can be tracked using Fibonacci or fractal numbers to predict the upcoming trend.

The basic principle of the Elliott Wave applies a five-wave market price pattern known as Motive and Corrective waves.
The motive patterns form during on-trend market conditions. It helps you to project the upcoming trend-following movement of the price.
On the other hand, the corrective pattern appears when the price forms a counter-trend movement pattern and is likely to move for a correction.
Technically, a corrective wave may form in a zigzag, flat, triangle, double or triple Zigzags, and double/triple three patterns.
In terms of simplicity of use, zigzag and flat patterns are the best method to begin learning the Elliott Wave theory.
This comprehensive guide will help you understand the zigzag and flat patterns and how to spot them on price charts.
Also Read: Elliott Wave and Its Rules
Contents
- What is a Zigzag Pattern?
- How does a ZigZag Pattern Form?
- How to spot Zigzag Wave on real price charts
- Flat Pattern
- How to identify Flat corrections on price charts
- Conclusion
- FAQs
What is a Zigzag Pattern?
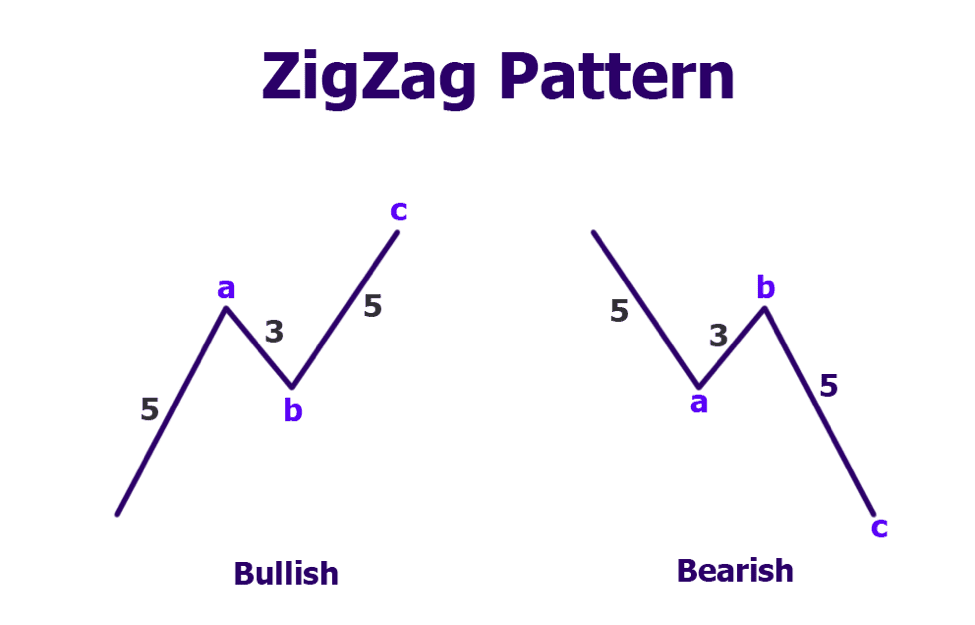
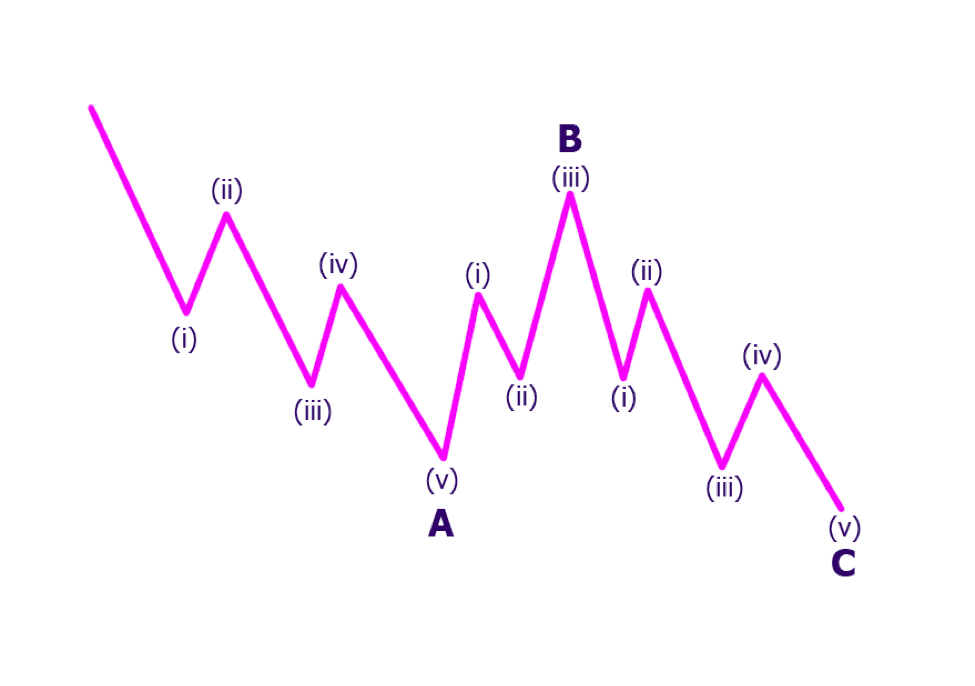
According to the Elliott wave theory, the Zigzag is a three-wave pattern labeled as a, b and c. Wave a and wave c consists of five zigzag movements.
On the other hand, wave b highlights the price correction period that comprises a three-wave movement. Most of the time, this wave will print in the opposite direction of the main trend. Technically, it is a counter-trend move.
This pattern typically forms in the second wave of a five-wave impulse and plays a role in forming Elliott wave triangles. Often, zigzags appear somewhere within a complex correction.
There are a few instances where a Zigzag will print in the direction of the larger trend. Technical analysts consider it an important price pattern that can be found in several places throughout the eight-wave Elliott Wave succession.
How does a ZigZag Pattern Form?
Wave A
Wave A is the initial sub-waves outlined as “A.” This wave points to the possible direction of the upcoming trend. While making a bullish move, wave A will produce two higher lows and three higher highs.
Conversely, you'll encounter two lower highs and three lower lows during a bearish rally. Once the chart prints wave A, we'll look for the formation of wave B.
Wave B
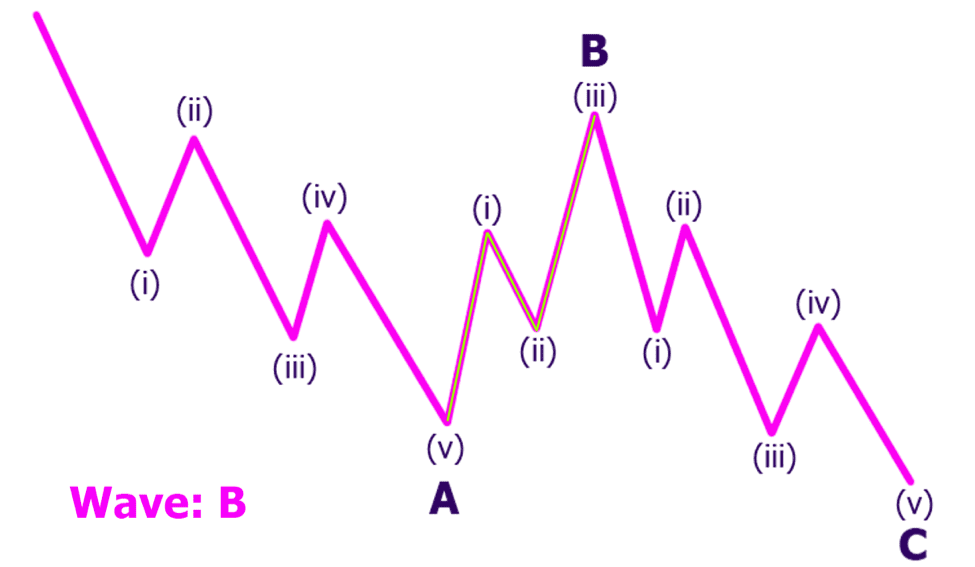
Wave B represents the corrective phase of the zigzag wave, where the price moves opposite to wave A.
Technical experts see this as a resumption of the long-term bull or bear markets. If you're familiar with the basic price action patterns, you may recognize the peak as the right shoulder of the head and shoulders pattern.
According to the Elliott wave theory, wave B should have a lower volume than wave A. During this period, the price must pull back at least 50% to a maximum of 85.4% of wave A.
Wave C
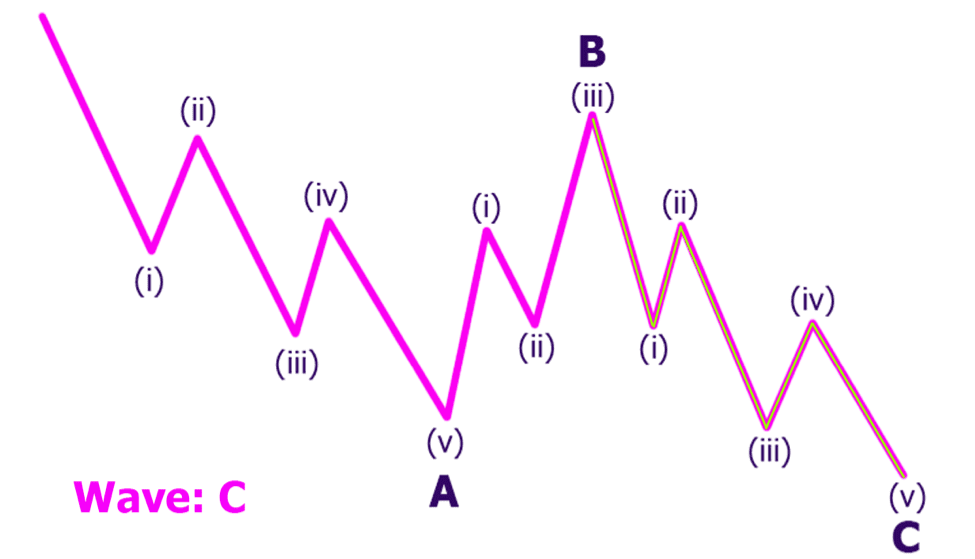
Wave C is the final movement of zigzag waves. It reflects an increase in trading volumes, and by the third leg of wave C, you'll notice a counter-trend market has already taken hold. Traders anticipate buy-sell signals when the price initiates the third impulse wave of wave C.
Wave C is typically at least as large as wave A and may often exceed it by 1.618 times. If you manage to enter a trade during the first pullback of wave C, you should ideally target a 2R profit compared to your budgeted loss.
How to spot Zigzag Wave on real price charts
The A B C zigzag pattern usually forms when prices reverse by a percentage greater than a predetermined variable. Following that, you'll need to connect the price-swinging points using straight lines to highlight the waves.
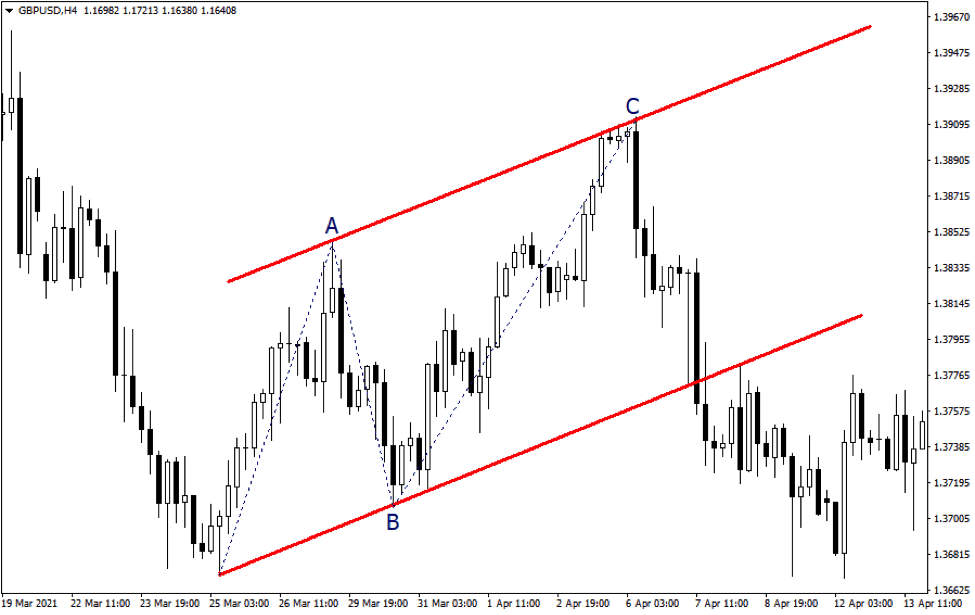
The above GBP/USD shows an example of a bullish zig-zag pattern. Here we spot “A” as the first corrective wave after the bear market turns oversold. Next, the price pullbacks for a correction near the recent market low.
According to the Elliott wave theory, alternative waves often tend to be formed within the same distance. Therefore, after the price rebounds from wave B, you can predict wave C's length by measuring the first wave's size.
We've drawn a parallel price channel on the chart, showing the length of A and C are equal in distance. In some cases, wave C can exceed 161.8% of A, depending on market volatility. Look for possible buy/sell opportunities if the projected length of C offers a 2R profit.
While activating an entry, you can use the swing position at B to anticipate the stop-loss level. For example, if you want to place a buy order targeting C, it is ideal to set the stop-loss below point B.
In the above example, GBP/USD was under an overall bear market. So, entering long based on the bullish zigzag correction will be considered a counter-trend trading approach.
Flat Pattern
A flat pattern is another three-wave corrective price structure of Elliott waves which is slightly different from zigzag waves in terms of formation structure.
The zig-zag structure forms in a 5-3-5 wave structure. Whereas the Flat pattern follows a 3-3-5 structure. There are three different types of Flat patterns known as:
- Regular Flats
- Expanded Flats
- Running Flats
Regular Flats
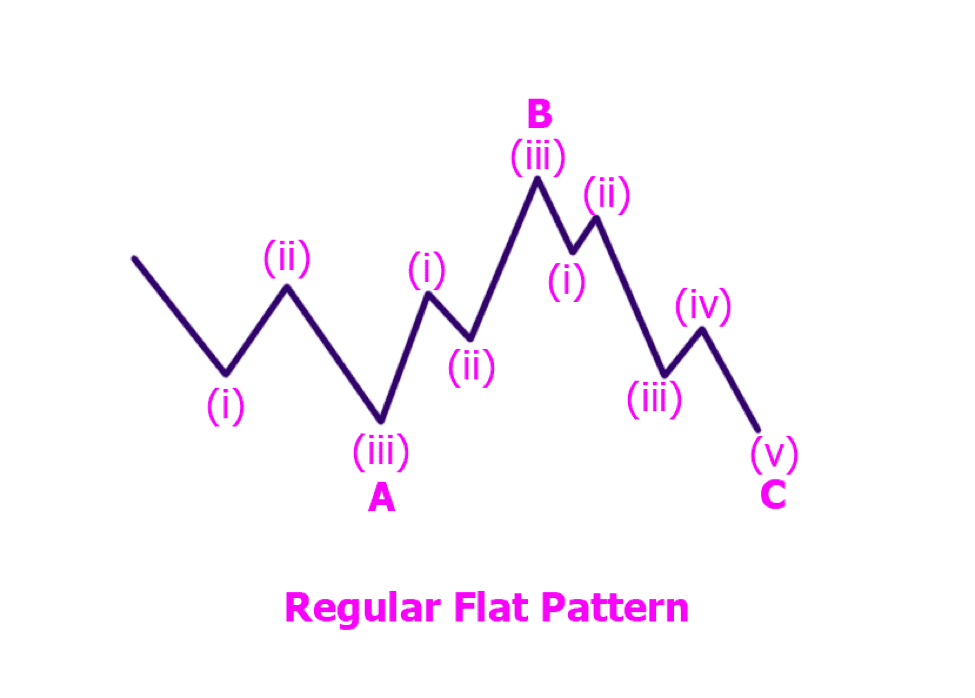
The Regular flat correction starts with wave A which has a subdivision of three waves. Depending on market sentiment, this movement can be either bullish or bearish.
Wave B also forms with a subdivision of three waves but moves opposite wave A. In technical terms, we call it a retracement or pullback. According to the Fibonacci ratio, wave B can retrace up to 90% of wave A.
Wave C moves in the same direction as wave A after the price completes the third Zigzag of wave B. Once you notice wave C's first movement is following wave A's direction, you get the confirmation of a regular flat correction pattern.
The pullback levels of wave C, (ii) & (iv) are the areas where we can look for buy/sell opportunities depending on the bullish/bearish direction of the regular plat pattern.
According to the Elliott wave theory, wave C can retrace 61.8% to 123.6% of waves A-B.
Expanded Flats
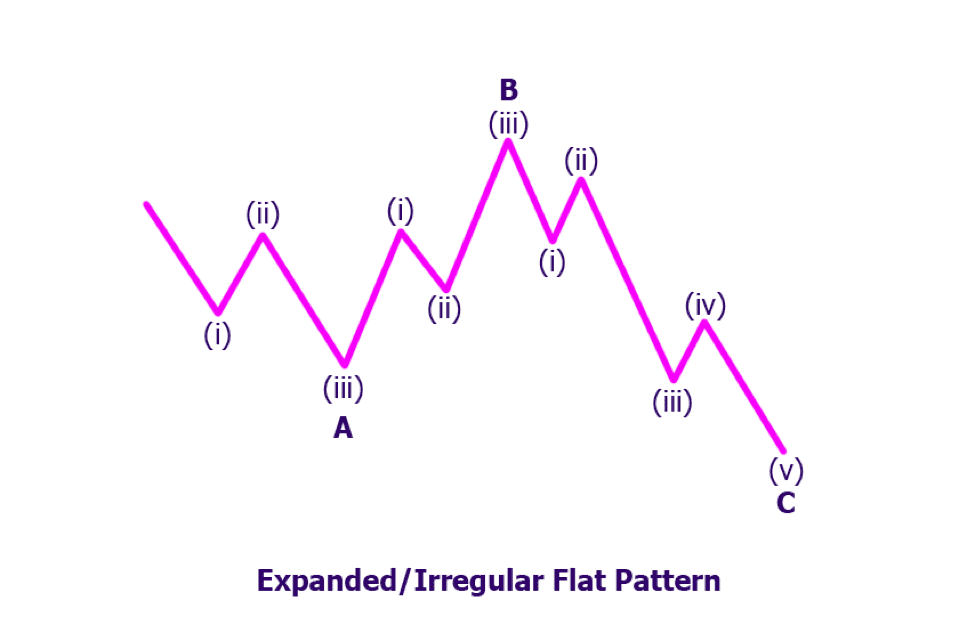
The Expanded flat correction forms in a 3-3-5 structure like the Regular flat patterns. The only difference is that waves B and C of expanded flats make extensive retracements which we call irregular movements.
Wave B can retrace up to 123.6% of wave A and wave C can retrace from 123.6% to 161.8% of waves A-B.
This pattern usually occurs during highly volatile markets when the price encounters massive buy/sell pressure. According to the Elliott wave theory, expanded or irregular flats may often result in a larger trend than the initial market trend.
Running Flats
A Running flat correction reflects indecisions over the long-term price movements. This pattern usually forms during the sideways movement of the market prices.
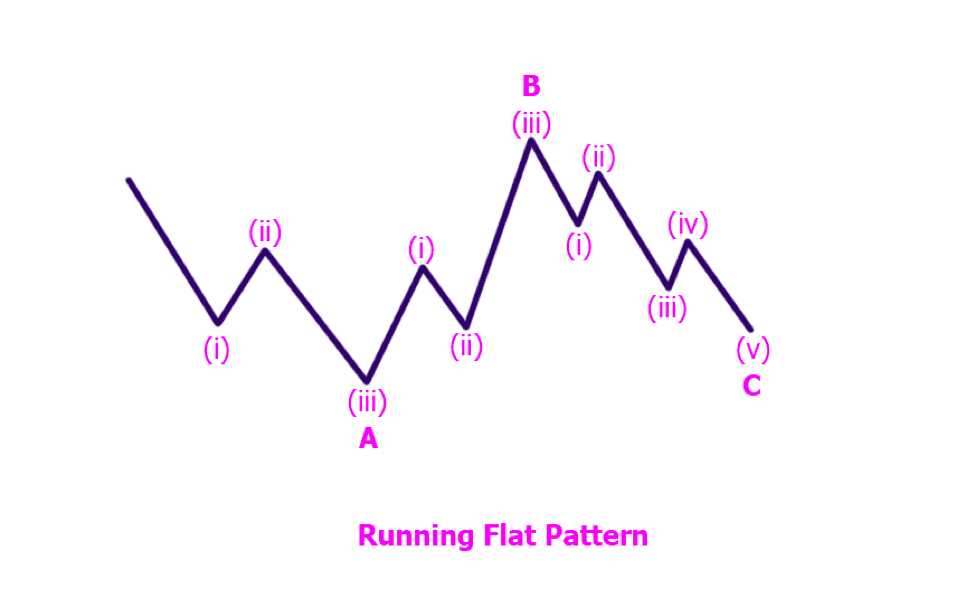
The 3-3-5 structure of running flat is quite indifferent to regular and expanded flat correction patterns. However, due to market consolidation, wave B can substantially close below the starting point of wave A.
Besides, wave C of the running flat fails to exceed the initial pullback points created by wave A. It means the supply and demand of the market prices are in equal measurement and can result in either bullish or bearish movements.
Wave B can pull back up to 123.6% of wave A based on the Fibonacci ratio relationship to the Elliott wave patterns. Also, wave C may retrace 61.8% to 100% of waves A-B while forming a flat correction.
Technically, running flat is a great pattern for anticipating potential price breakouts. The above chart shows that the price exceeding wave A's initiating point will indicate a bullish breakout. Contrarily, the price breaks lower than the ending point of wave A will signal a bearish breakout.
How to identify Flat corrections on price charts
Despite representing a simple A B C structure of 3-3-5 sub-waves, Flat correction may occur in different forms, including double three, triple three, and triangle patterns.
Regular and Running flat patterns may result in a move in either direction (bullish or bearish). However, during irregular or expanded flat corrections, wave C follows the same direction as the first wave.
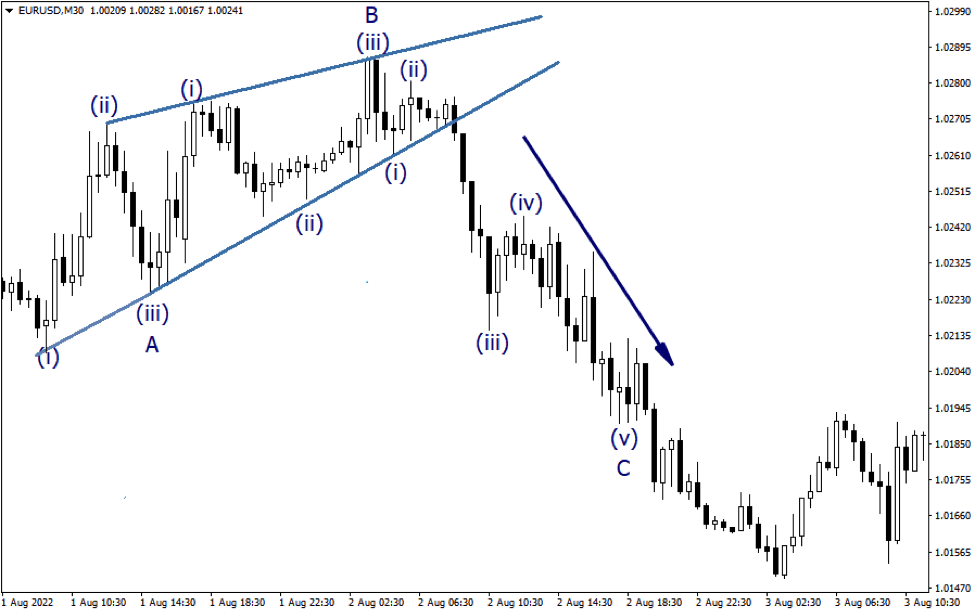
The above chart shows an expandable A B C flat structure. As you can see, despite the bullish market, the price was forming an ascending pattern. While counting the sub-waves, we've spotted wave A-B forms in a 3-3 structure.
After the price rebounds from wave B, it begins to retest the lower trendline of the price channel. A break below the respective trendline support indicates the price is heading for an extensive bearish move to point C.
If the third wave stops within the same price zone as the first wave, we'll consider it a regular flat pattern. In case of a running flat correction, you” spot wave C pulling back from 61.8% of wave A,
Unlike motive waves, a flat correction may often create a squeezing price channel that turns into a trianlge. Such patterns may appear in both trend-following and counter-trend formation.
For instance, an ascending triangle indicates the price is losing market volatility and going through indecision over the upcoming trend. In such a condition, enter long or short depending on the breakout direction of the triangle.
Conclusion
Zig zag pattern consisting within the Elliott wave theory helps trend traders create solid trading strategies. Stock and forex trading professionals consider zigzag correction as an ideal approach for trend-following trade entries.
Flat corrective waves form a much simpler approach than the zig-zag pattern and motive waves. Its 3-3-5 structure can be an ideal start for beginners learning the Elliott wave theory.
Before you plan to apply zig zag and flat patterns in real markets, please note that it takes a lot of practice to master the skill of recognizing the structures on price charts. The more you learn Elliott wave theory, the closer you are to become better performing traders.
FAQs
What is a Zig Zag wave?
Like most correction patterns, Zig Zag is subdivided into three phases, A-B-C. According to the Elliott wave principle, the Zig Zag structure divides into three waves. Wave AB represents a constant impulse or a lead diagonal. Waves can be arranged as correction patterns or as corrections.
What is a Zig Zag correction?
Zig Zag is a simple correction where Wave A forms in five waves, with Wave B having three external waves. Wave C has always composed five wave corrections, regardless of class. Here are the requirements for determining the characteristics of a ZigZag (5-3-5 structure):
- Wave A (five impulse waves) should be limited to 61.8% of the previous trend
- Wave B (three impulse waves) should retrace 50% to 85.4% of wave A
- Wave C (five impulse waves) turns opposite to wave B and moves up to 161.8% of wave A.
What happens after the 5th Elliott wave?
Elliott's wave theory can be understood as follows: 5 waves move in the direction of the main trend and 3 in adjustment. Next, the price makes a 5-wave movement in the first wave's direction.
How successful is Elliott Wave theory?
At least 85.99 % of predictions have been correct when monitoring Elliott wave accuracy. This analysis retained consistent results as it analyzed almost 3,000 estimates for 33 stocks of the S&P 500.