Learn To Trade Forex • Best Forex Trading Course • AsiaForexMentor

How to Trade the Fry Pan Bottom Pattern

Written by

Ezekiel Chew

Updated on

January 22, 2025

i

How to Trade the Fry Pan Bottom Pattern

Written by:

Ezekiel Chew

Last updated on:

January 22, 2025

The Fry Pan Bottom Pattern is a powerful tool in technical analysis, often used by traders to identify potential bullish reversals in a market. This guide will walk you through understanding, spotting, and trading this pattern effectively.

The Fry Pan Bottom Pattern, also known as the Saucier Bottom, is a bullish reversal candlestick pattern that indicates a potential shift in market sentiment from bearish to bullish. Recognizing and trading this pattern can offer significant opportunities for traders looking to capitalize on market reversals.

Also Read: Mastering Japanese Candlestick Patterns

What is the Fry Pan Bottom Pattern?
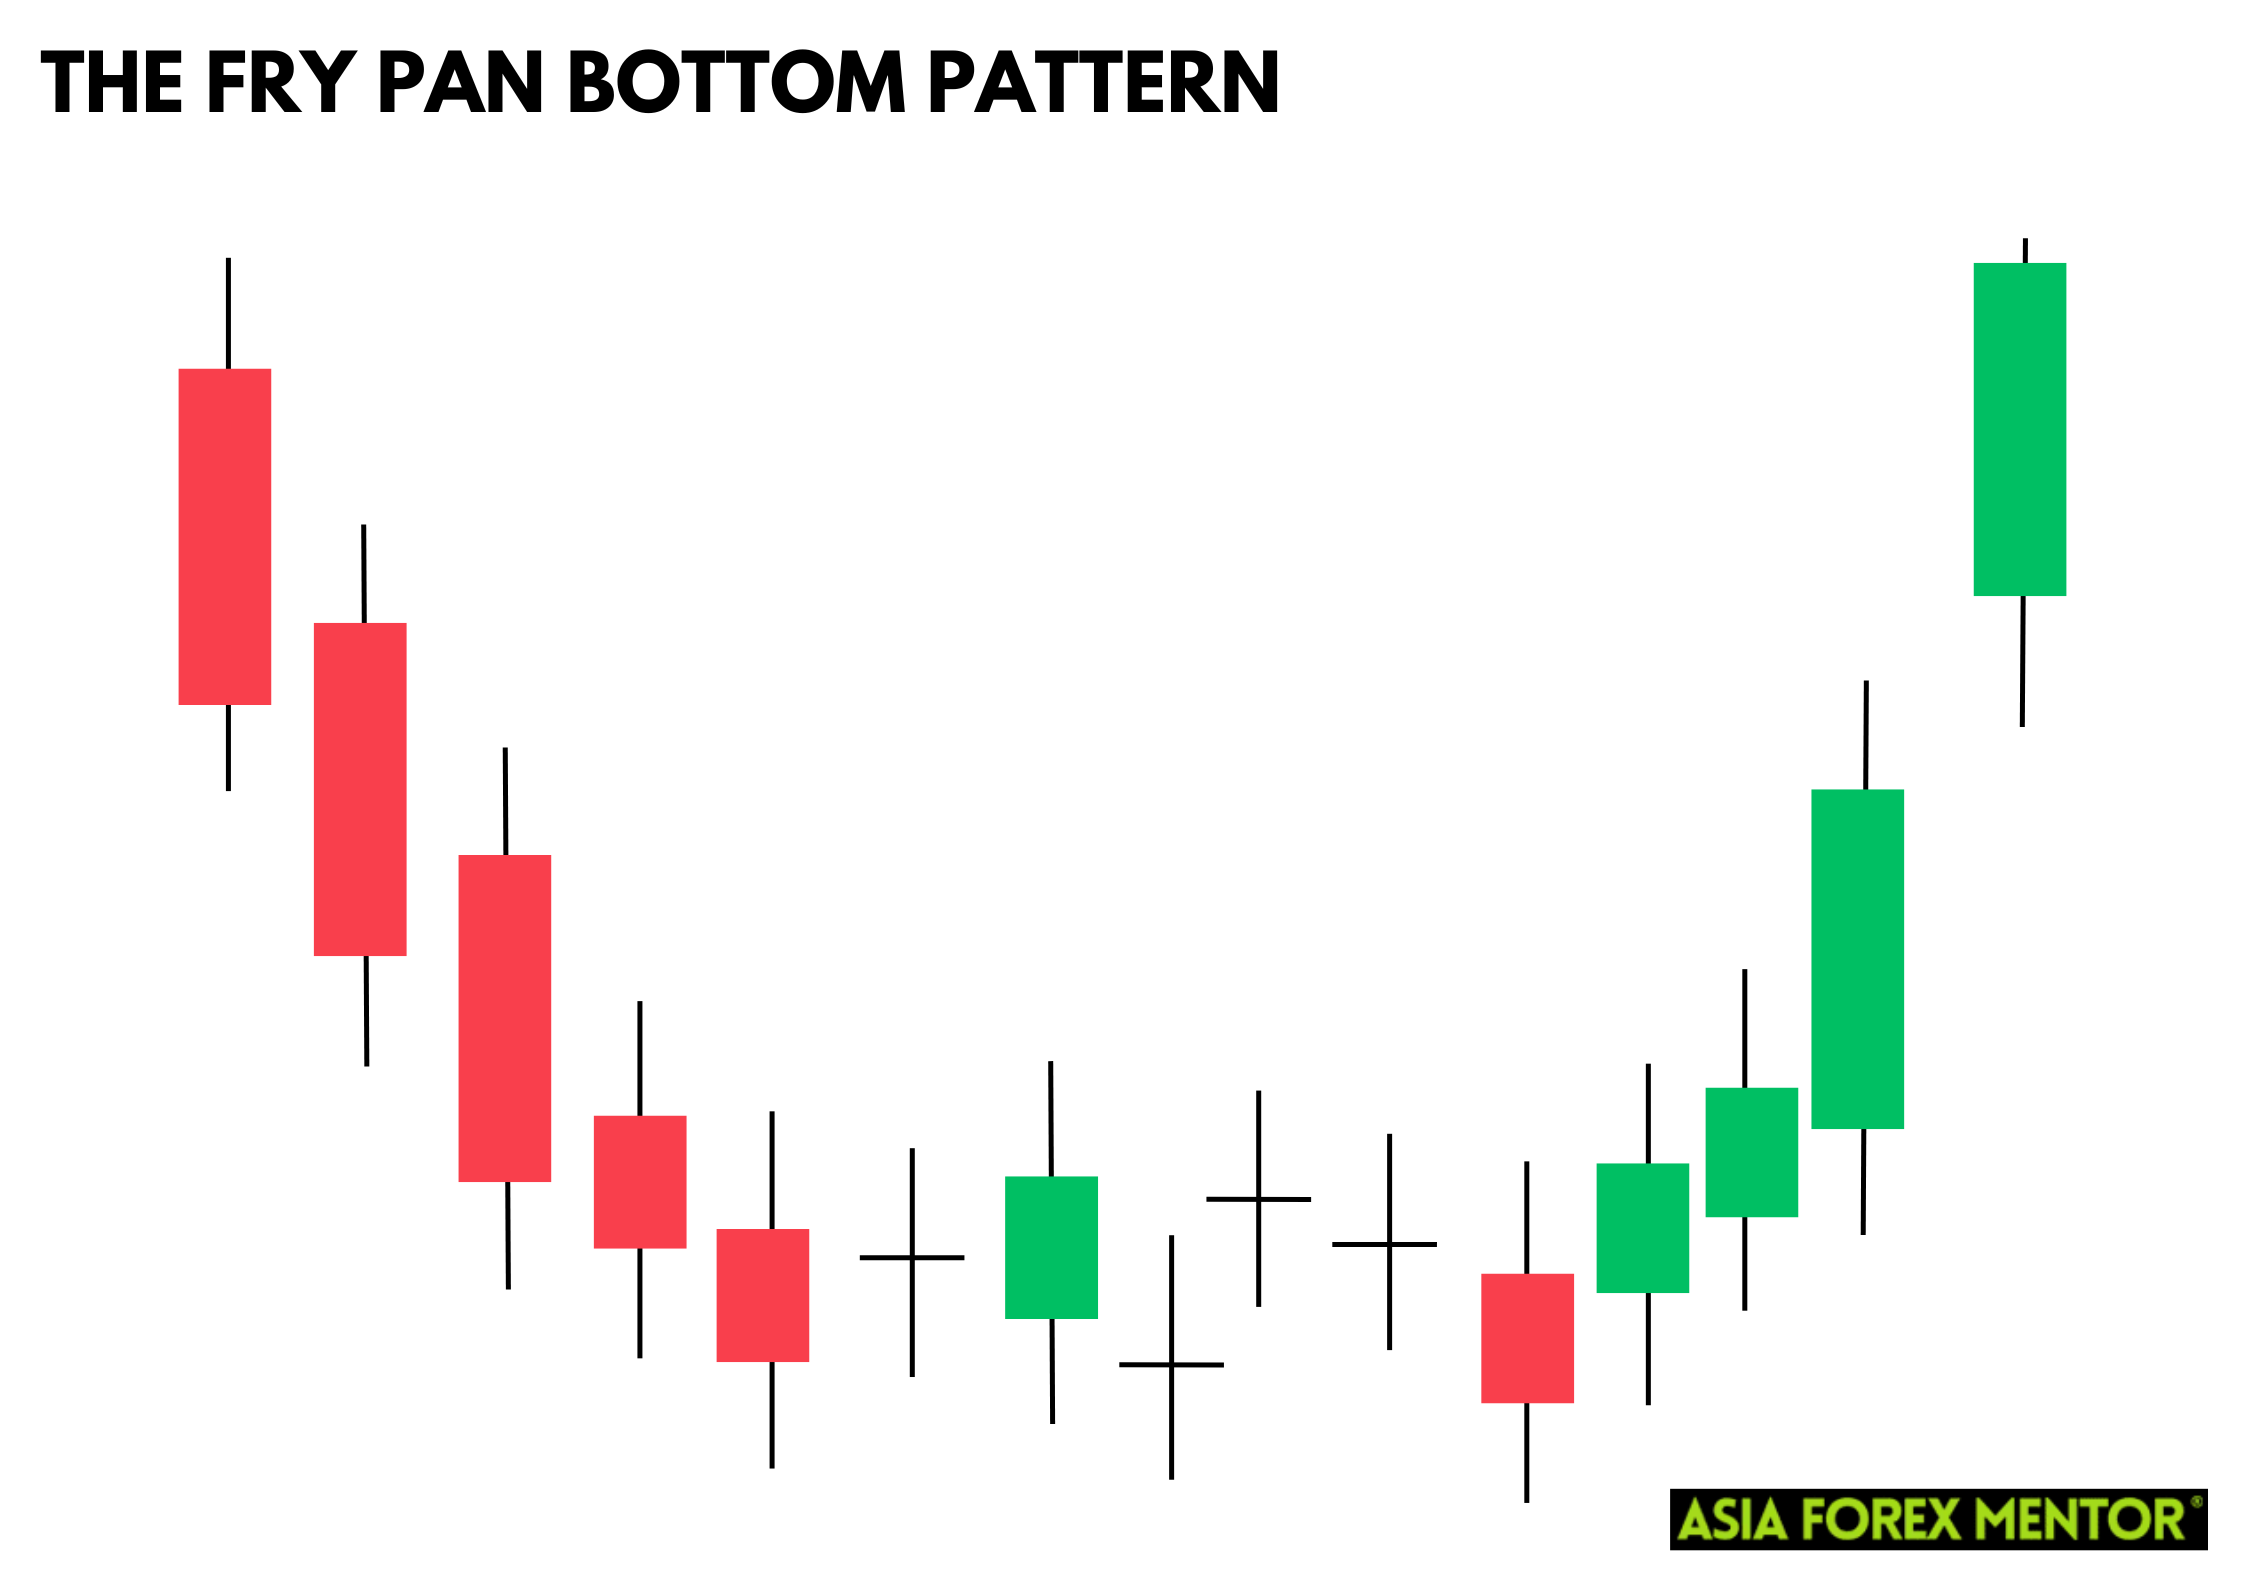
The Fry Pan Bottom Pattern forms after a downtrend and is characterized by a series of small-bodied candles that create a rounded bottom, resembling the shape of a frying pan. This pattern signals a gradual slowdown in selling pressure, followed by a shift towards buying interest, culminating in a bullish breakout. The small real body candlesticks in the pattern suggest indecision among traders, and as the pattern forms, it indicates that the bears are losing control, paving the way for bulls to take over. This transition is crucial as it often leads to a significant price action in the upward direction, making it a valuable signal for traders looking to identify bullish reversals.

When this pattern forms, it typically starts with the first candlesticks showing a consistent decline, which then transitions into the rounded bottom. This concave design is essential in recognizing the Fry Pan Bottom as it marks the gradual end of the current trend. Once the market gaps up, it provides further confirmation of the reversal, signaling traders to enter a long position. This bullish candlestick gap indicates strong buying interest, suggesting that the prior downtrend is likely over. Traders use this pattern alongside other indicators for increased reliability, ensuring that the market forms a solid foundation for a bullish reversal.

How to Spot the Fry Pan Bottom Pattern
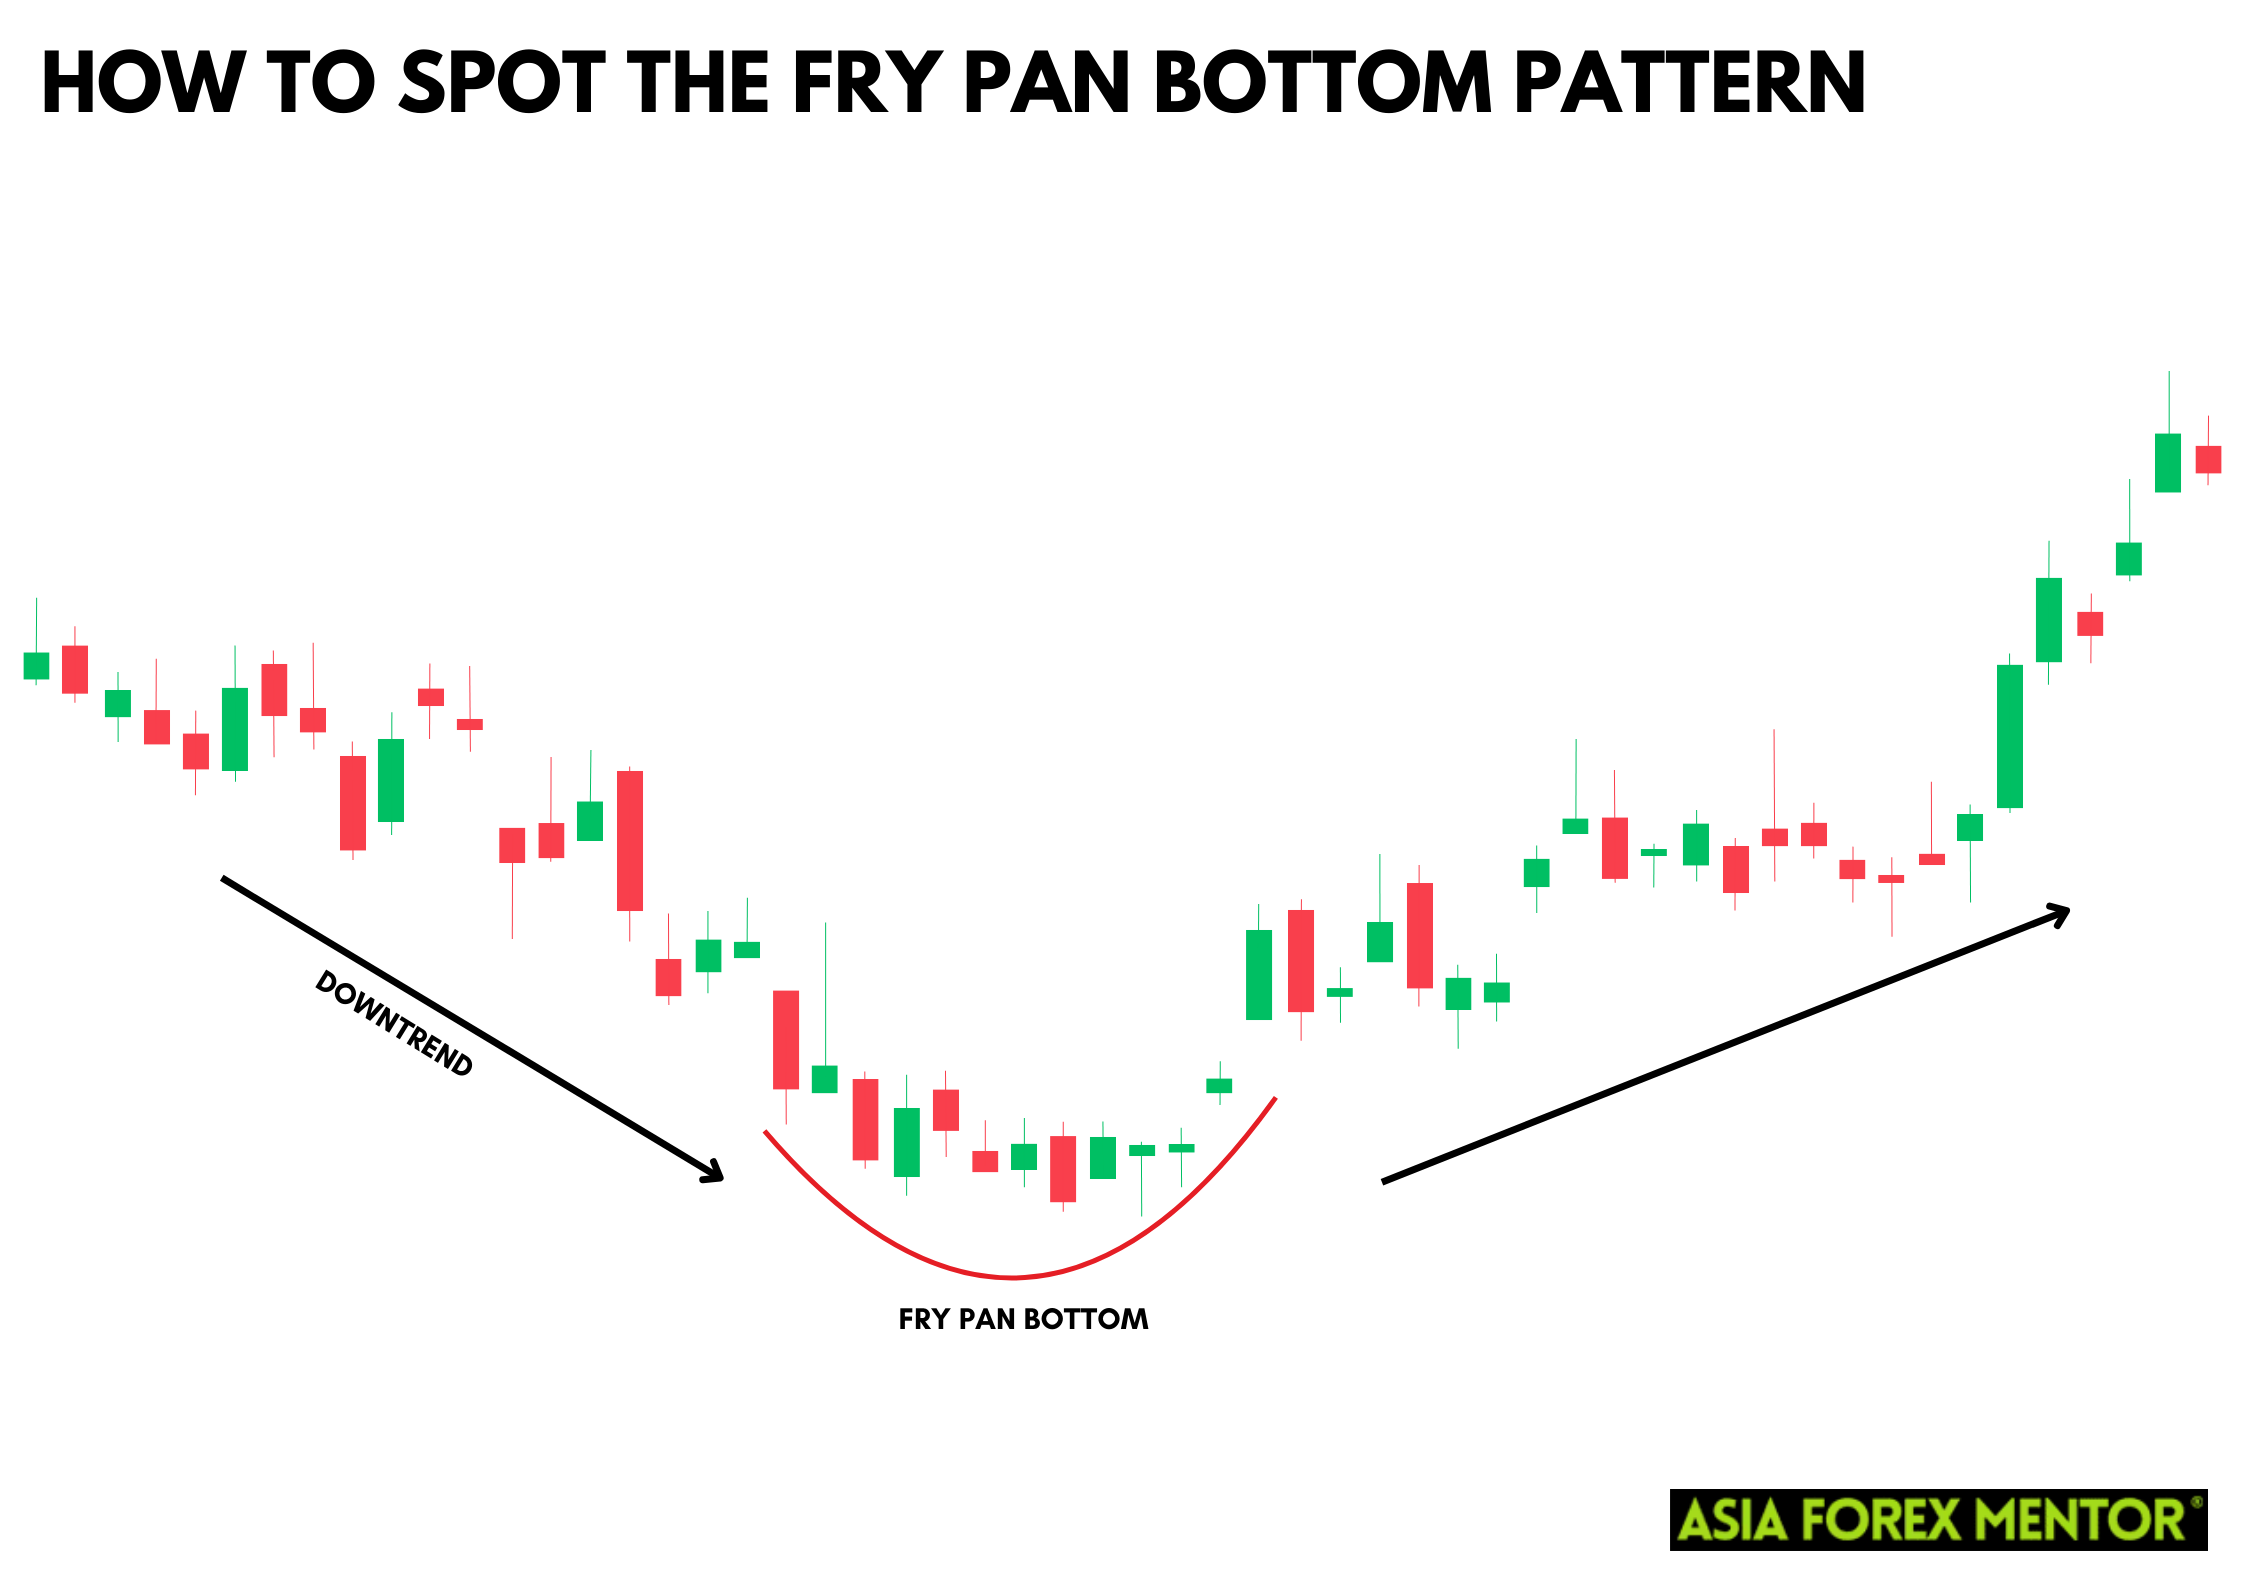
To identify the Fry Pan Bottom Pattern:

  1. Look for a Downtrend: The pattern usually forms after a sustained downtrend.
  2. Identify Small-Bodied Candles: These candles should form a rounded bottom, indicating indecision and a gradual reduction in selling pressure.
  3. Spot the Bullish Breakout: The pattern completes with a significant bullish candlestick that breaks above the resistance level formed during the downtrend.

How to Trade the Fry Pan Bottom Pattern

Entry Point
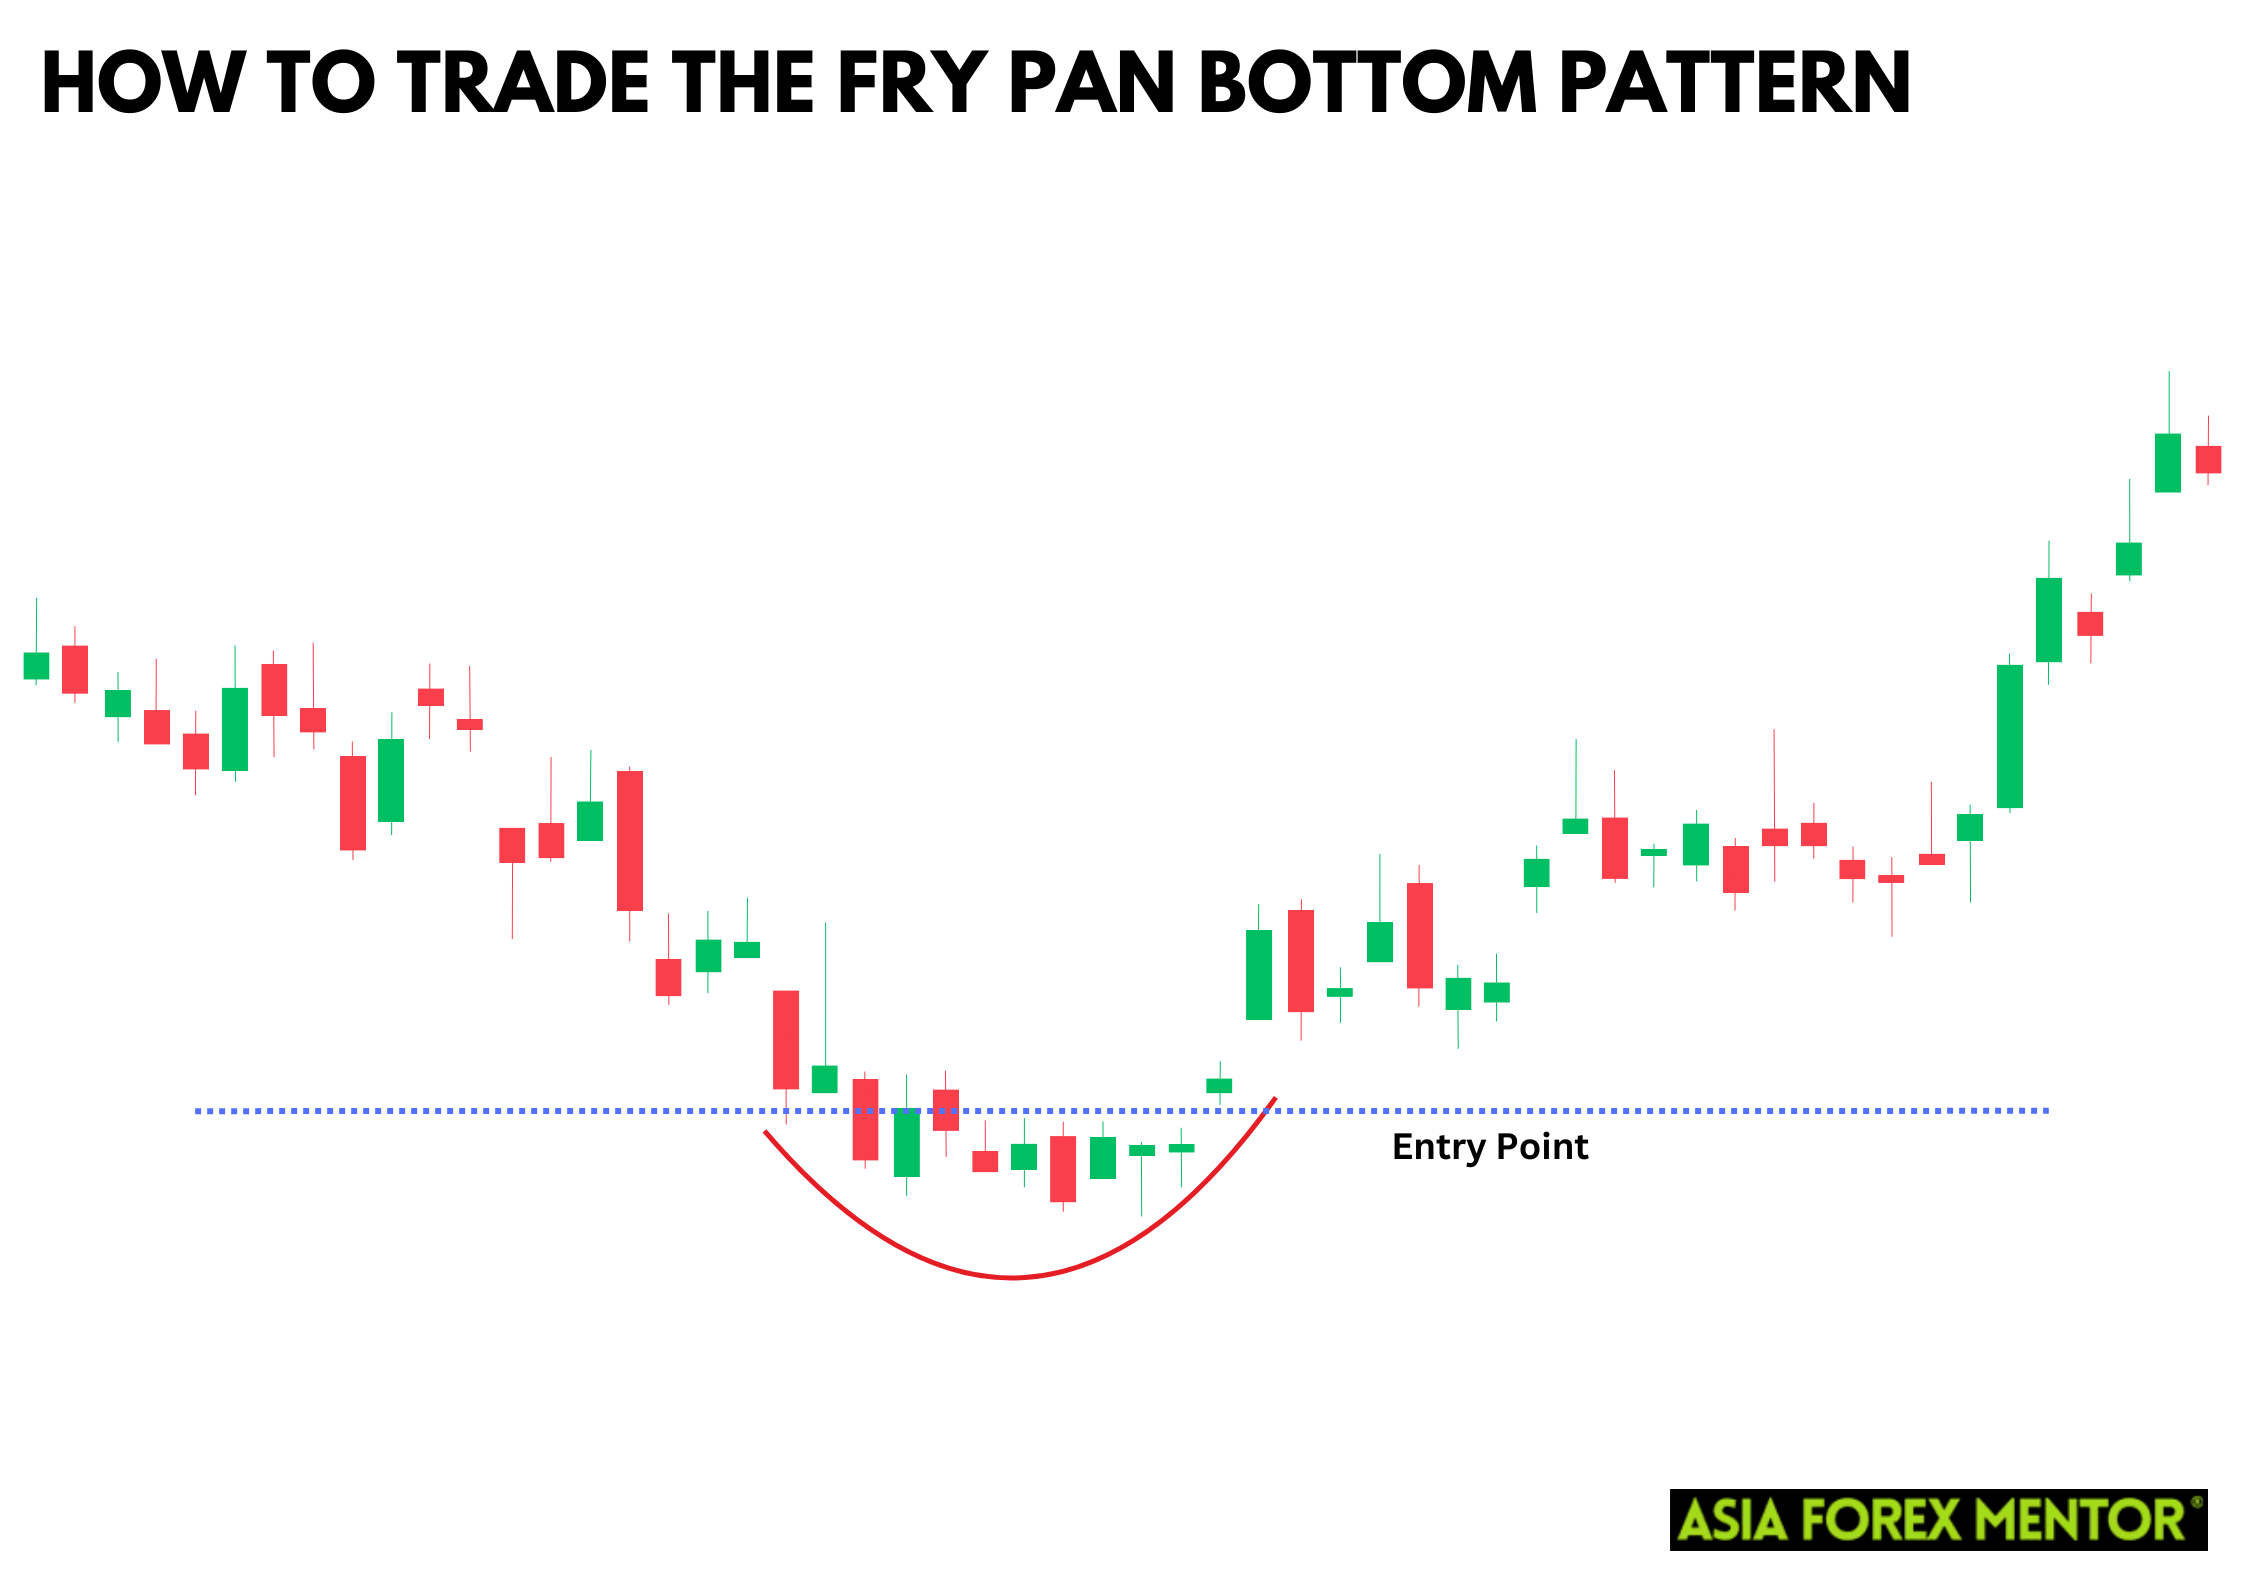
Enter a long position when the bullish breakout candlestick closes above the resistance level formed by the rounded bottom. This breakout indicates strong buying interest and a potential reversal of the downtrend. The Fry Pan Bottom Pattern typically signals this shift in market sentiment, as it suggests that the bearish momentum has been exhausted and the bulls are starting to take control. By identifying this pattern, traders can capitalize on the bullish candlestick gaps, using the breakout as a signal to enter a trade and ride the upward movement.

Stop Loss
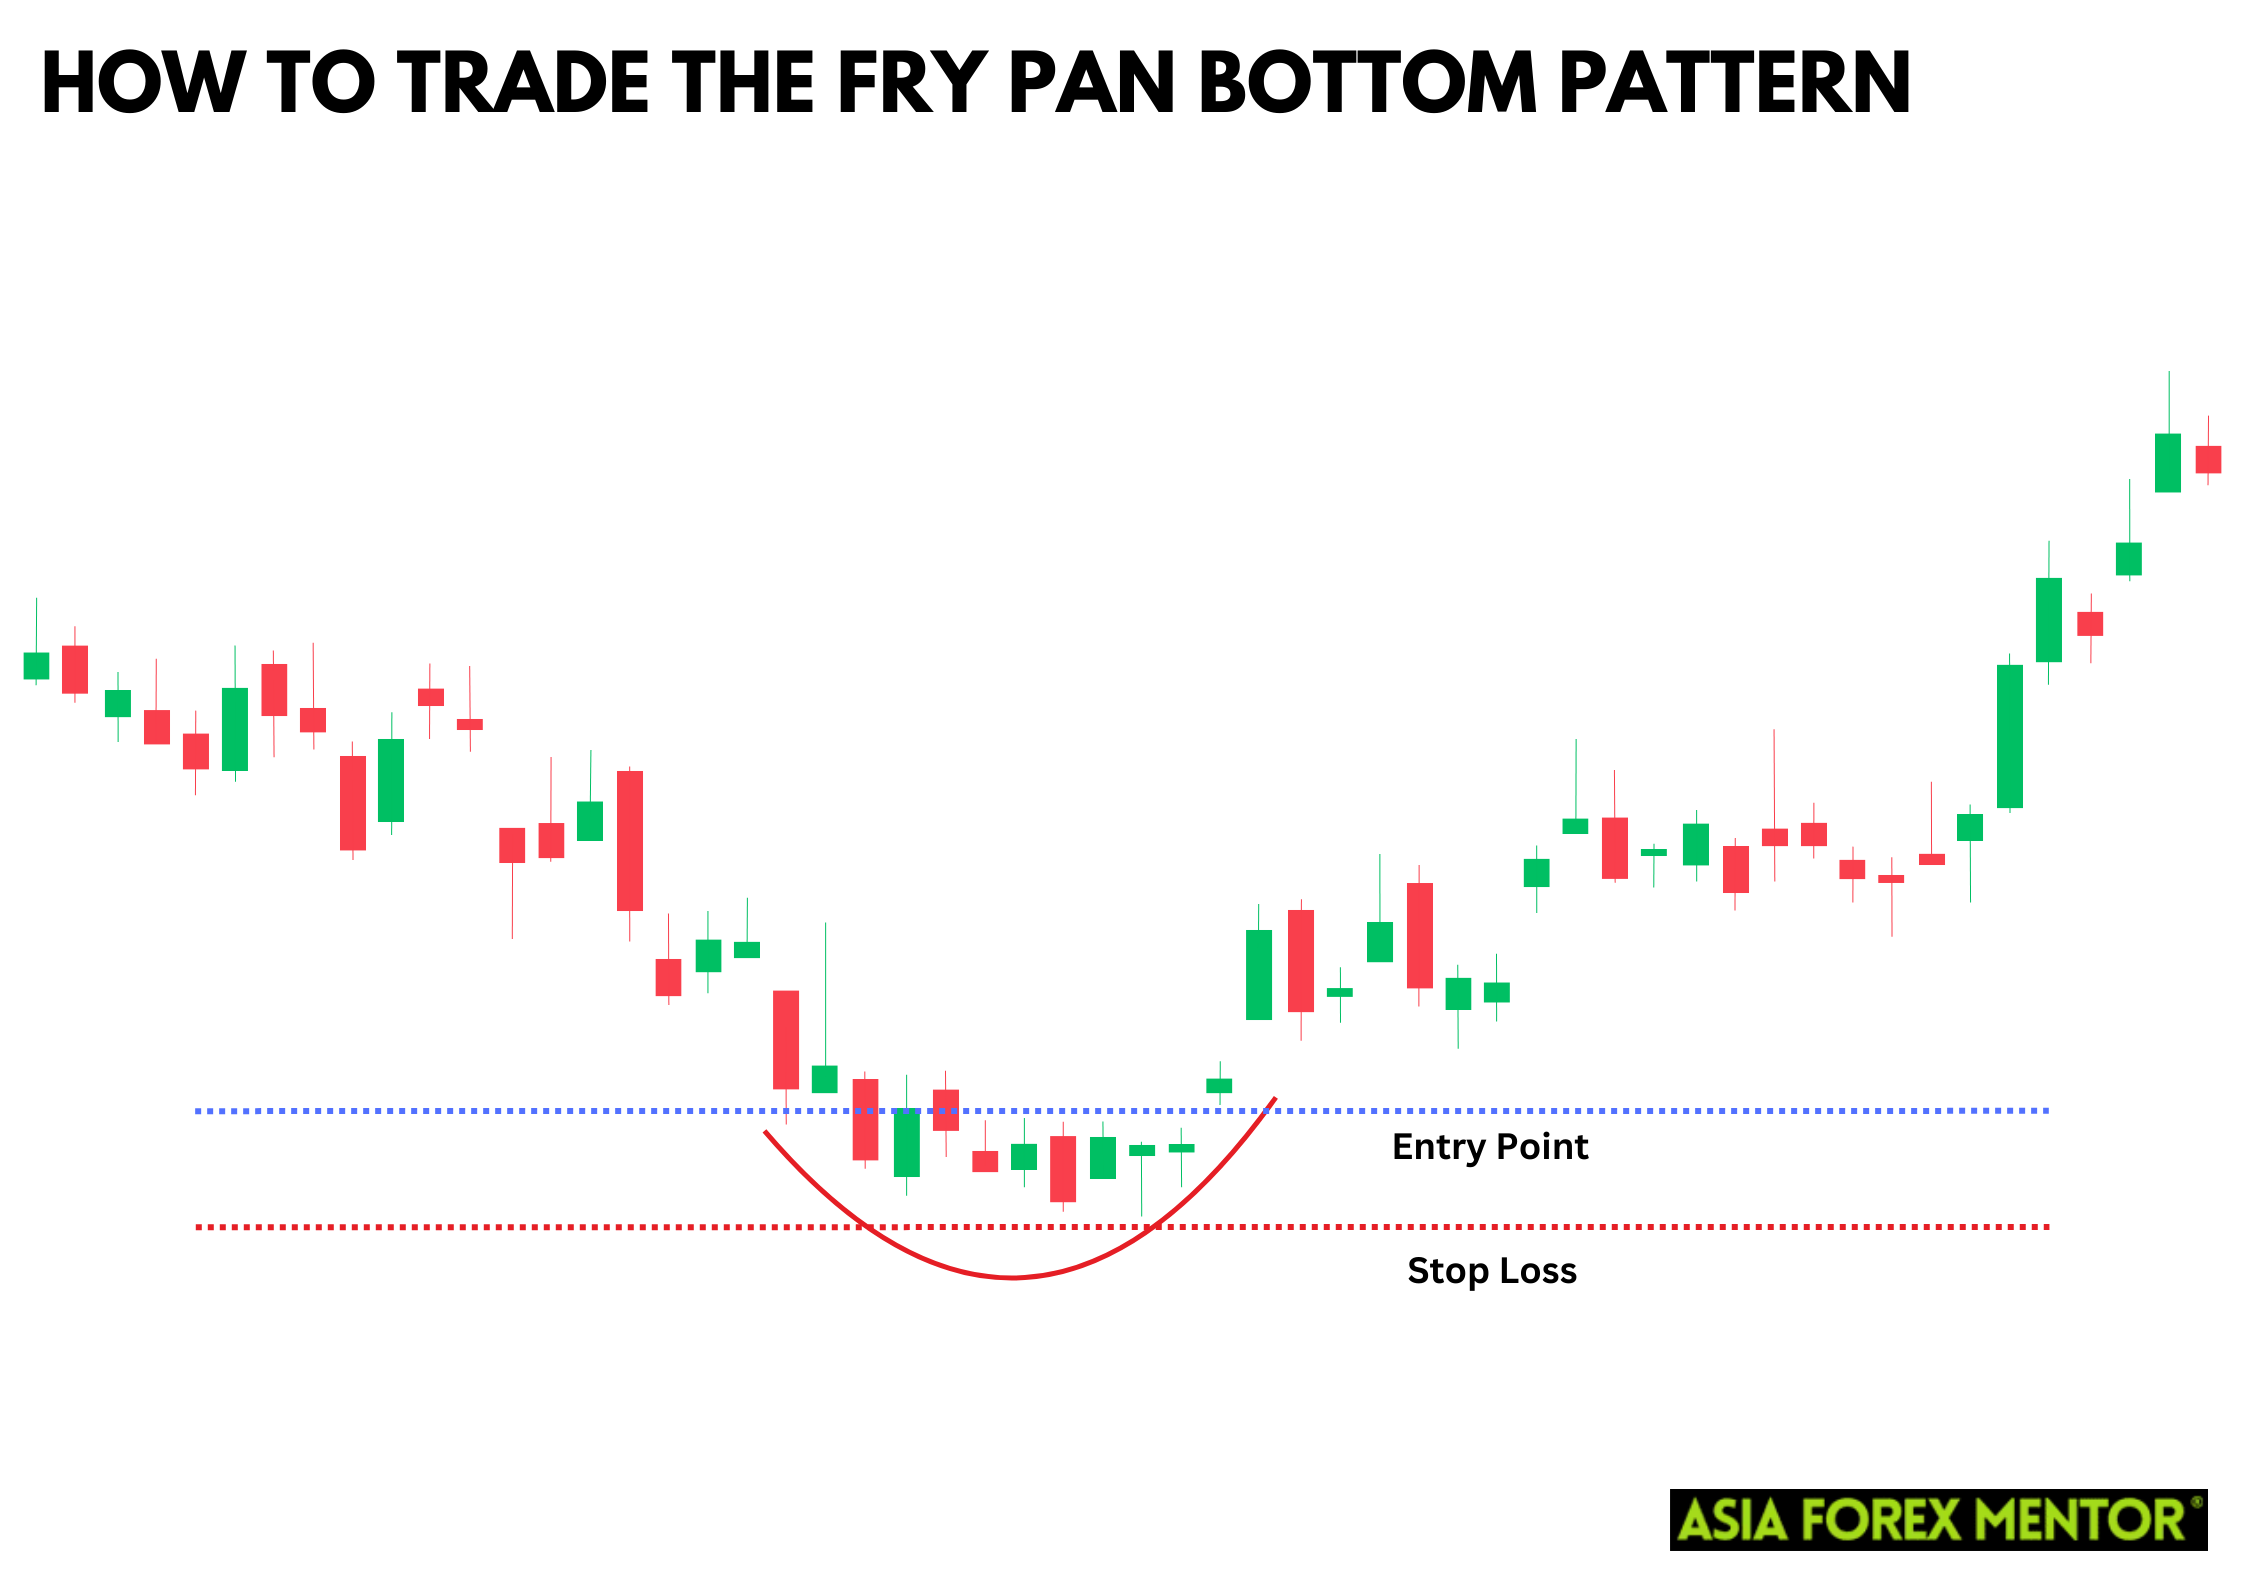
 

Set a stop-loss order below the lowest point of the rounded bottom to protect against potential false breakouts and limit losses if the pattern fails. This strategy is crucial in managing risk when trading the Fry Pan Bottom Pattern. The rounded bottom suggests a gradual shift from a bearish to a bullish market sentiment, but like all trading patterns, it is not infallible. By setting a stop-loss, traders can ensure that they exit the trade before significant losses accumulate if the market does not move as anticipated. This risk management technique is vital for preserving capital and maintaining a disciplined trading approach.

Profit Target
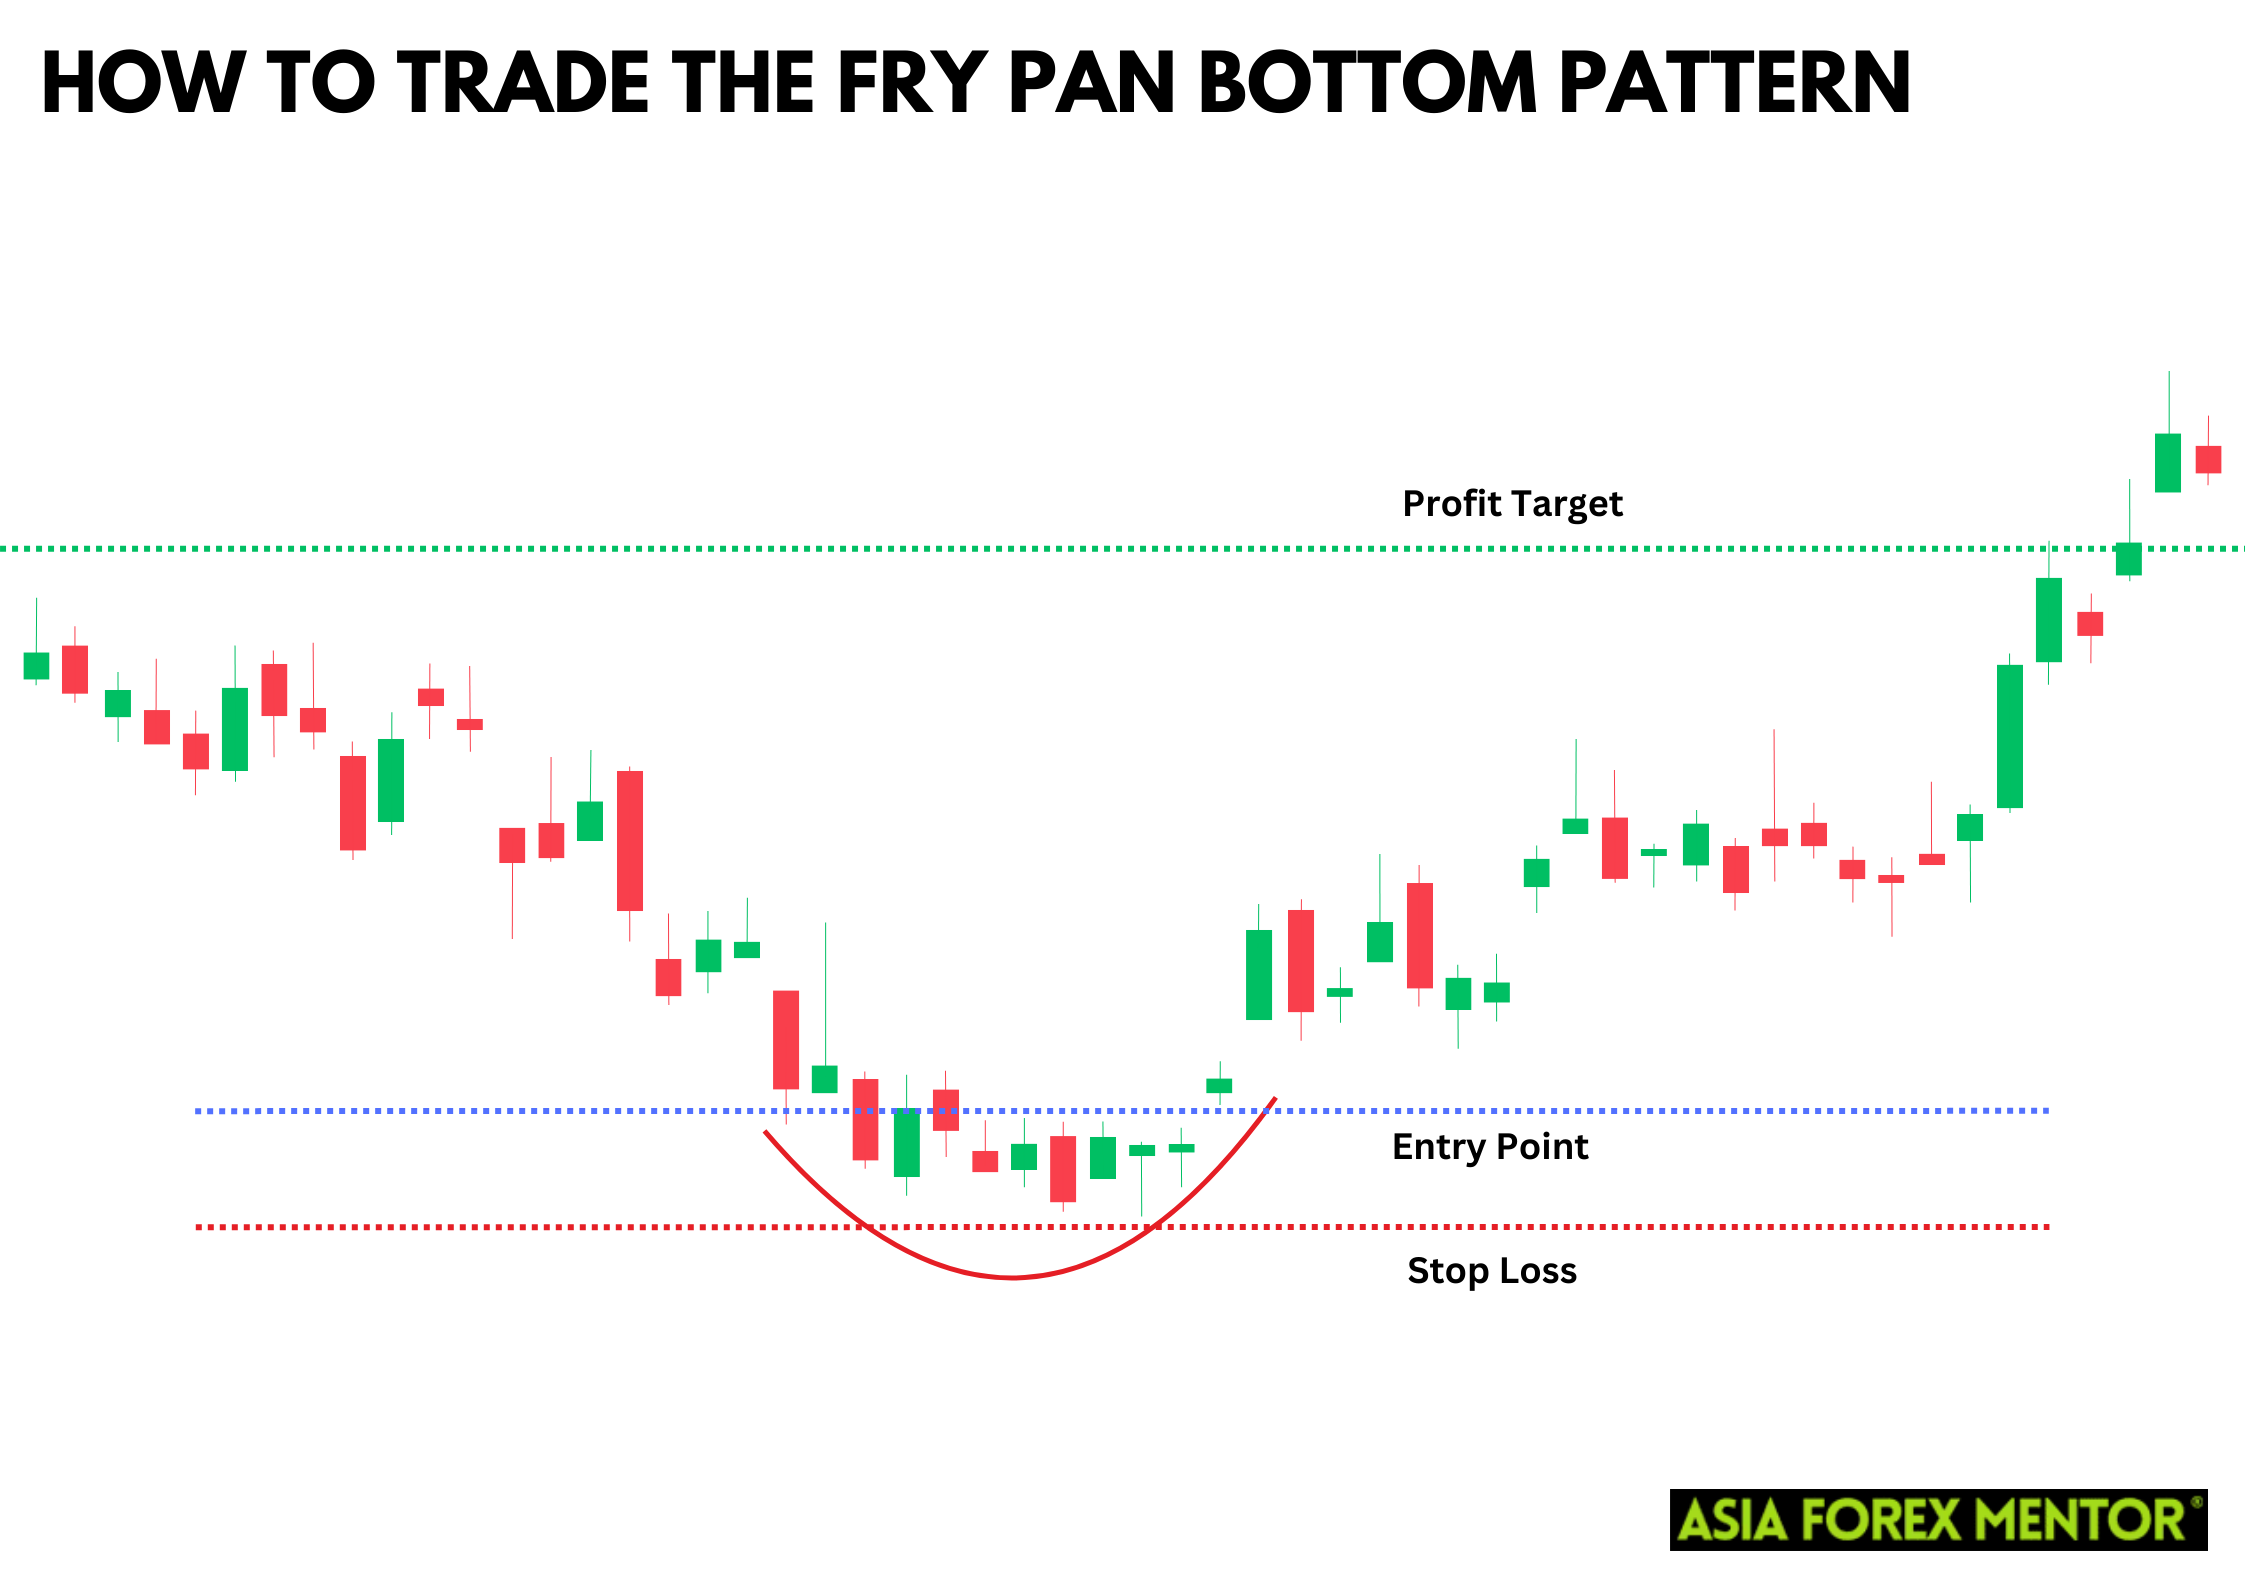
Determine your profit target based on the height of the rounded bottom or identify a previous resistance level as your target. This approach ensures a structured exit strategy, maximizing gains by capitalizing on the full potential of the fry pan bottom pattern. The height of the rounded bottom often provides a reliable measure for predicting the magnitude of the price move once the bullish reversal is confirmed. Additionally, previous resistance levels serve as logical profit targets, as they represent price points where selling pressure previously emerged.

Pros and Cons of the Fry Pan Bottom Pattern

Pros

  • Provides an early indication of a potential trend reversal
  • Defined by the breakout and stop-loss levels
  • Can be used in various markets and timeframes

Cons

  • Risk of false signals, especially in volatile markets
  • Best used with other technical indicators for confirmation
  • May produce unreliable signals in markets without a clear trend

Indicators to Use to Confirm the Pattern

To increase the reliability of the Fry Pan Bottom Pattern, use these indicators for confirmation:

  • Moving Averages: A crossover of moving averages can confirm the trend reversal.
  • Relative Strength Index (RSI): An RSI reading below 30 followed by a move above 50 can confirm the bullish reversal.
  • Volume: Increased trading volume on the breakout candlestick supports the validity of the pattern.

Conclusion

The Fry Pan Bottom Pattern is a valuable tool for identifying bullish reversals in a market. By understanding its formation, recognizing the pattern, and using proper trading strategies, traders can effectively leverage this pattern to their advantage. Always combine it with other technical indicators for further confirmation and risk management.

Also Read: How to Trade the Dumpling Top Pattern

FAQs

What is the difference between the Fry Pan Bottom Pattern and the Rounding Bottom Pattern?

The Fry Pan Bottom Pattern requires a bullish gap up to confirm the reversal, whereas the Rounding Bottom Pattern does not necessarily have this gap.

Can the Fry Pan Bottom Pattern be used in all markets?

Yes, it can be applied to various markets, including stocks, forex, and commodities, provided there is sufficient liquidity and volume.

What is the opposite of the Fry Pan Bottom Pattern?

The opposite pattern is the Dumpling Top Pattern, which indicates a bearish reversal after an uptrend.


Top 5 Forex Brokers Ranked by Traders in 2025

About Ezekiel Chew​

Ezekiel Chew, founder and head of training at Asia Forex Mentor, is a renowned forex expert, frequently invited to speak at major industry events. Known for his deep market insights, Ezekiel is one of the top traders committed to supporting the trading community. Making six figures per trade, he also trains traders working in banks, fund management, and prop trading firms.

How to Read Candlesticks (Most Traders Get This Wrong)

Most traders who spend months learning how to read candlesticks still lose on setups that looked textbook. The pattern was never the problem. Reading it without context was. ABOUT THIS GUIDE This guide covers three specific candlestick signals used in professional price action trading, the Fibonacci golden zone context tool,

Read More

What Profit Factor Tells You Before Going Live

Profit factor is calculated by dividing a strategy’s total gross profit by its total gross loss, and most experienced traders reject any system that reads below 1.5 before risking real capital. Most traders see any positive number and call it a green light. That is where the costly mistake starts.

Read More

6 Forex Trading Scams Every Beginner Should Know

The most effective forex trading scams do not announce themselves as threats. They arrive as opportunities, come through referrals and social media, and are often indistinguishable from legitimate services until the first withdrawal request is made. ABOUT THIS GUIDE This guide covers the six most common forex trading scams, the

Read More

How to Use Fibonacci Retracement Step by Step in 2026

Most traders learn how to use Fibonacci retracement and immediately draw it wrong. This tool comes from a mathematical sequence first documented in 1202, and institutional traders use it daily to plan entries at precise price levels. The majority of retail traders miss the one placement rule that makes every

Read More

Free Margin in Forex What the MT4 Panel Shows

Free margin in forex is the one figure on the MT4 or MT5 account panel that determines whether another position can open right now, and it is consistently the last number most traders learn to read. ABOUT THIS GUIDE This guide explains what free margin is and how it connects

Read More

Scalping Trading Strategy The Pros Actually Use

The scalping trading strategy most retail traders use is not actually scalping. They are gambling on 1-minute candles with no defined edge, no position-sizing rules, and no plan for when the losses come. ABOUT THIS GUIDE This guide covers what scalping is, how professional scalpers build a repeatable edge, and

Read More

AFM Trading Summit Live

Date: Coming Soon

Join us at the AFM Trading Summit Live and learn from top industry experts through live trading sessions, market insights, and actionable strategies.

How to Trade the Fry Pan Bottom Pattern

4.0
Overall Trust Index

Written by:

Updated:

January 22, 2025
The Fry Pan Bottom Pattern is a powerful tool in technical analysis, often used by traders to identify potential bullish reversals in a market. This guide will walk you through understanding, spotting, and trading this pattern effectively. The Fry Pan Bottom Pattern, also known as the Saucier Bottom, is a bullish reversal candlestick pattern that indicates a potential shift in market sentiment from bearish to bullish. Recognizing and trading this pattern can offer significant opportunities for traders looking to capitalize on market reversals. Also Read: Mastering Japanese Candlestick Patterns

What is the Fry Pan Bottom Pattern?

The Fry Pan Bottom Pattern forms after a downtrend and is characterized by a series of small-bodied candles that create a rounded bottom, resembling the shape of a frying pan. This pattern signals a gradual slowdown in selling pressure, followed by a shift towards buying interest, culminating in a bullish breakout. The small real body candlesticks in the pattern suggest indecision among traders, and as the pattern forms, it indicates that the bears are losing control, paving the way for bulls to take over. This transition is crucial as it often leads to a significant price action in the upward direction, making it a valuable signal for traders looking to identify bullish reversals. When this pattern forms, it typically starts with the first candlesticks showing a consistent decline, which then transitions into the rounded bottom. This concave design is essential in recognizing the Fry Pan Bottom as it marks the gradual end of the current trend. Once the market gaps up, it provides further confirmation of the reversal, signaling traders to enter a long position. This bullish candlestick gap indicates strong buying interest, suggesting that the prior downtrend is likely over. Traders use this pattern alongside other indicators for increased reliability, ensuring that the market forms a solid foundation for a bullish reversal.

How to Spot the Fry Pan Bottom Pattern

To identify the Fry Pan Bottom Pattern:
  1. Look for a Downtrend: The pattern usually forms after a sustained downtrend.
  2. Identify Small-Bodied Candles: These candles should form a rounded bottom, indicating indecision and a gradual reduction in selling pressure.
  3. Spot the Bullish Breakout: The pattern completes with a significant bullish candlestick that breaks above the resistance level formed during the downtrend.

How to Trade the Fry Pan Bottom Pattern

Entry Point

Enter a long position when the bullish breakout candlestick closes above the resistance level formed by the rounded bottom. This breakout indicates strong buying interest and a potential reversal of the downtrend. The Fry Pan Bottom Pattern typically signals this shift in market sentiment, as it suggests that the bearish momentum has been exhausted and the bulls are starting to take control. By identifying this pattern, traders can capitalize on the bullish candlestick gaps, using the breakout as a signal to enter a trade and ride the upward movement.

Stop Loss

  Set a stop-loss order below the lowest point of the rounded bottom to protect against potential false breakouts and limit losses if the pattern fails. This strategy is crucial in managing risk when trading the Fry Pan Bottom Pattern. The rounded bottom suggests a gradual shift from a bearish to a bullish market sentiment, but like all trading patterns, it is not infallible. By setting a stop-loss, traders can ensure that they exit the trade before significant losses accumulate if the market does not move as anticipated. This risk management technique is vital for preserving capital and maintaining a disciplined trading approach.

Profit Target

Determine your profit target based on the height of the rounded bottom or identify a previous resistance level as your target. This approach ensures a structured exit strategy, maximizing gains by capitalizing on the full potential of the fry pan bottom pattern. The height of the rounded bottom often provides a reliable measure for predicting the magnitude of the price move once the bullish reversal is confirmed. Additionally, previous resistance levels serve as logical profit targets, as they represent price points where selling pressure previously emerged.

Pros and Cons of the Fry Pan Bottom Pattern

Pros

  • Provides an early indication of a potential trend reversal
  • Defined by the breakout and stop-loss levels
  • Can be used in various markets and timeframes

Cons

  • Risk of false signals, especially in volatile markets
  • Best used with other technical indicators for confirmation
  • May produce unreliable signals in markets without a clear trend

Indicators to Use to Confirm the Pattern

To increase the reliability of the Fry Pan Bottom Pattern, use these indicators for confirmation:
  • Moving Averages: A crossover of moving averages can confirm the trend reversal.
  • Relative Strength Index (RSI): An RSI reading below 30 followed by a move above 50 can confirm the bullish reversal.
  • Volume: Increased trading volume on the breakout candlestick supports the validity of the pattern.

Conclusion

The Fry Pan Bottom Pattern is a valuable tool for identifying bullish reversals in a market. By understanding its formation, recognizing the pattern, and using proper trading strategies, traders can effectively leverage this pattern to their advantage. Always combine it with other technical indicators for further confirmation and risk management. Also Read: How to Trade the Dumpling Top Pattern

FAQs

What is the difference between the Fry Pan Bottom Pattern and the Rounding Bottom Pattern?

The Fry Pan Bottom Pattern requires a bullish gap up to confirm the reversal, whereas the Rounding Bottom Pattern does not necessarily have this gap.

Can the Fry Pan Bottom Pattern be used in all markets?

Yes, it can be applied to various markets, including stocks, forex, and commodities, provided there is sufficient liquidity and volume.

What is the opposite of the Fry Pan Bottom Pattern?

The opposite pattern is the Dumpling Top Pattern, which indicates a bearish reversal after an uptrend.


Top 5 Forex Brokers Ranked by Traders in 2025

ezekiel chew asiaforexmentor

About Ezekiel Chew

Ezekiel Chew, founder and head of training at Asia Forex Mentor, is a renowned forex expert, frequently invited to speak at major industry events. Known for his deep market insights, Ezekiel is one of the top traders committed to supporting the trading community. Making six figures per trade, he also trains traders working in banks, fund management, and prop trading firms.

RELATED ARTICLES

How to Trade the Fry Pan Bottom Pattern

4.0
Overall Trust Index

Written by:

Updated:

January 22, 2025
The Fry Pan Bottom Pattern is a powerful tool in technical analysis, often used by traders to identify potential bullish reversals in a market. This guide will walk you through understanding, spotting, and trading this pattern effectively. The Fry Pan Bottom Pattern, also known as the Saucier Bottom, is a bullish reversal candlestick pattern that indicates a potential shift in market sentiment from bearish to bullish. Recognizing and trading this pattern can offer significant opportunities for traders looking to capitalize on market reversals. Also Read: Mastering Japanese Candlestick Patterns

What is the Fry Pan Bottom Pattern?

The Fry Pan Bottom Pattern forms after a downtrend and is characterized by a series of small-bodied candles that create a rounded bottom, resembling the shape of a frying pan. This pattern signals a gradual slowdown in selling pressure, followed by a shift towards buying interest, culminating in a bullish breakout. The small real body candlesticks in the pattern suggest indecision among traders, and as the pattern forms, it indicates that the bears are losing control, paving the way for bulls to take over. This transition is crucial as it often leads to a significant price action in the upward direction, making it a valuable signal for traders looking to identify bullish reversals. When this pattern forms, it typically starts with the first candlesticks showing a consistent decline, which then transitions into the rounded bottom. This concave design is essential in recognizing the Fry Pan Bottom as it marks the gradual end of the current trend. Once the market gaps up, it provides further confirmation of the reversal, signaling traders to enter a long position. This bullish candlestick gap indicates strong buying interest, suggesting that the prior downtrend is likely over. Traders use this pattern alongside other indicators for increased reliability, ensuring that the market forms a solid foundation for a bullish reversal.

How to Spot the Fry Pan Bottom Pattern

To identify the Fry Pan Bottom Pattern:
  1. Look for a Downtrend: The pattern usually forms after a sustained downtrend.
  2. Identify Small-Bodied Candles: These candles should form a rounded bottom, indicating indecision and a gradual reduction in selling pressure.
  3. Spot the Bullish Breakout: The pattern completes with a significant bullish candlestick that breaks above the resistance level formed during the downtrend.

How to Trade the Fry Pan Bottom Pattern

Entry Point

Enter a long position when the bullish breakout candlestick closes above the resistance level formed by the rounded bottom. This breakout indicates strong buying interest and a potential reversal of the downtrend. The Fry Pan Bottom Pattern typically signals this shift in market sentiment, as it suggests that the bearish momentum has been exhausted and the bulls are starting to take control. By identifying this pattern, traders can capitalize on the bullish candlestick gaps, using the breakout as a signal to enter a trade and ride the upward movement.

Stop Loss

  Set a stop-loss order below the lowest point of the rounded bottom to protect against potential false breakouts and limit losses if the pattern fails. This strategy is crucial in managing risk when trading the Fry Pan Bottom Pattern. The rounded bottom suggests a gradual shift from a bearish to a bullish market sentiment, but like all trading patterns, it is not infallible. By setting a stop-loss, traders can ensure that they exit the trade before significant losses accumulate if the market does not move as anticipated. This risk management technique is vital for preserving capital and maintaining a disciplined trading approach.

Profit Target

Determine your profit target based on the height of the rounded bottom or identify a previous resistance level as your target. This approach ensures a structured exit strategy, maximizing gains by capitalizing on the full potential of the fry pan bottom pattern. The height of the rounded bottom often provides a reliable measure for predicting the magnitude of the price move once the bullish reversal is confirmed. Additionally, previous resistance levels serve as logical profit targets, as they represent price points where selling pressure previously emerged.

Pros and Cons of the Fry Pan Bottom Pattern

Pros

  • Provides an early indication of a potential trend reversal
  • Defined by the breakout and stop-loss levels
  • Can be used in various markets and timeframes

Cons

  • Risk of false signals, especially in volatile markets
  • Best used with other technical indicators for confirmation
  • May produce unreliable signals in markets without a clear trend

Indicators to Use to Confirm the Pattern

To increase the reliability of the Fry Pan Bottom Pattern, use these indicators for confirmation:
  • Moving Averages: A crossover of moving averages can confirm the trend reversal.
  • Relative Strength Index (RSI): An RSI reading below 30 followed by a move above 50 can confirm the bullish reversal.
  • Volume: Increased trading volume on the breakout candlestick supports the validity of the pattern.

Conclusion

The Fry Pan Bottom Pattern is a valuable tool for identifying bullish reversals in a market. By understanding its formation, recognizing the pattern, and using proper trading strategies, traders can effectively leverage this pattern to their advantage. Always combine it with other technical indicators for further confirmation and risk management. Also Read: How to Trade the Dumpling Top Pattern

FAQs

What is the difference between the Fry Pan Bottom Pattern and the Rounding Bottom Pattern?

The Fry Pan Bottom Pattern requires a bullish gap up to confirm the reversal, whereas the Rounding Bottom Pattern does not necessarily have this gap.

Can the Fry Pan Bottom Pattern be used in all markets?

Yes, it can be applied to various markets, including stocks, forex, and commodities, provided there is sufficient liquidity and volume.

What is the opposite of the Fry Pan Bottom Pattern?

The opposite pattern is the Dumpling Top Pattern, which indicates a bearish reversal after an uptrend.


Top 5 Forex Brokers Ranked by Traders in 2025

ezekiel chew asiaforexmentor

About Ezekiel Chew

Ezekiel Chew, founder and head of training at Asia Forex Mentor, is a renowned forex expert, frequently invited to speak at major industry events. Known for his deep market insights, Ezekiel is one of the top traders committed to supporting the trading community. Making six figures per trade, he also trains traders working in banks, fund management, and prop trading firms.

RELATED ARTICLES

Join the Live Event
Get Your Free Ticket Now

I consent to receiving emails and/or text message reminders for this event.

REGISTER FOR THE MASTERCLASS!