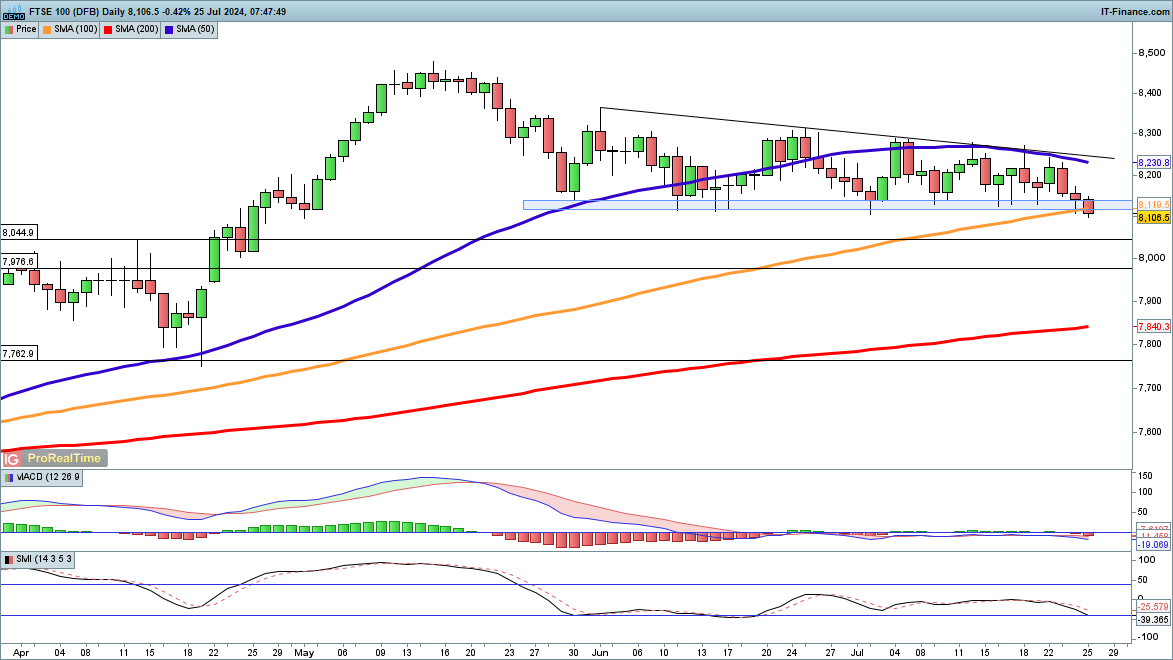
FTSE 100 Breaks Key Support Level
Heavy losses in global indices continue to impact the FTSE 100, with prices falling below the crucial support zone around 8120, which has been steady since June.
A close below this and the 100-day SMA would indicate a bearish trend, targeting support at 8044 and then 7976. Buyers need a recovery above 8150 to reclaim support.
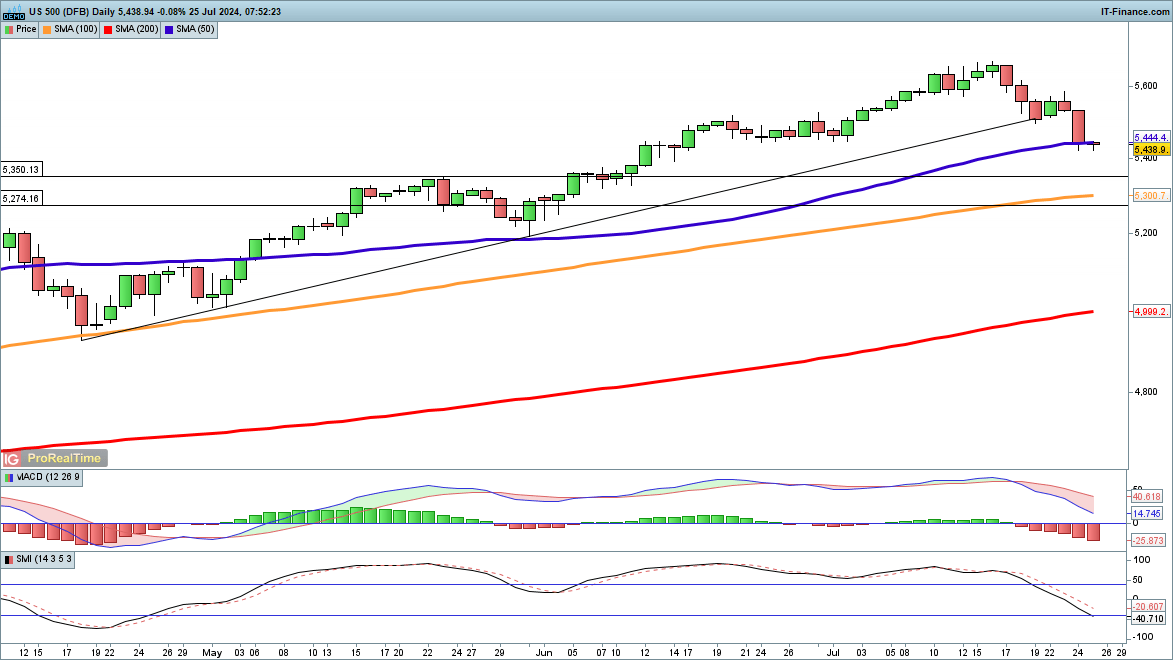
S&P 500 Ends Extended Stability Period
Yesterday, the S&P 500 dropped by 2%, ending a 356-day streak of low volatility, its longest since 2017.
The index has returned to the 50-day SMA for the first time since late May. Further declines will test support at 5350 and then 5274. A close above 5500 in the short term might indicate a low has formed, potentially leading to a test of recent highs.
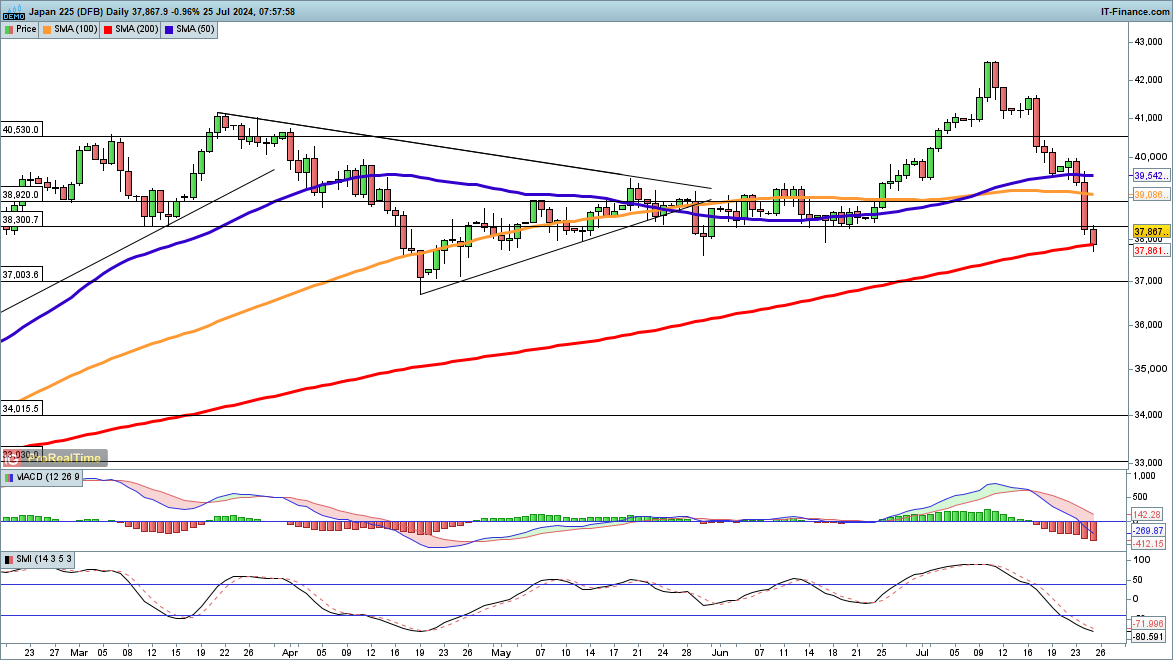
Nikkei 225 Falls to 200-Day Moving Average
The Nikkei 225 has plunged 11% from its July high to its current low, touching the 200-day SMA for the first time since October 31. This decline erases gains made since late June. Further drops could reach the 37,000 level, last seen in late April.
In the short term, a close above 38,000 might suggest a low has been formed, but the index would need to push past the 39,000 area from May and June to confirm a sustainable rebound.