
Gold prices are experiencing downward pressure, trading just below the $2,500 level early Tuesday. This movement consolidates a three-day downtrend following recent weekly lows. Market participants now turn their attention to the upcoming US ISM Manufacturing PMI data for the next major direction in gold prices.
Gold Price Awaits US ISM Manufacturing PMI Ahead of Key Employment Data
Gold has been weighed down by reduced expectations for a 50 basis points (bps) interest rate cut by the US Federal Reserve (Fed) this month. This shift followed the release of the US core Personal Consumption Expenditures (PCE) Price Index data for July, which showed a 2.6% year-over-year and 0.2% month-over-month increase in August, aligning closely with market expectations.
As a result, market forecasts for a significant rate cut by the Fed at its September 17-18 meeting have diminished. According to CME Group's FedWatch tool, current pricing suggests a 31% chance of a 50 bps cut and a 69% likelihood of a 25 bps reduction.
The expectation of a more cautious Fed approach has bolstered the US Dollar (USD), which is trading near weekly highs against its major counterparts. This USD strength negatively impacts the USD-denominated gold price, as US Treasury yields remain firm after last week's gains.
However, whether this downward trend for gold continues is uncertain as traders look ahead to Friday’s US Nonfarm Payrolls data, which will provide further insight into the Fed's potential rate cut magnitude.
Before then, gold traders may look to Tuesday's US ISM Manufacturing PMI data and Wednesday’s Job Openings and ADP Employment Change figures for guidance. The ISM Manufacturing PMI is anticipated to improve to 47.5 in August, up from 46.8 in July, while the Price Paid component is expected to ease to 52.5 from 52.9.
A lower-than-expected ISM headline figure or a significant decrease in the Price Paid Index could renew hopes for a 50 bps rate cut by the Fed, potentially reversing the USD's recovery and impacting gold prices. However, with US traders returning from a long weekend and critical employment data on the horizon, market caution is likely to prevail.
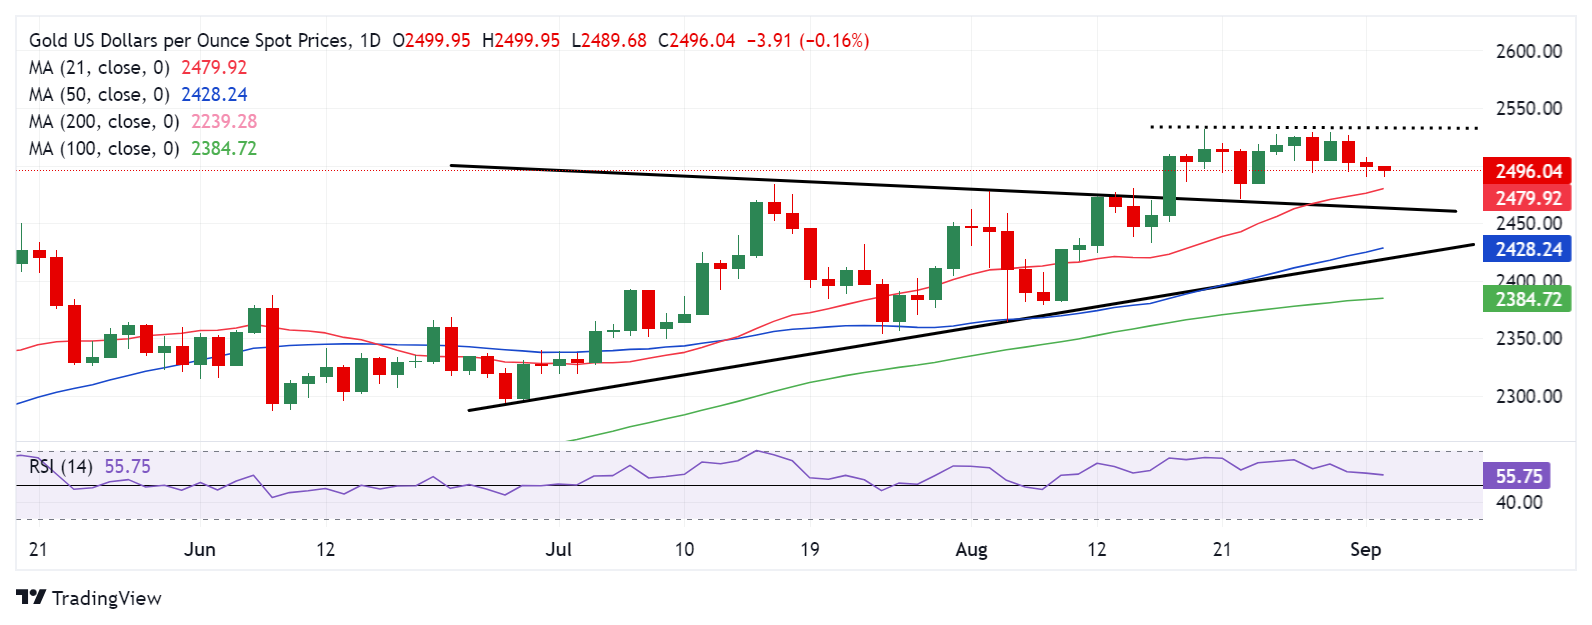
Gold price technical analysis: Daily chart
Short-Term Technical Outlook
From a technical perspective, gold buyers remain cautiously optimistic as long as prices stay above the 21-day Simple Moving Average (SMA) at $2,480.
The 14-day Relative Strength Index (RSI) trends lower toward the 50 mark, supporting the current weakness in gold prices. However, the indicator remains within bullish territory, suggesting a possible ‘buy-the-dip’ opportunity.
Should the decline persist, gold prices may challenge the 21-day SMA at $2,480. Falling below this level would bring the symmetrical triangle resistance-turned-support at $2,464 into focus.
Holding this support is crucial for gold buyers in August to maintain the uptrend. A break below could signal a fresh downtrend, targeting the $2,420 region, where the triangle support line converges with the 50-day SMA.
Conversely, if gold buyers successfully defend the 21-day SMA at $2,480 and regain the $2,500 level on a daily close, the uptrend could resume, potentially pushing toward the all-time high of $2,532.