
GET THE PROPRIETARY ONE CORE PROGRAM
(The same system I use to make 6 figures a trade with)
Figure 1 (above) This is a chart of Ethereum in a weekly timeframe.
CASE STUDY: ETHEREUM
In Forex trading, stocks, commodities or trading any other cryptocurrency, charts are always used and analysed in order to make a wise decision for trading. In this article, we will be discussing how to read, analyse and understand the charts used for trading. We will use the chart of a cryptocurrency, Ethereum, as an example. You can however use the same principle in forex trading, stocks, commodities or trading any other kind of cryptocurrency.
In this example, the chart shows the trend of the price of Ethereum and where the price is currently. Within the trend, there is a zone that divides the downward trend and the upward trend. Above the line is where Ethereum breaks through to an upward trend and below the line is where it crashes in a downward trend. It is basically a dividing line between the upward trend and the downward trend.
How to read the charts in forex trading like a pro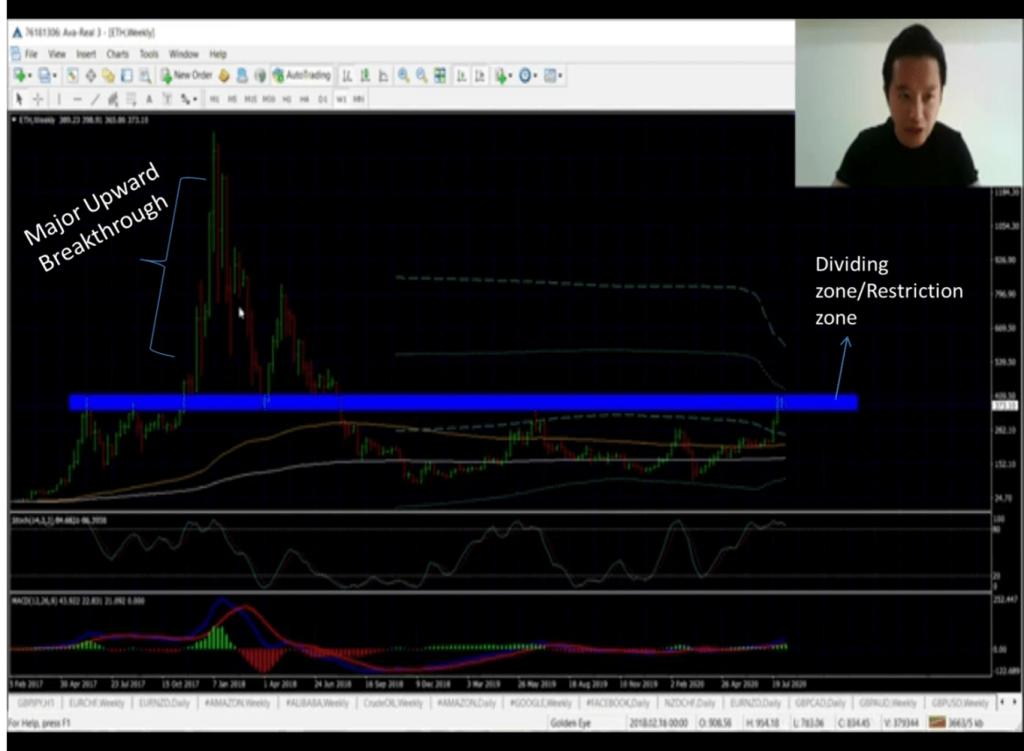
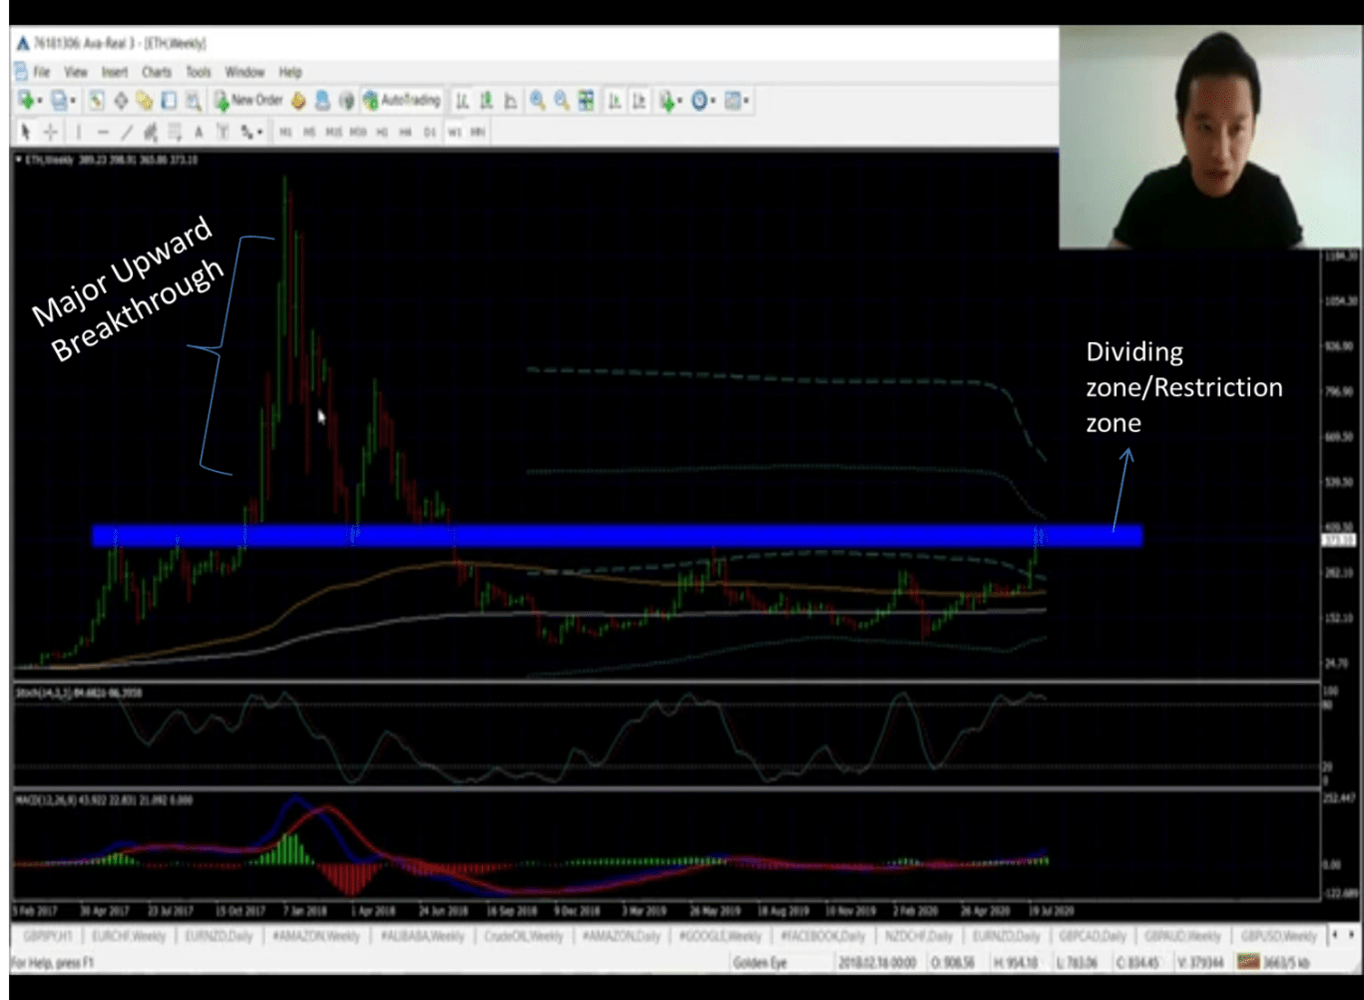
Figure 2 The chart with the dividing zone between the uptrend and the down trend.
Looking at the chart within the dividing zone from the left, we see that Ethereum tried to break through in an upward trend, but it couldn’t, so it crashed below the dividing zone in a downward trend. It tried to break through again, and then crashed below the zone. The third time, it tried to break through above again. It broke through a little above the dividing zone, but crashed again into the dividing zone. Now, this point of the chart is a strong and crucial level because when it first broke through past the resistance level (dividing zone), it normally will need to come down for a while to ensure it is holding well. If it holds well, that is when you know it is strong and when it breaks through again, it is going to be a good one going in a high upward trend. After it broke through on a progressive upward trend, it later came back down to the dividing zone. Seeing that it had not been to the dividing zone for some time, it went back up, came back down and after some time crashed below the dividing zone into a downward trend. It tested and tried to break through the dividing zone some time after again, but could not and has not broken through above the dividing zone after that. This is just a summary of what is happening in the chart.
The point where Ethereum is right now is a crucial point. It is at another point of testing this resistance level (dividing zone). Looking at the past trend, if the price can manage to close above (like it did before at the first major breakthrough), there is a high chance of Ethereum shooting high again like the previous time and a tendency for even a higher level. The price closing above is majorly what needs to happen for it to break through from a downward trend to an upward trend.
So, in this stage where Ethereum is still in the dividing zone, there are few moves you can make. One of such is that, if it eventually breaks through above out of the dividing zone, you can make a breakout trade and enter. You can either enter at the point where it breaks out, or when it tests the holding up level before it breaks out above again. All of this is using the previous upward trend breakout as an example.
However, in the current state Ethereum is, can it breakout above into an upwards trend?
How to read the charts in forex trading like a pro
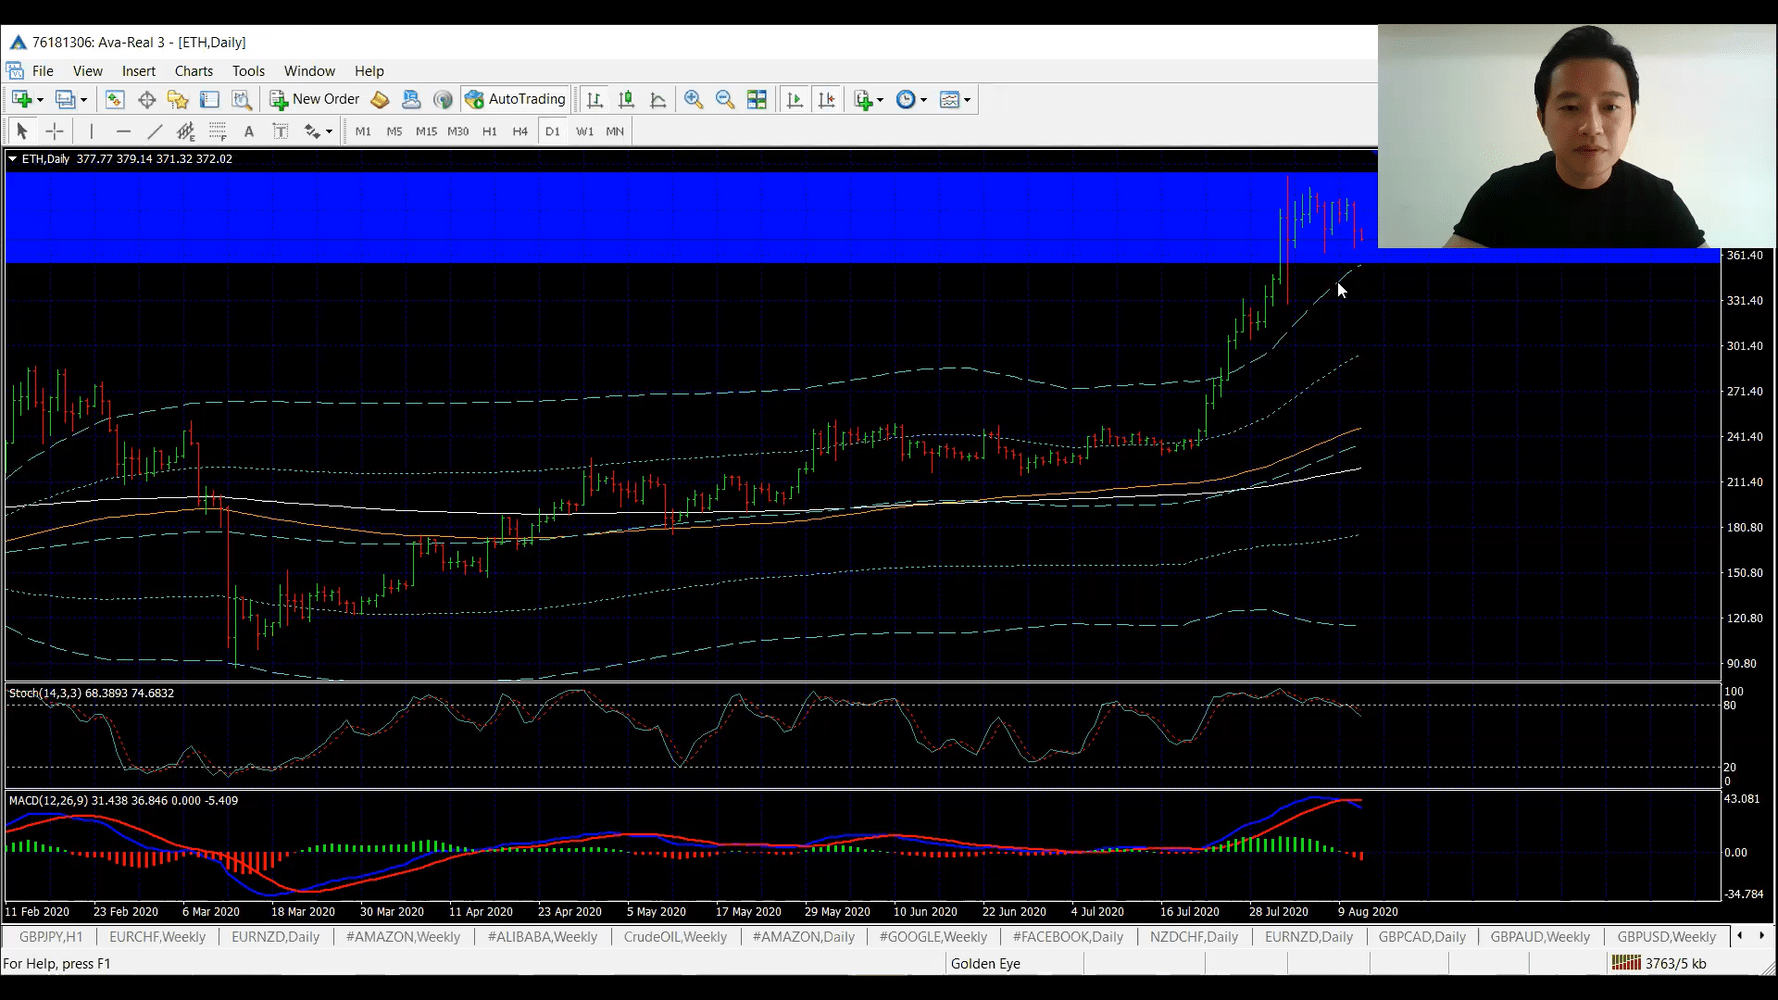
Figure 3 Ethereum in Daily time frame
Zooming closer into the daily timeframe, we see that Ethereum is currently in the dividing zone (blue box). In this zone, we see that since it entered the zone, it has been moving within that same zone. There are two things that can happen in this situation. The price can keep on going sideways within the dividing zone, test to see if it can break through into an upward trend and actually breaks through (like the case of the first major break through above the dividing zone). Another thing that can happen is that the when it tries to break through above the restriction level, if it fails, it will need to come down way below the dividing line before going back up to the dividing line to test if it can break through above. So where Ethereum currently is, we need to find out which of these will happen. Will it continue sideways, test and break through above, or it will it test and crash below the dividing line?
From the charts, we see that the MACD (Moving Average Convergence Divergence) below is currently showing a cross (two Exponential Moving Average (EMA) crosses). This is significant because if we look at previous times where the blue line crosses the red line, we see that the price of Ethereum fell few days after. This is very telling on what may happen at this current time. Looking at the MACD for this current time, we see that the blue line crosses the red and that may just be an indicator that the price may fall soon. So predicting that it may fall, we also need to find out how much it will fall before it breaks up above.
How to read the charts in forex trading like a pro
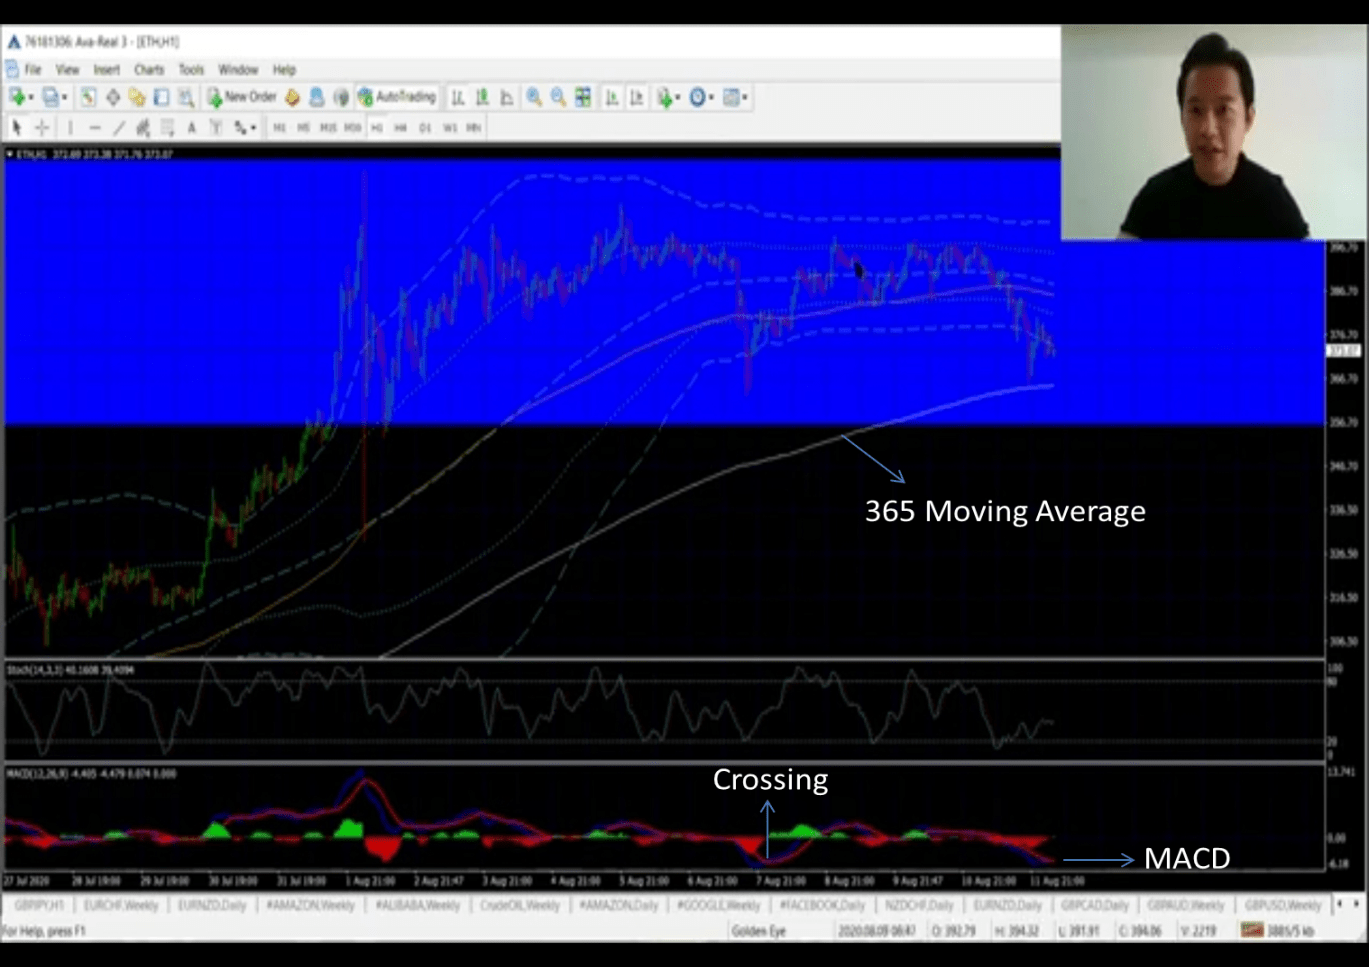 Figure 4 Ethereum chart in the one hour timeframe
Zooming in to hourly time frame, we see that within the dividing line, the price rises and crashes several times. The trend seems to be testing to break through the restriction zone upward, but it can’t so then it crashes downward. This happens repeatedly. If it manages to break out of the upper part of the dividing zone, then it will go in an upward trend; if it breaks down below out of the dividing zone, it will usually go in a downward trend. If we look closer at the one-hour frame, we see the price testing to break above the Bollinger band. It goes in the same volatile trend of testing to break above the Bollinger band. If it can’t, it falls. This happens again and again, and usually after some time, if it hasn’t been able to break above the Bollinger line, it will have to crash low – lower than all the previous crashes, before breaking upwards to test again. If after crashing so low, it manages to break up above the Bollinger line, it is a good sign. However, looking at where the price currently is, it is at about the same level as previous times when it crashed very low. Now, if the price closes below the previous lows, and even below the 365 Moving Average line, then it is very likely that it is coinciding with the crossing of the MACD and the price coming downwards. Looking closer at the current very low point and the last very low point, we see that the current low point is almost as low as the previous (but not the same level). At the very low points, we also see that the MACD at the current low-point is not as low as the MACD at the previous low-point. This indicates that the current point may not yet be so strong to launch an upward trend that breaks through the upper restriction zone. Therefore, it may go up a little bit before coming down again in order to launch a stronger breakthrough upward. So, for now, it is not yet strong enough. This is just one prediction of what may happen. In addition, the blue MACD line is just about to crossover the red one. When this happened in the previous low-point, it went up a little as well. So, this may just be a sign.
Bollinger bands: According to Investopedia, Bollinger Bands are trend lines that are two standard deviations away from the simple moving average price of a security.
How to read the charts in forex trading like a pro
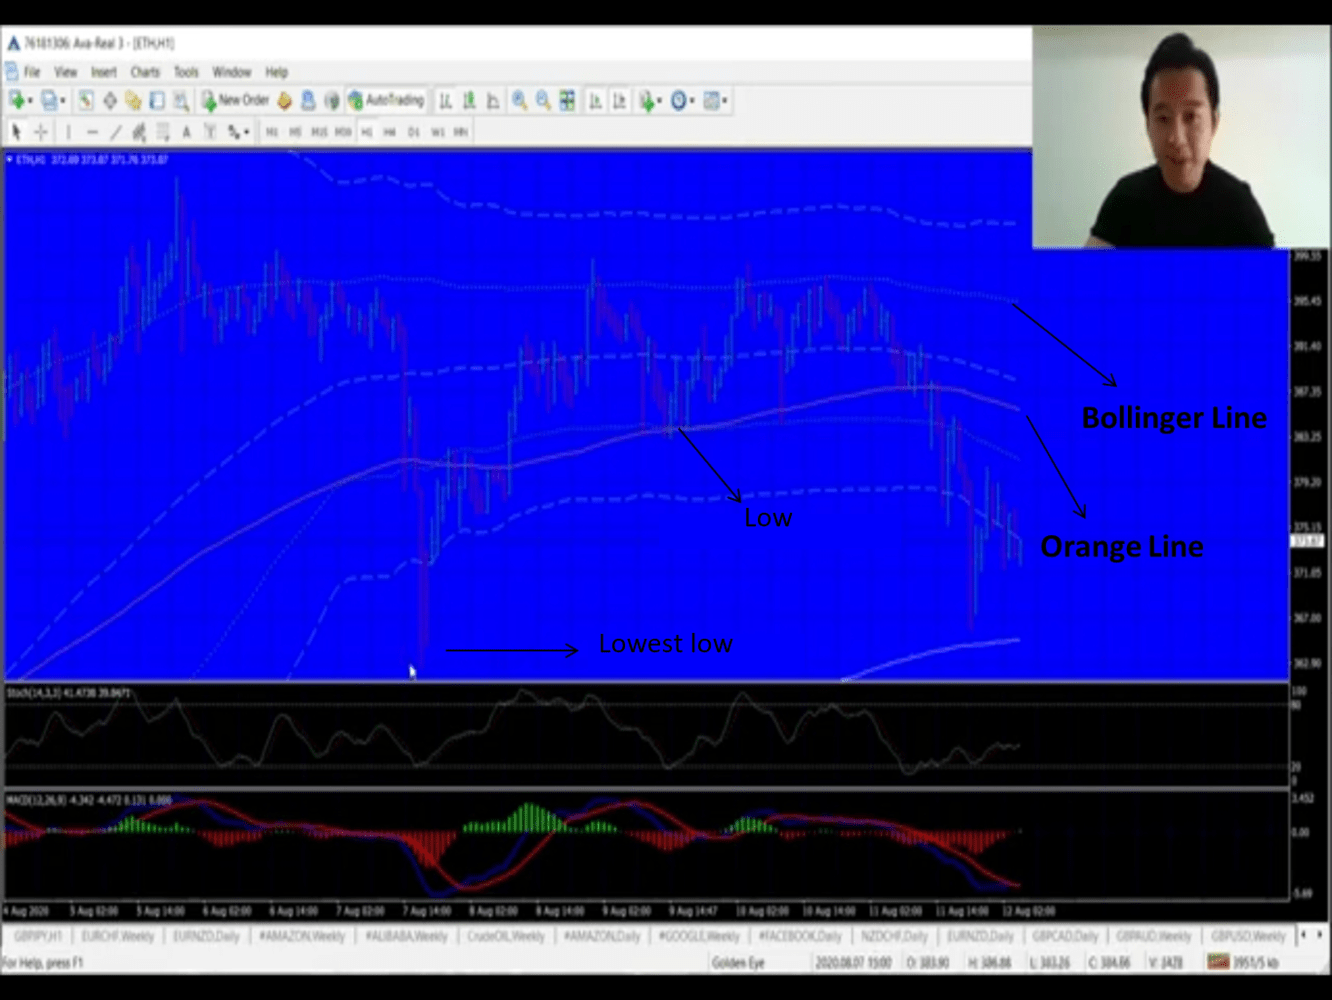
Figure 5 Ethereum chart showing Bollinger band and other points
So therefore, considering where the price currently is, you may not want to sell right now if you’re looking for a breakout trade. This is because it is currently showing signs of weakness. So, before you sell, you may want to wait a little bit for price to go back up to around the orange line (the upper low-points) before selling. So for now, you should not sell because it may retrace back upward. Normally, you do not want to sell when it is showing signs of weakness. You don’t want to sell at the low, especially when it is showing signs of weakness. However, when it has gone way beyond previous lows or has even passed beyond the 365 Moving Average below, then at that point, you may want to sell quickly because that indicates it may break out below and crash really low.
If it breaks out below, where will it go?
How to read the charts in forex trading like a pro
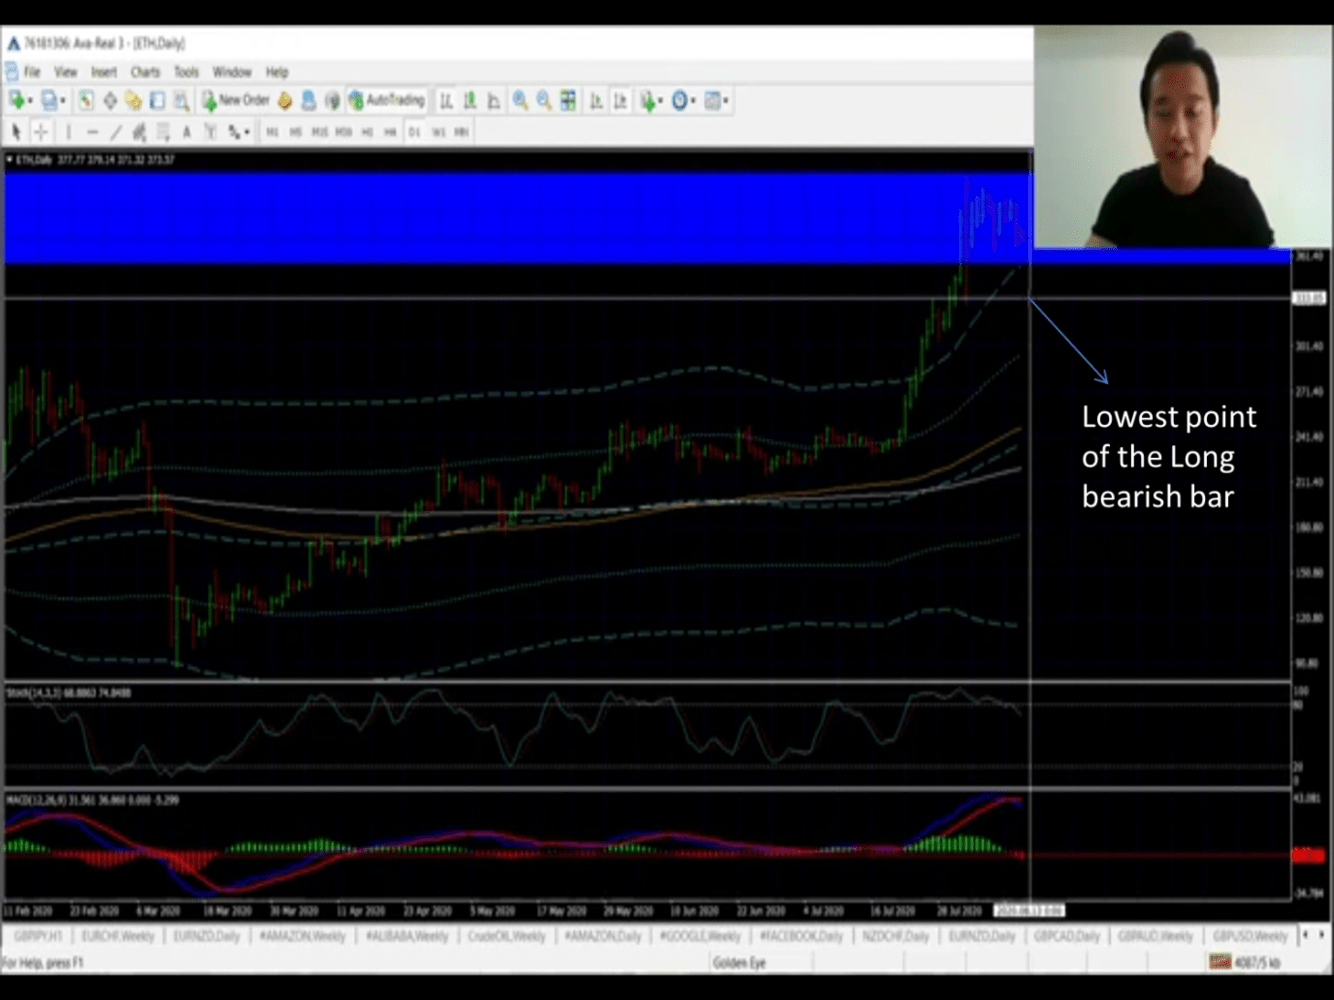
Figure 6 Chart showing the lowest point of the long bearish bar.
Looking at previous times, we can find a similar situation to the current case. Around the point where a major breakthrough upward – above the dividing zone started, we see a similar case. What happened there was that we see the price – within the dividing zone – testing upward several times. There is a long bearish bar, it tests and falls several times to break through above. So it consolidated sideways before finally breaking up above the dividing zone. Similarly, at the current point, we see a long bearish bar testing and consolidating sideways. If in any case it drops, it may drop very low and breakout of the dividing zone below. It may first drop to the lowest point of the long bearish bar or it may drop lower. The lowest point of the long bearish bar could be the first stop before it goes back up to break through. The second stop that it can crash to can be a little bit farther down. Looking at the chart as a whole, we see that the trends hardly go below the 365 Moving Average line. Once, it breaks through it above, it generally tends to go in an upward trend continually. So, the 365 Moving Average is a major rejection level. So, if price comes down, it may fall to the first stop or to the 365 Moving Average (which is currently around the 290 mark). All of these are what to consider in analysing the charts before making a move while trading.


