👋 Hey, what’s up traders! Ezekiel Chew here, and today, we’re unlocking the real power of the ATR (Average True Range) indicator.
Let me ask you something:
👉 Are you just watching the ATR line move up and down, thinking it’s just about “market strength”?
If so, you’re missing the whole picture.
✅ ATR is way more than a volatility meter
✅ It can help you catch explosive breakouts before they happen
✅ It’s one of the best tools to place smart stop-losses that actually protect your trades
If you’re ready to stop trading blind and start trading like a pro, this is for you. Let’s go. 🚀
Or, you can watch the full breakdown in this video:

What Is ATR and Why Should You Care?
ATR isn’t just a squiggly line on your chart. It’s your market volatility radar.
📊 Here’s the breakdown:
-
ATR shows how much price is really moving, not the direction, just the size of the moves
-
It’s based on the average range of the last X candles (default = 14)
-
Bigger candles = higher ATR (more volatility)
-
Smaller candles = lower ATR (calm markets)
💡 Think of ATR as the heartbeat of the market. It tells you if the market is active or chill, so you can trade accordingly.
But here’s the kicker: it doesn’t show trend direction.
So, ATR rising ≠ uptrend. ATR falling ≠ downtrend.
It just tells you how wild the ride is, not where it’s going.
How to Use ATR to Catch Big Breakouts
Let’s get to the good stuff.
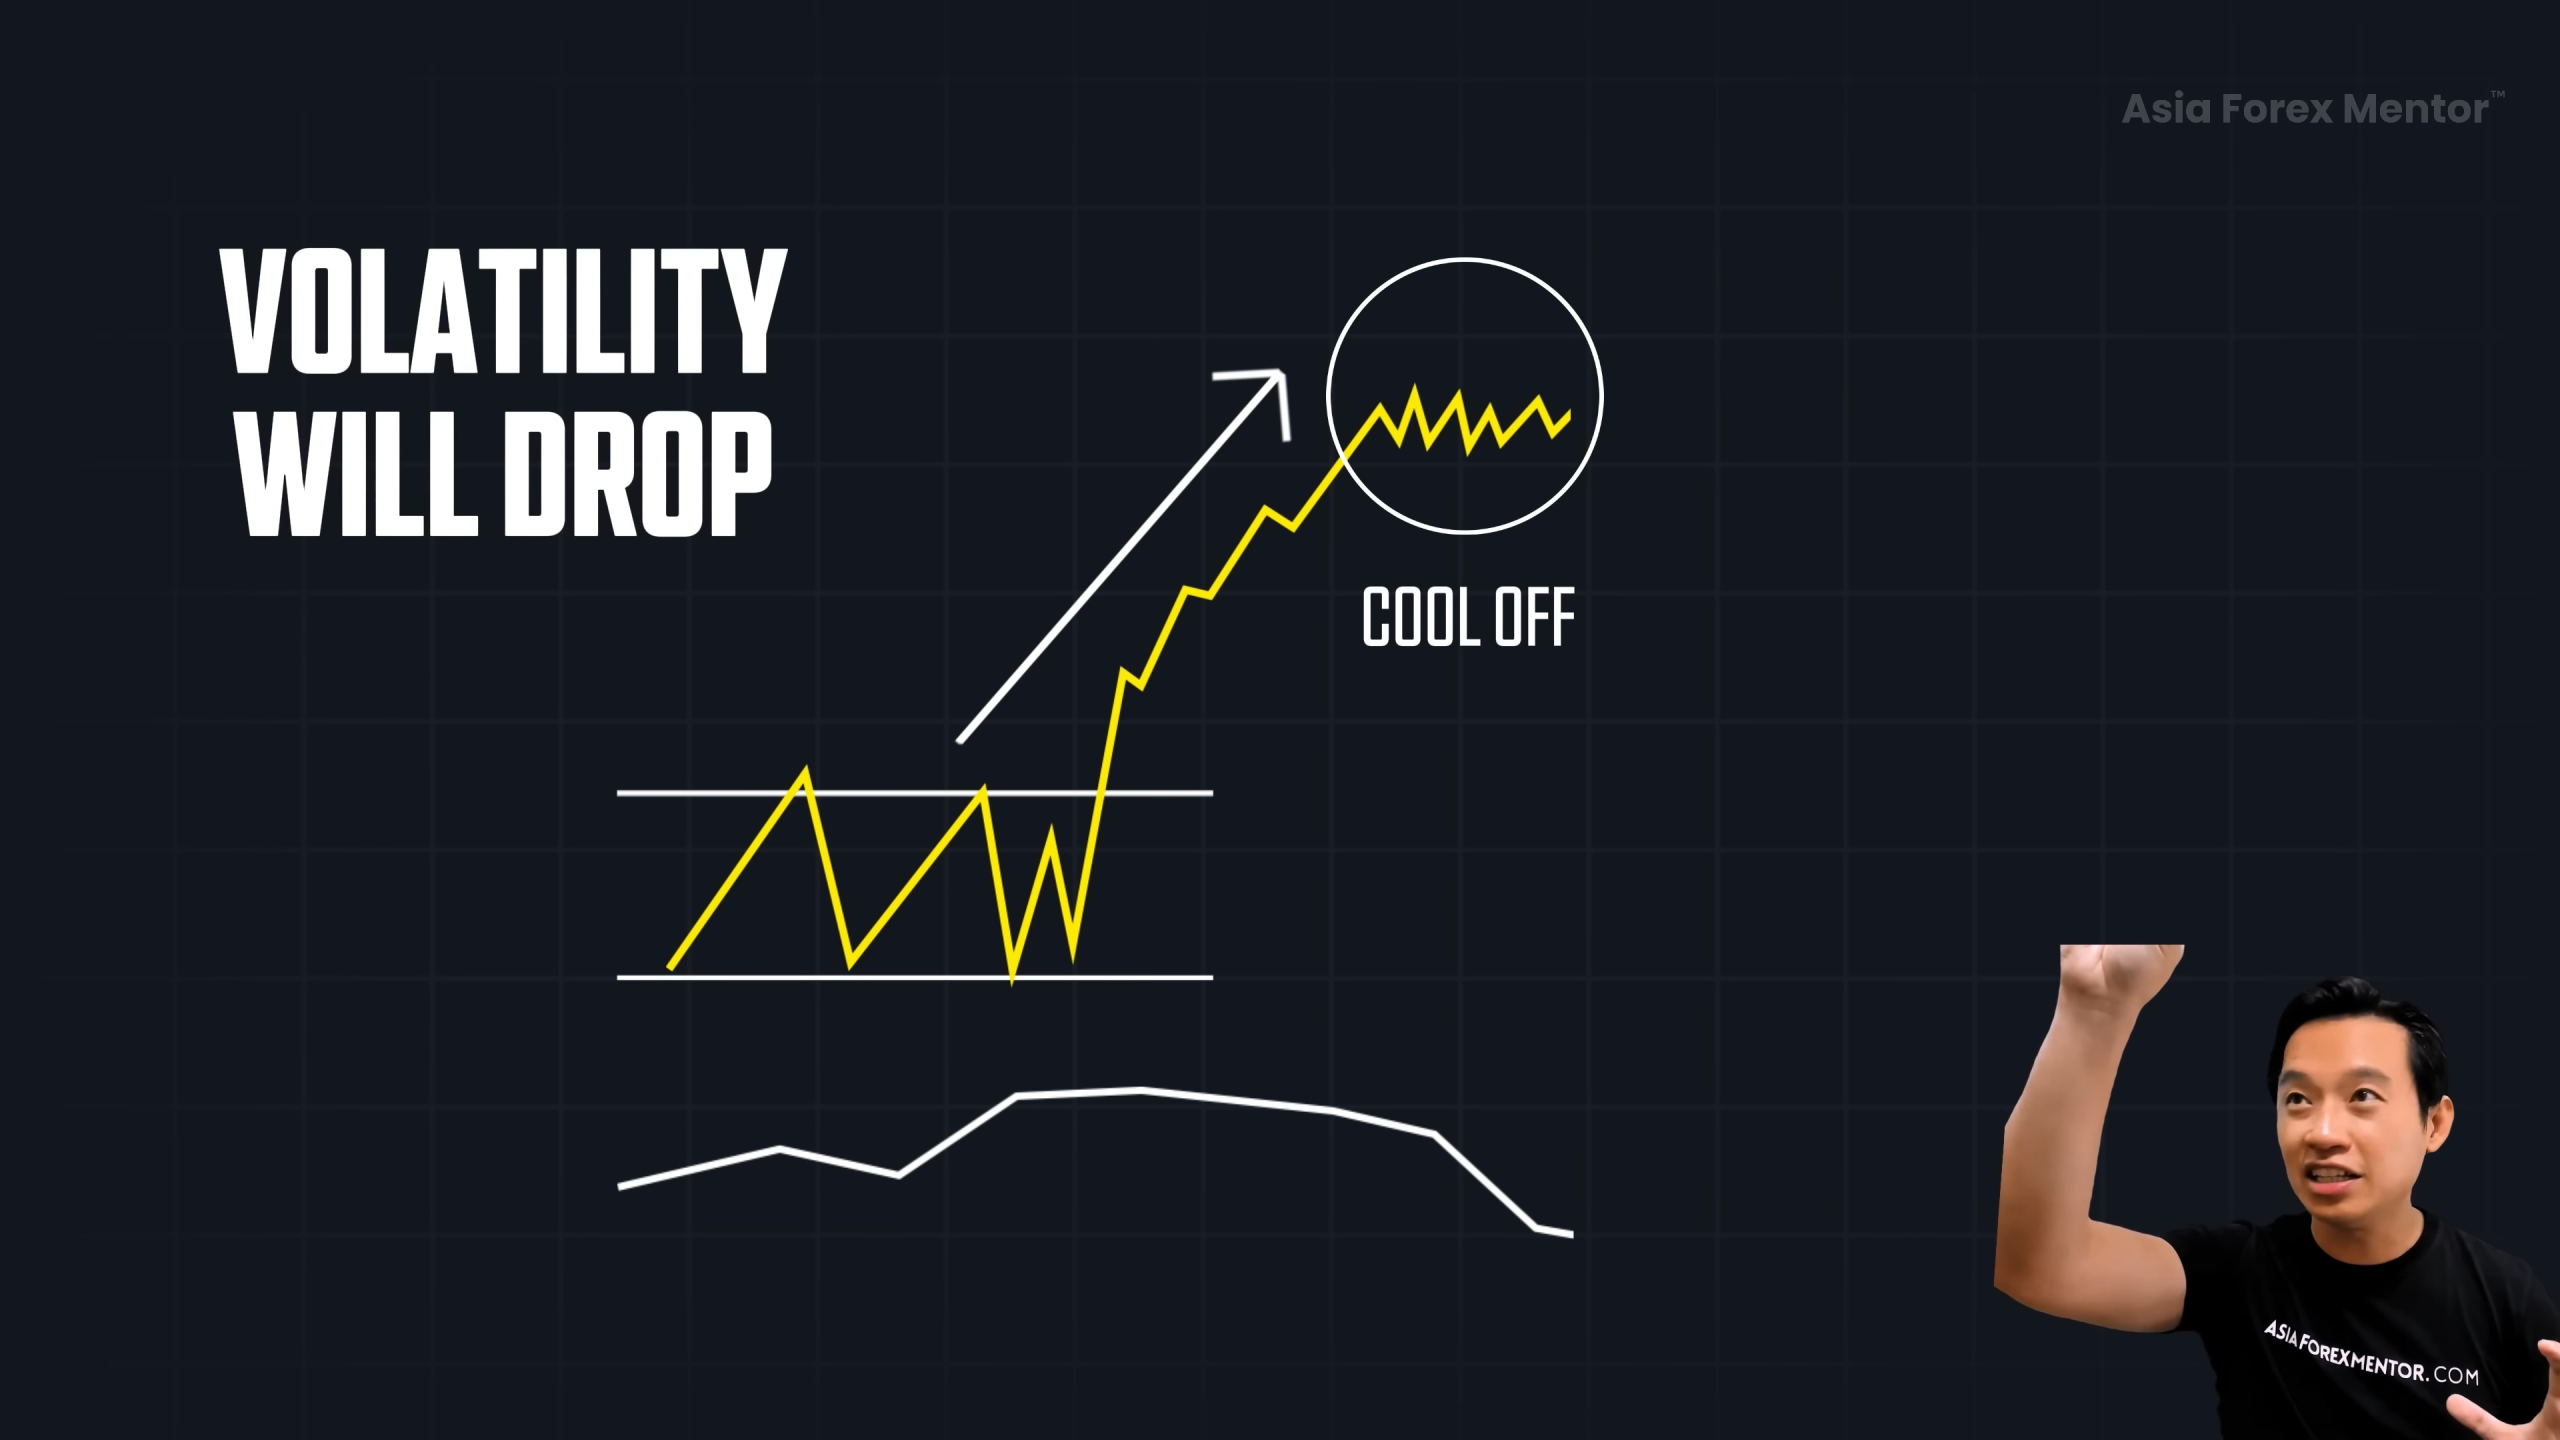
Markets don’t move in straight lines. They move in waves. 🌊
Here’s what usually happens:
-
Market pushes hard 📈
-
Traders take profit, things cool off 😴
-
ATR drops as volatility slows
-
BOOM! The next big move hits 💥
🎯 Low ATR = calm before the storm
That’s your early signal. The market is loading up energy for something big.
✅ Watch for:
-
Multi-year ATR lows on higher timeframes (like the weekly)
-
Key levels forming during low volatility
When everyone else is asleep, you’re already in position. That’s how smart traders win.
ATR + 1.5X Rule = Your Reversal Alert System
Here’s a killer strategy most traders don’t know:
When price moves 1.5x the ATR into a key support or resistance level…
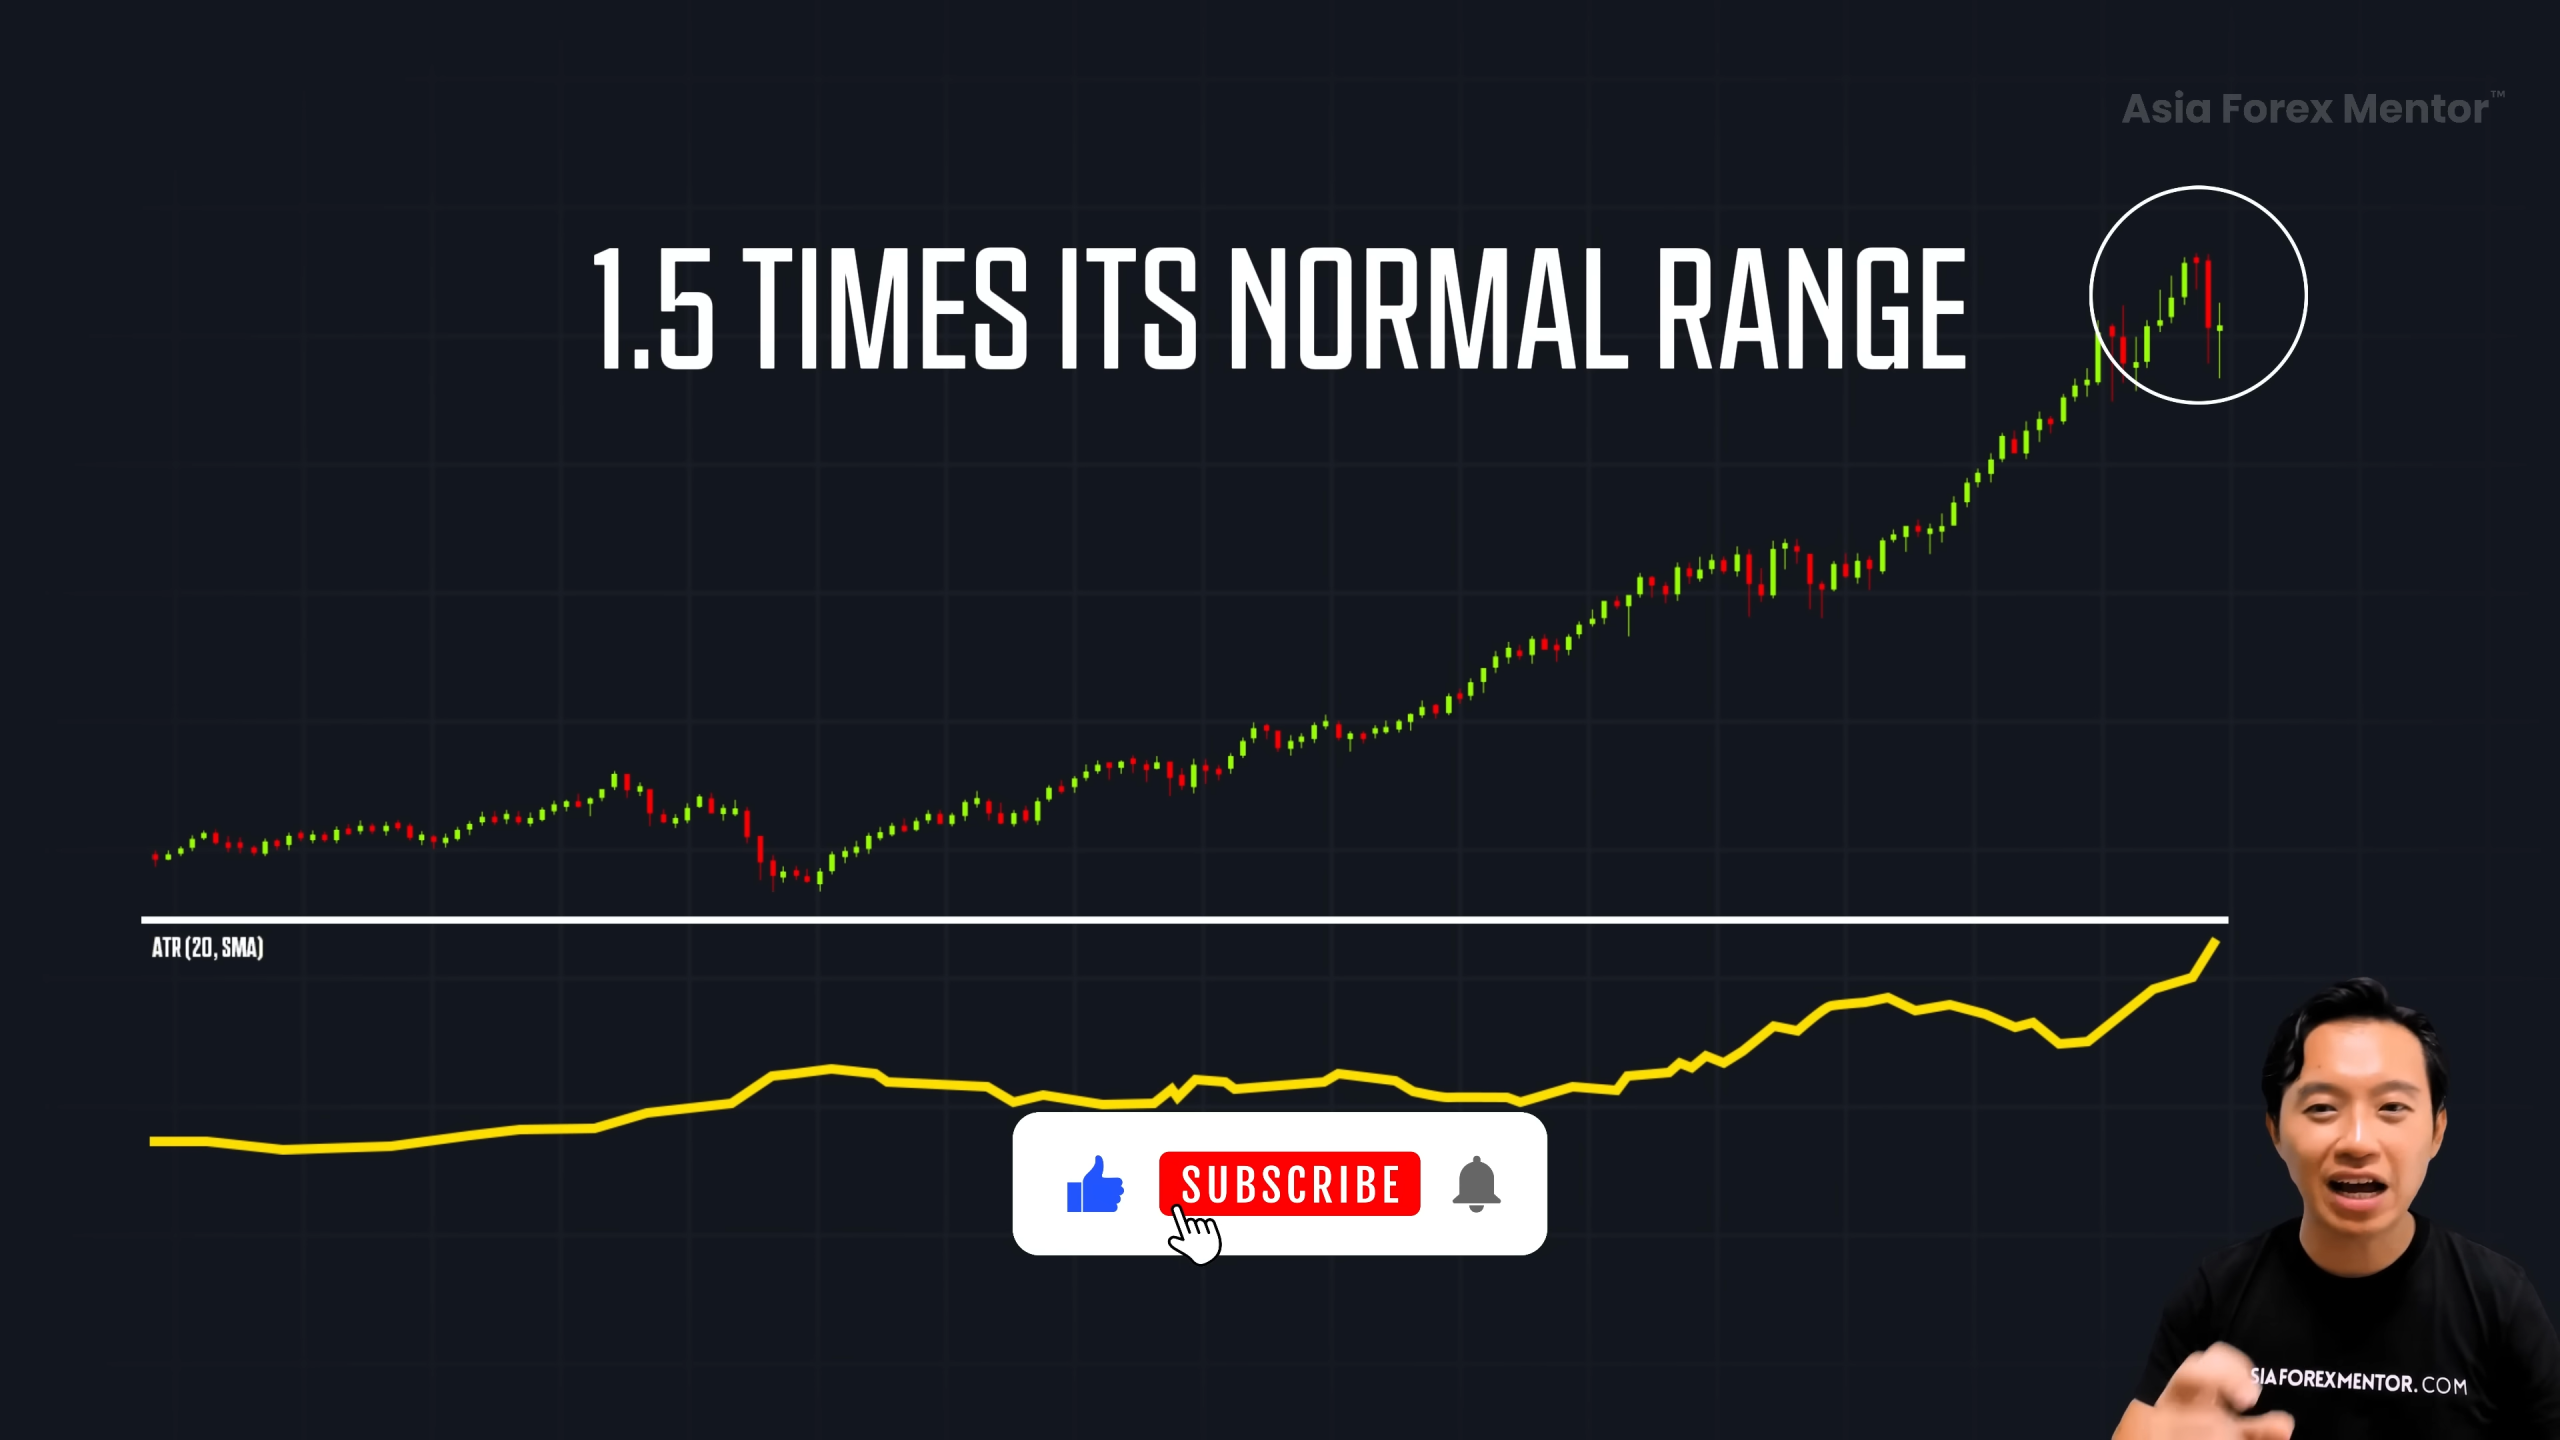
⛔ The market is likely exhausted
📉 A pullback or full-blown reversal could be coming
Think of it like a sprinter who’s run too far, too fast. Eventually, they need to slow down.
🔎 Example:
-
If a pair normally moves 400 pips/month
-
And now it just ran 650 pips straight into resistance
-
That’s 1.5x its normal range = major red flag for exhaustion
This is your moment. You don’t chase the trend. You prepare to ride the reversal.
ATR for Smarter Stop-Losses
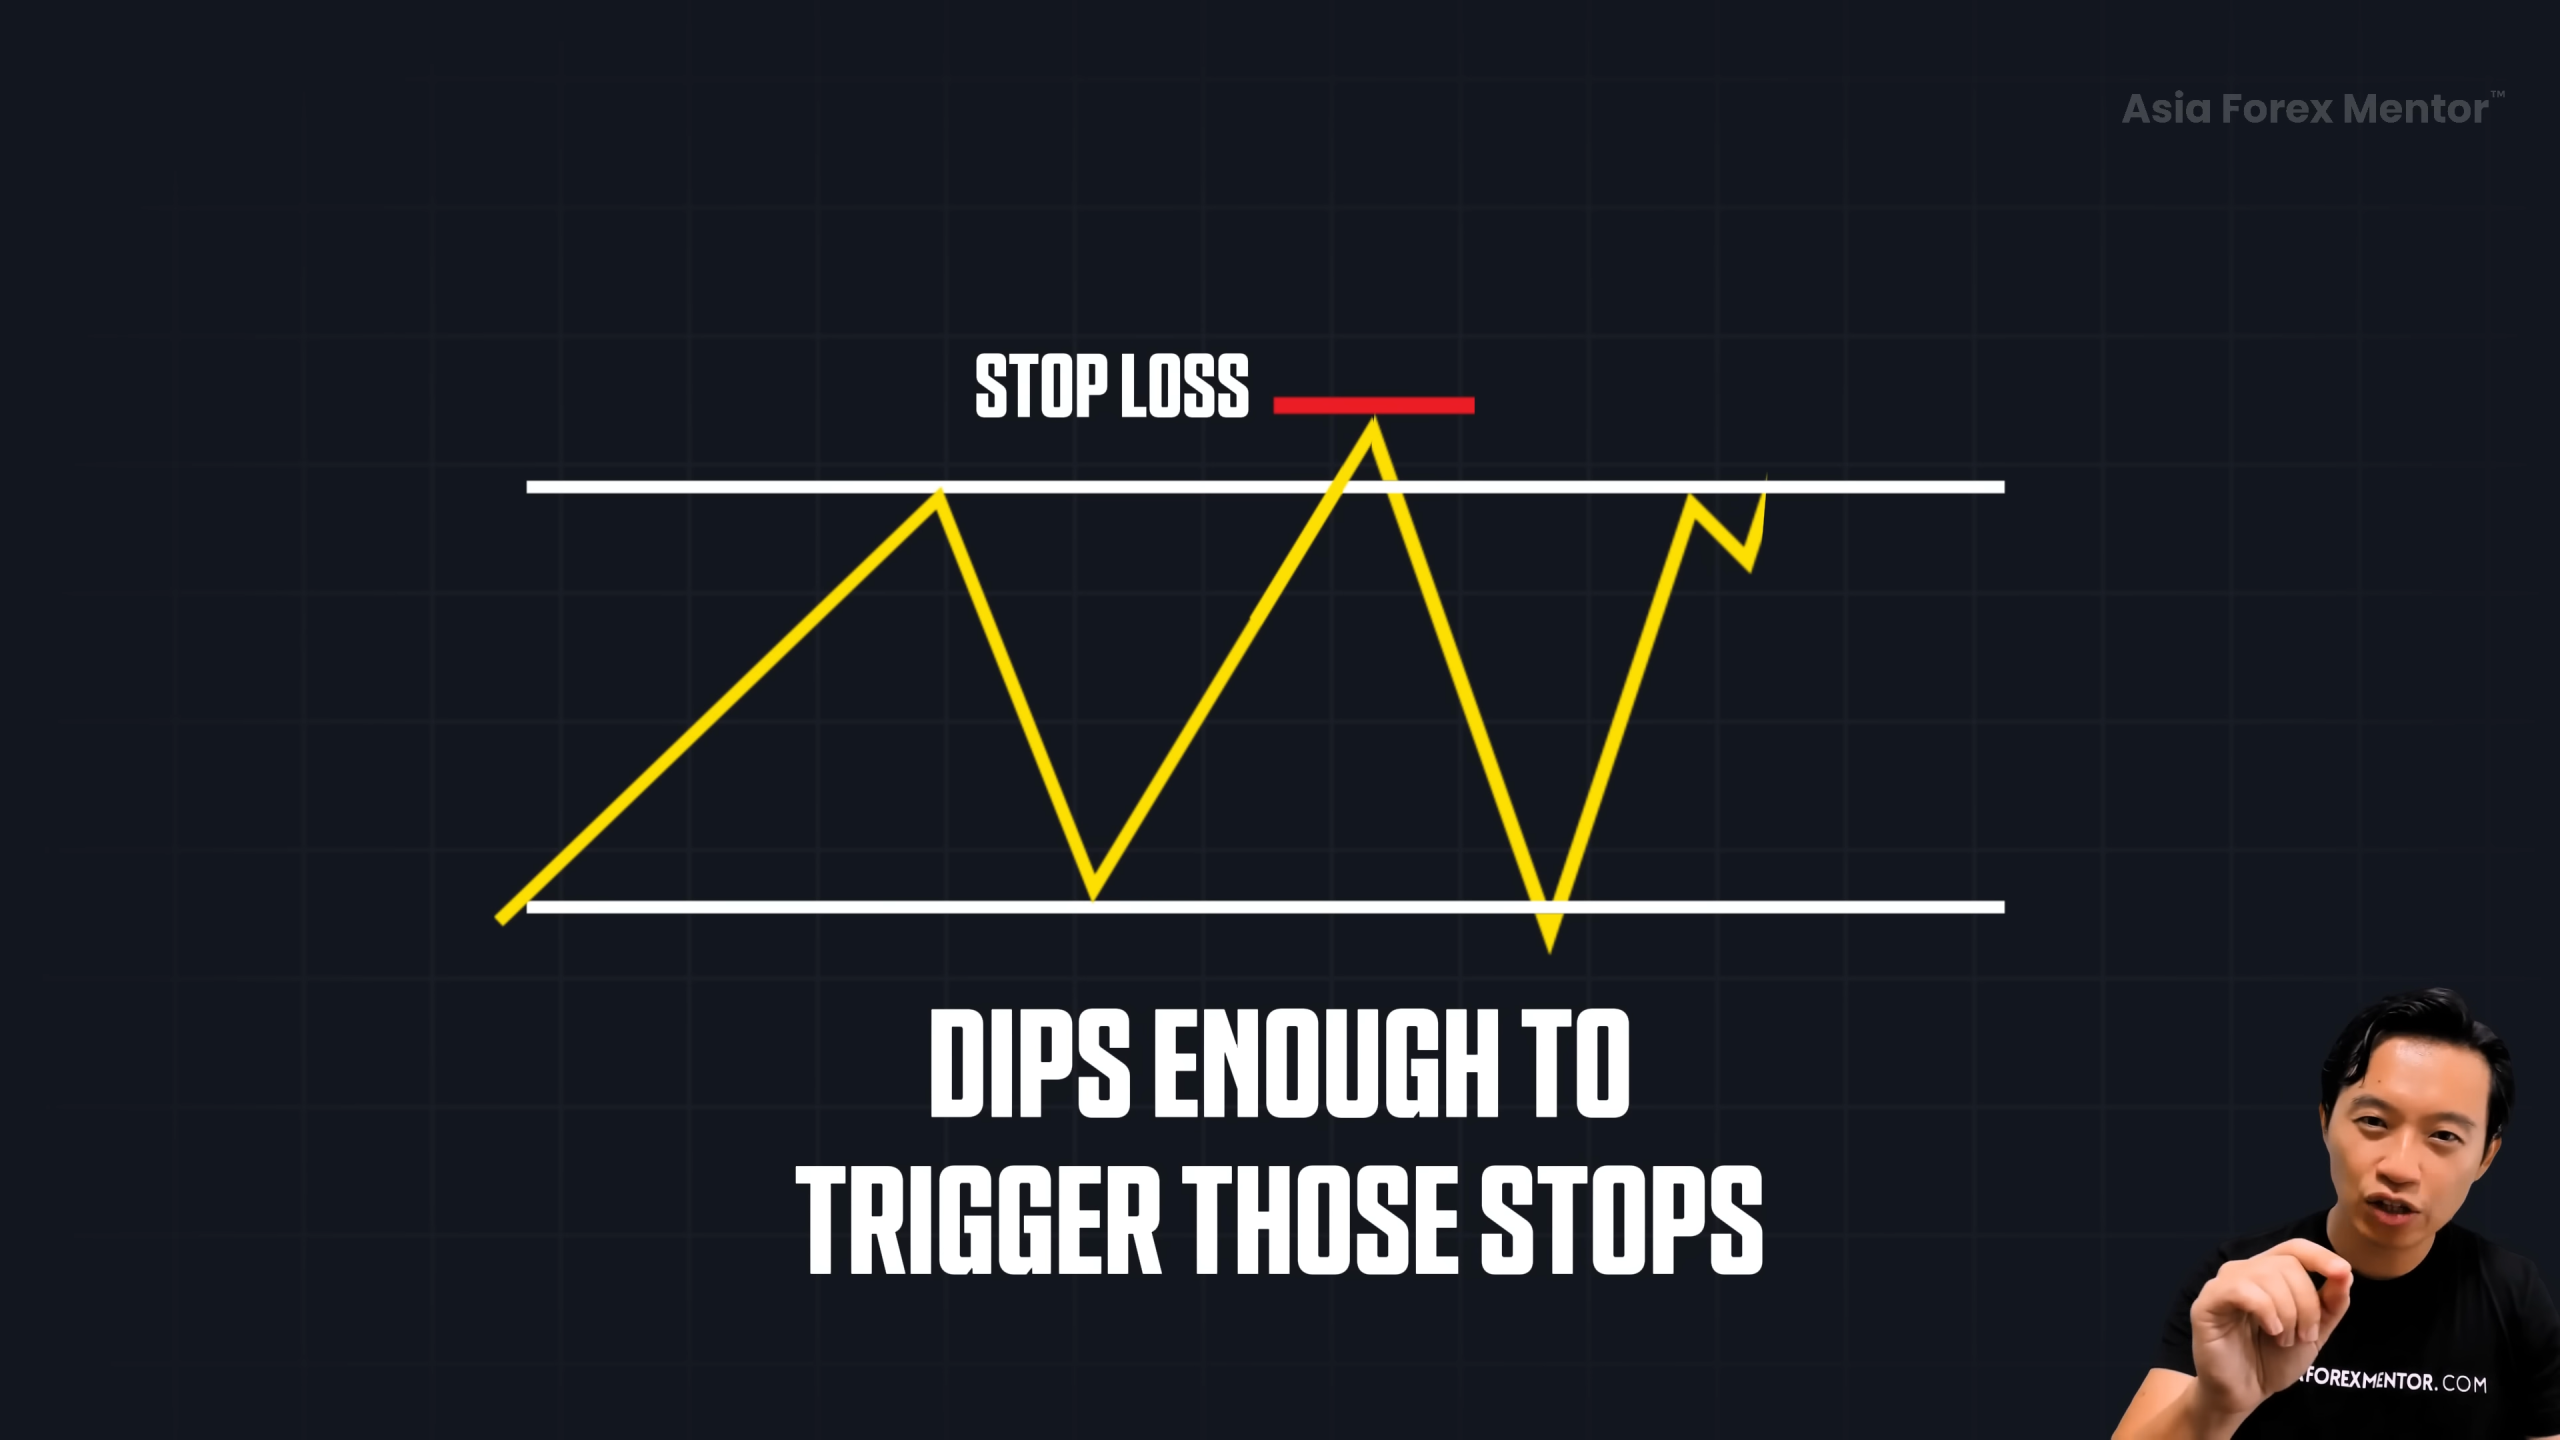
Let’s be real, stop-losses can make or break your trade.
Most traders? They set them at obvious highs/lows.
Result? They get wicked out… and then the market goes exactly where they thought.
Here’s the fix:
🎯 Use the ATR to give your stop breathing room
✅ Stop placement formula:
Resistance high + ATR value = Smarter stop
📌 Example:
-
Recent high: 170.5
-
ATR: 100 pips
-
Smarter stop-loss = 171.5
This way, you’re not an easy target. You survive the noise, and ride the real move.
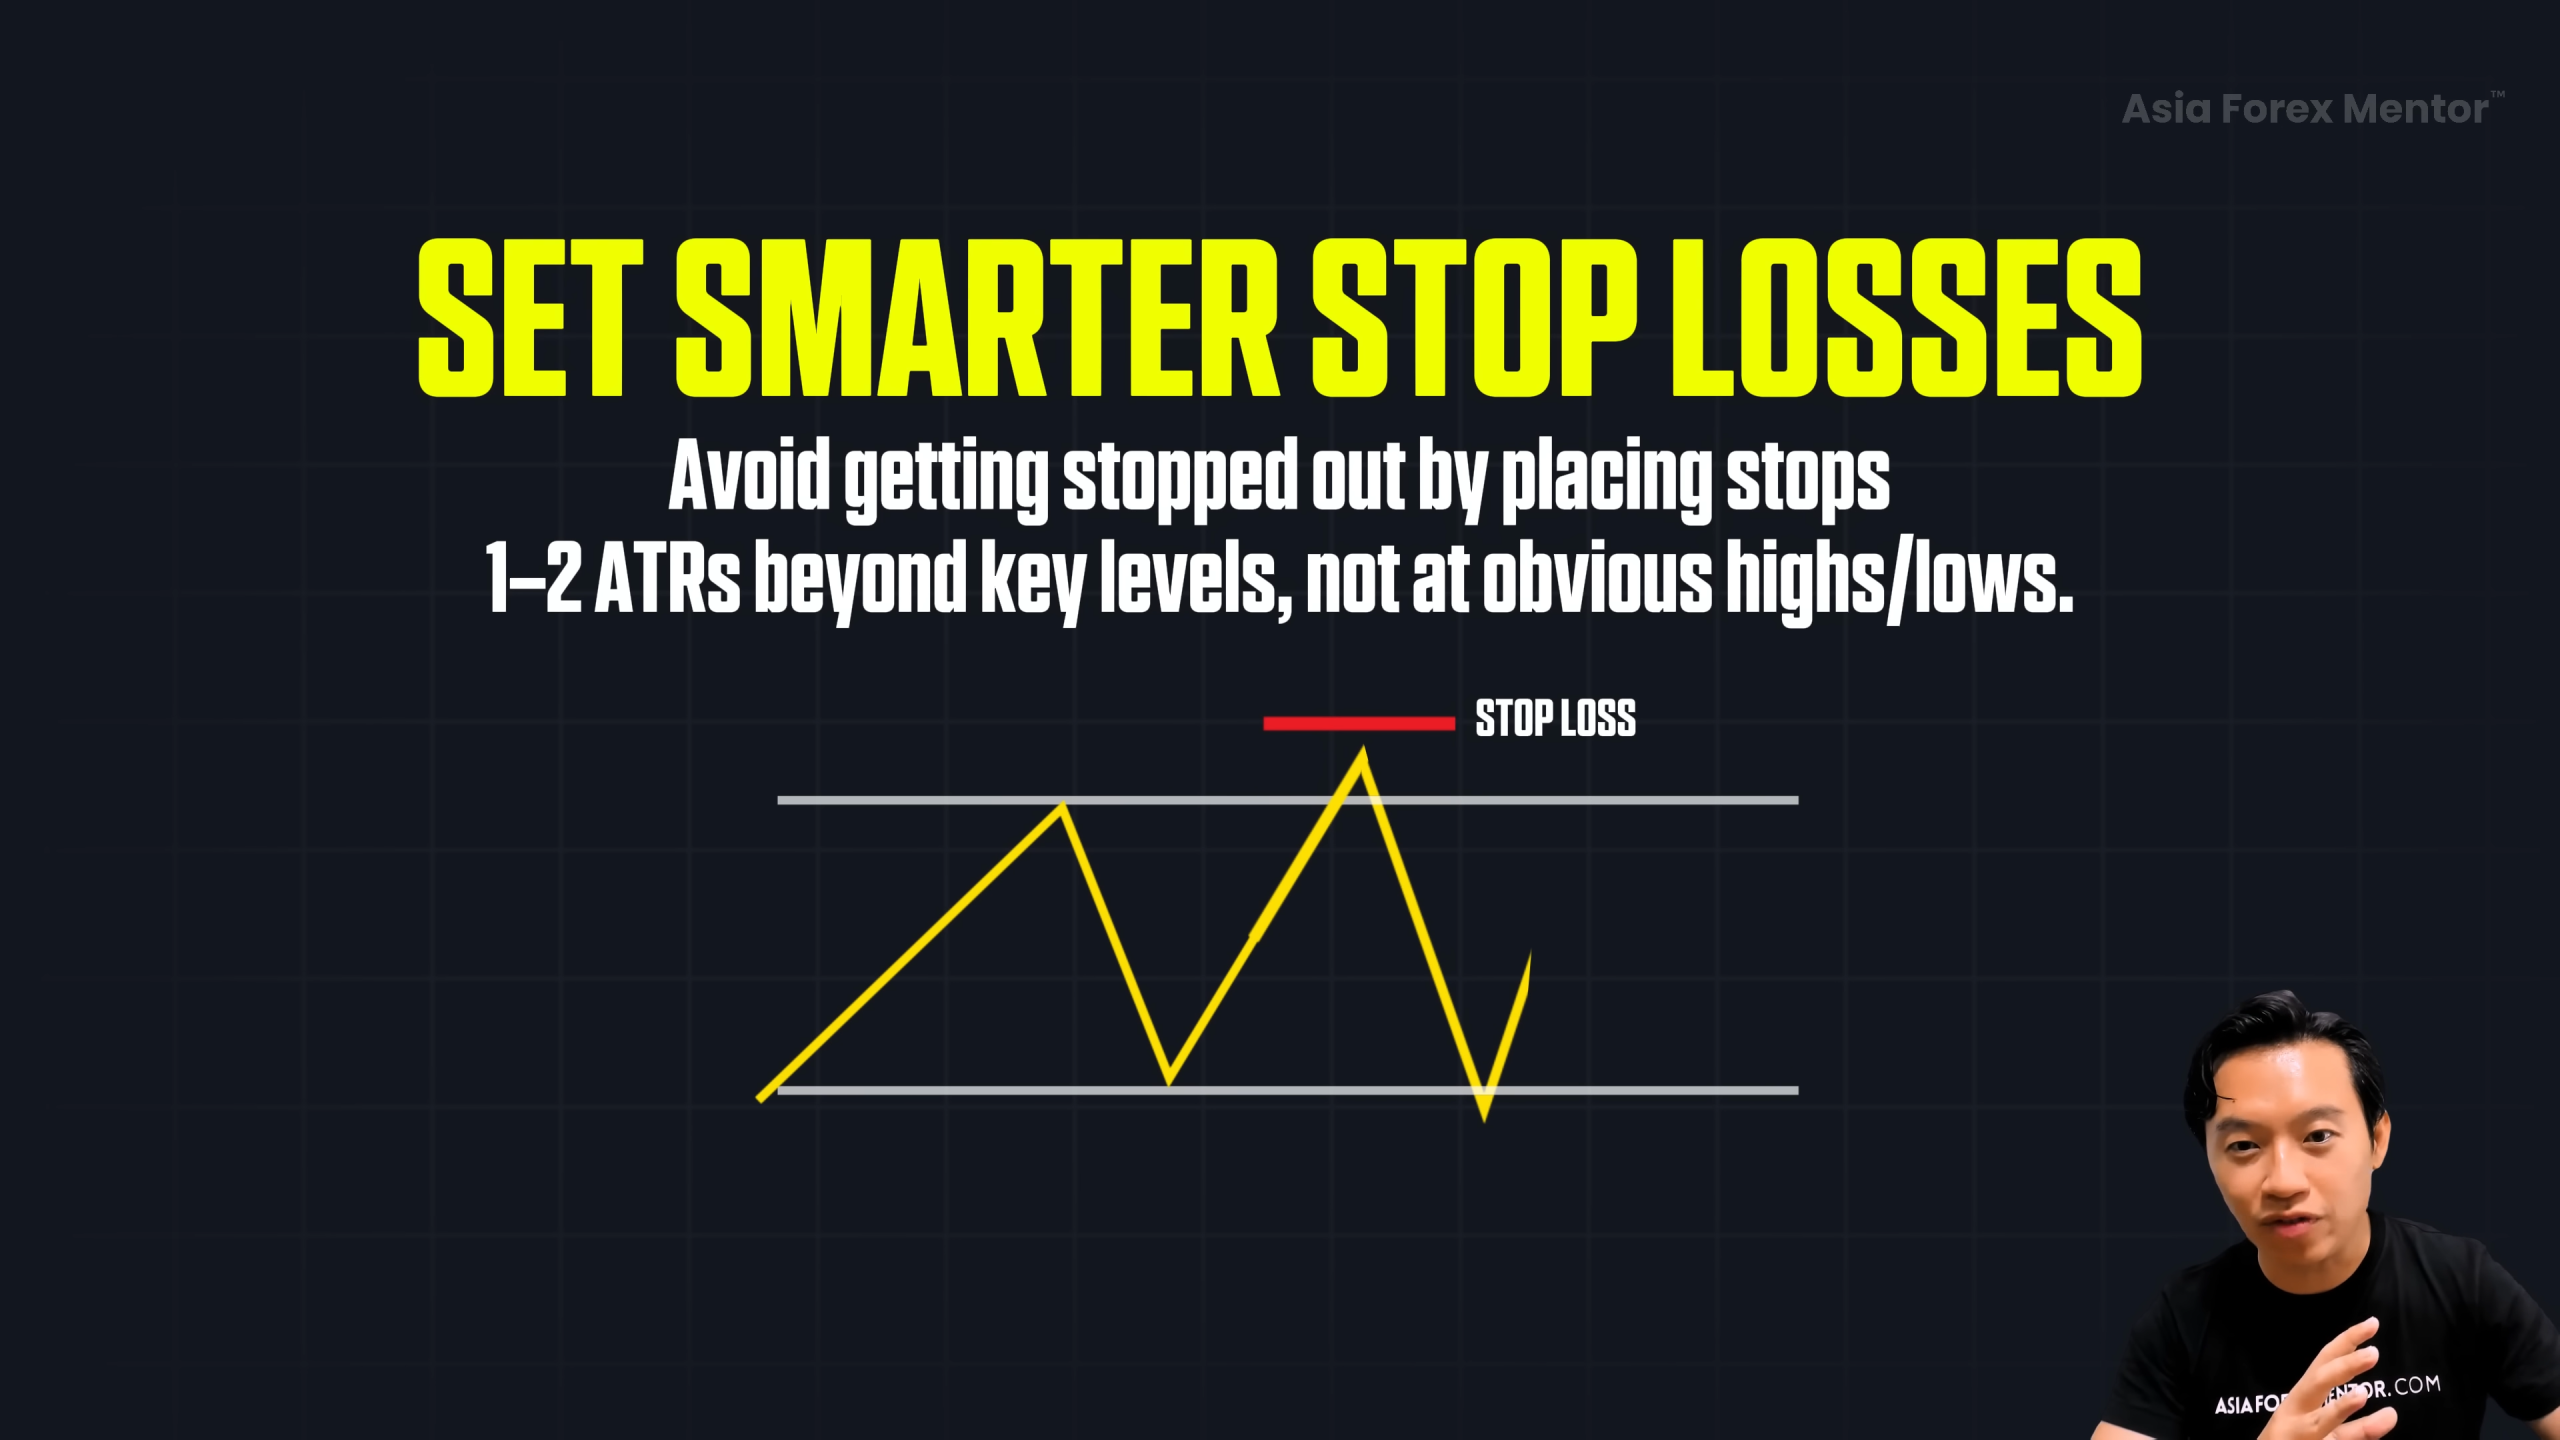
🧠 Bonus tip: Don’t use a fixed stop-loss across all pairs or timeframes. ATR adapts to market conditions, so should your risk.
Final Recap and Thoughts
Here’s the quick-fire checklist:
✅ Use ATR to spot low volatility → get ready for a breakout
✅ Look for 1.5x ATR into key levels → prepare for a reversal
✅ Set stop-losses 1–2 ATR beyond key zones → avoid getting wicked out
📈 When you understand what ATR is really telling you, you stop trading noise, and start trading strategically.
This tool isn’t just for watching volatility.
It’s for predicting moves, managing risk, and trading like a pro.
If this guide opened your eyes to how powerful ATR really is and want to go even deeper, I’ve got a free 5-part training where I break down how I trade with my lifestyle strategy.
Until next time! Stay sharp, stay prepared, and trade smart. 🙌
FAQs
Can I use ATR on any trading instrument?
Yes, absolutely. Whether you're trading forex, stocks, crypto, or commodities, ATR works across the board.
As long as there's price movement, ATR helps you measure volatility and adapt your strategy accordingly.
What’s the best time frame to use ATR on?
It depends on your trading style.
-
Swing traders: Use ATR on the daily or weekly charts to spot big-picture volatility and trend exhaustion
-
Day traders: Focus on 15M to 1H charts, but always cross-check with a higher time frame like 4H or Daily
📈 Tip: The higher the timeframe, the more reliable the ATR signals.
Is a rising ATR always a good thing?
Not necessarily.
A rising ATR means volatility is increasing, but it doesn’t tell you the direction.
You still need to combine ATR with:
✅ Price action
✅ Support/resistance
✅ Candlestick patterns
💡 ATR tells you how fast the market’s moving, not where it's going. That’s where your technical analysis comes in.


