
The KDJ indicator hides in plain sight, but what if this quiet tool is the key to decoding chaotic price swings?
Unlike other momentum indicators that lag behind, the KDJ reveals subtle shifts in price trends through its three lines: K, D, and J. These lines help spot overbought and oversold conditions before most traders even notice the change. When they cross, they whisper early buy or sell signals that can make or break a trade. In volatile markets , this simple yet sharp indicator can be a trader’s best guide for short-term trend analysis and timing precision.
What is the KDJ Indicator?
The KDJ indicator is a technical indicator designed to track momentum and predict reversals in market trends. It builds upon the stochastic oscillator but adds a unique component called the J line, which serves as a directional sensitive line. The K line and D line form the foundation, while the J line highlights sharp movements in price fluctuations. Together, these three lines help traders recognize when the stock price may be nearing overbought or oversold zones.
Each line carries meaning in KDJ trading. The K value reacts quickly to changes in the closing price, while the D value smooths the motion for clearer trends. The J value, however, extends beyond the usual range of 0 to 100, signaling stronger bullish or bearish momentum. When these lines cross, traders can identify potential buy and sell signals or prepare for a golden cross or death cross. By reading these line crosses carefully, investors can confirm trends, manage risk, and detect fewer false signals in both the stock market and futures market.
The Role of J Line
The J line is the heart of the KDJ indicator, revealing what the k and d lines often miss. It measures the gap between k and d values, showing when buying pressure or selling pressure starts shifting. When these lines converge, it often signals a possible change in direction and a potential trading opportunity.
In technical analysis, this line acts like a mirror reflecting the market’s rhythm. When the line rises above the overbought zone, it may indicate bullish signals or even a short term peak before prices fall. When the line falls below the oversold zone, it hints at a rebound imminent or a possible bullish signal forming. The default overbought and oversold levels are commonly called 80 and 20, but adjusting them for a specific period can help reduce false signals and fine-tune your investment strategy.
What Is a Stochastic Oscillator?
The stochastic oscillator is a momentum indicator used to measure how strong or weak a price movement is. It compares the closing price of an asset to its highest and lowest price over a certain period. This helps traders identify when a market may be overbought or oversold.
When the lines rise above 80, it may show that prices are nearing an overbought zone. When the lines fall below 20, it could signal oversold conditions or a possible rebound. Traders often wait for line crosses between the two levels to spot early buy or sell opportunities.
The stochastic oscillator’s smooth movement makes it easy to read, even for beginners. It acts like a foundation for the KDJ indicator, which adds the j line for better precision. Together, they help traders understand market momentum and make more confident trading decisions.
KDJ Trading Indicator for Forex and Crypto
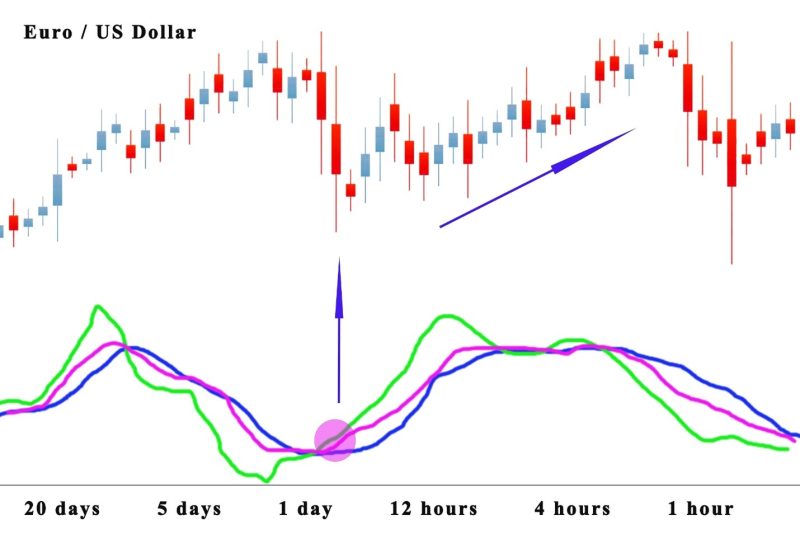
The KDJ trading indicator works across all markets without changing its calculation method or settings. It can be used for day trading, swing trading, or even longer time periods. However, traders must adjust their interpretation depending on the type of asset and market behavior. Each market has unique patterns, so understanding these nuances helps reduce confusion and improve accuracy.
When prices rise and the indicator moves above 80 or even close to 100, it doesn’t always mean a sell signal. In strong uptrends, overbought and oversold signals may appear several times before a real reversal occurs. The same happens when prices fall during a downtrend. The kdj line follows the principles of the stochastic indicator, providing insight into momentum and helping traders identify better exit points. Still, it should always be used with other indicators or moving averages to confirm trends and avoid false interpretations.
How to Prevent False Signals with KDJ
Step 1: Start by Analyzing the Signal Line Carefully.
Begin by checking how the signal line reacts to recent price changes. When the line breaks above or below, it hints at momentum shifts. Always wait for confirmation before assuming a buy signal or bearish signal.
Step 2: Compare the KDJ Readings with the Highest and Lowest Price Levels.
The indicator is calculated based on how far the closing price moves within a certain period. When the stock price breaks its recent range, it strengthens the reading. This helps identify whether bullish momentum or bearish divergence occurs.
Step 3: Watch How the KDJ Reflects Market Strength.
When identifying overbought conditions, note how the line moves near extreme levels. A sudden drop often signals weakening buying pressure. This simple observation can prevent misreading an overbought signal.
Step 4: Confirm with Other Technical Tools Before Acting.
Combine KDJ with moving averages or RSI for stronger confirmation. When bullish divergence appears on both, the setup becomes more reliable. This step filters out false readings and improves trade accuracy.
Step 5: Be patient when price direction seems unclear.
Sometimes, a false buy signal appears before the real move begins. Wait for the next line breaks or crossovers to confirm strength. Patience protects your trades when uncertainty clouds the chart.
Very Practical Technical Indicator
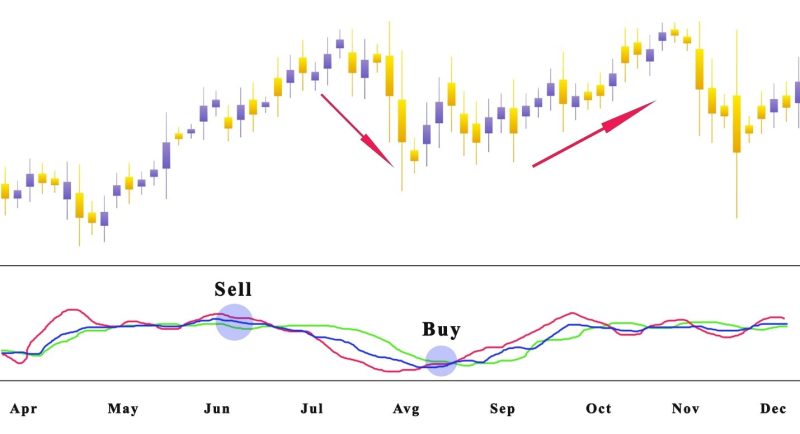
The point of crosses of the KDJ curve is branches out in two formations the golden cross and the death cross. When the golden cross forms it’s an indicator to buy, and the death cross is the sell signal. Typically, in an uptrend and downtrend, the signal line of the KDJ indicator will form two or more golden crosses and death crosses.
If the stock price goes through consolidation, and under the 50 line, when the J line and the K line simultaneously crack the D line. There is a signal that the stock market is gaining strength and the price declines, then the trend is over.When the decline comes to a still and starts going upwards, many traders interpret it as a buy signal. This is a form of the KDJ indicator golden cross.
If the stock price climbs consistently in the previous period, and the traded assets price rises when the J line and the K line simultaneously go through the D line. It signals that the stock market is gaining strength. Turning to a weak position the stock trends price will fall sharply. Most of the stocks should be sold instead of buying stocks. This is a form of the death cross of the KDJ indicator.
Also Read: What Is The TRIX Indicator?
Conclusion
The KDJ indicator is more than just lines and numbers, it is a guide for understanding how markets truly move. It helps traders spot overbought and oversold conditions before major price changes begin. By watching how the k and d lines react, traders can find early buy or sell signals with more confidence.
However, no technical indicator works perfectly on its own. The KDJ reflects momentum but still needs confirmation from other tools to avoid false readings. Combine it with moving averages or volume analysis to confirm trends and refine your timing. With patience, discipline, and practice, this indicator can turn uncertainty into a clear investment strategy.
FAQ's
1. How do you read the KDJ indicator?
Reading the KDJ indicator starts with observing the k, d, and j lines. When the k line crosses above the d line, it often signals a possible buy signal. When the j line moves sharply down, it can suggest a bearish signal or selling pressure.
2. What is a good setting for the KDJ indicator?
The default setting usually uses 9 for the period and 3 for the smoothing values. This setup helps balance quick reactions with fewer false signals. Traders can adjust these settings depending on the market’s volatility and their preferred trading style.
3. Can beginners use the KDJ indicator effectively?
Yes, beginners can use it as long as they keep things simple. Focus first on how the lines cross and react to overbought or oversold zones. With time and practice, it becomes a valuable tool for spotting early market trends.


