

The momentum indicator that calculates the flow of money over a specified time, into and out of a security is known as the Money Flow Index. It analyzes both volume and price to measure the purchasing and selling pressures in a market. Investors use the indicator in their trading strategies.
The money flow index generates a value on a scale from zero to 100. This is why it is also called an oscillator. The number at the end of the calculation is placed on this scale to provide oversold and overbought signals. If the reading is above 80, then the market is considered overbought. While a reading under 20 is an indicator of oversold conditions.
Contents
- Taking Advantage of the Momentum
- Why Traders should use the Money Flow Index?
- The Typical Price is Calculated
- The Positive Money Flow and Negative Money Flow are Calculated
- The Money Flow Ratio is Calculated
- Calculate the Money Flow Index
- Money Flow Index Signals
- Conclusion
- FAQ
Taking Advantage of the Momentum
The idea behind the Money Flow Index is that when the previously mentioned levels are met, the market price may backpedal. Traders need to take advantage of the momentum and open a position.
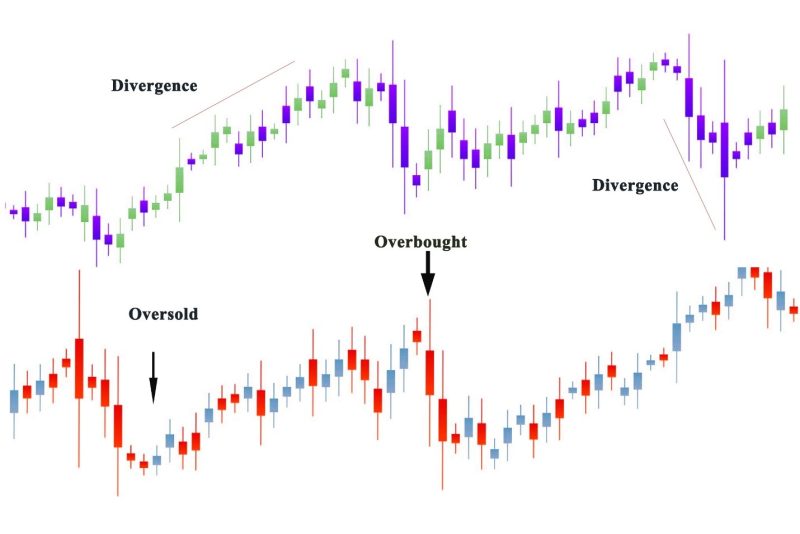
It is crucial to look out for, where the money flow index and the price of an asset are giving out contradictory signals. This is known as a divergence. A bearish divergence happens when the price is climbing to new highs, but the MFI isn’t keeping up with the new levels. It signals upcoming selling pressure. If the price declines to new lows, and the Money Flow Index is not keeping up with that movement, it can be a signal of buying pressure. But also, bullish divergence.
You should keep in mind that divergence does not always end in a reversal. The Money Flow Index may show false signals. These occur when the indicator presents a solid trading opportunity. Still, the market price does not move as anticipated. This can cause unplanned losses if a trader has not used the correct risk management strategy.
Why Traders should use the Money Flow Index?
The money flow index can help traders recognize reversals when oversold and overbought indicators are revealed. It can be a measure of the market sentiment about an asset because it detects trader eagerness or indifference of traders.
The MFI is perceived as a leading indicator, just like other tools for analyzing volume. That’s why it can be used to forecast movements in the market. It is good to remember that leading indicators are not precise. They should be used in tandem with other forms of analysis. As well as a proper risk management strategy.
The Typical Price is Calculated
When calculating the typical price for each trading period, you need to find the average of the high, low, and closing prices. The calculations would be:
Typical Price = (Low + High + Close) / 3
Calculating the Raw Money Flow
The raw money flow is the estimation of how much capital was flowed in the market in a specific period, no matter if it was for buying or selling an asset. The calculation is done by multiplying the typical price with the volume for that period.
Raw Money Flow = Volume x Typical Price
The volume is calculated with the tick volume. It represents the number of price changes over some time. Not every market offers reliable volume reports, that can be used to find data on how many times an asset is purchased and sold.
The Positive Money Flow and Negative Money Flow are Calculated
When you have the raw money flow, you can make out if it is positive or negative. You do this by marking if the raw money flow in a given period is higher or lower than the previous period.
If the typical price is higher for this period compared to the previous period, it is considered a positive money flow. When it is less than the previous price, it is a negative money flow.
The Money Flow Ratio is Calculated
You can calculate the money flow ratio after you get the positive and negative money flows. This is done by adding all of the positive money flows in the past 14 periods. You dividing with the number for the negative flows for the same period.
Money Ratio = 14-period Positive Money Flow / 14-period Negative Money Flow
Calculate the Money Flow Index
When you have the money flow ratio, you can calculate the MFI.
Money Flow Index = 100 – 100/1+money flow ratio
The MFI is going to be positive if the price of the asset has risen in those 14 periods. Signaling buying pressure. If the price has declined it is negative and showing a selling pressure.
Money Flow Index Signals
The three basic signals of MFI are failure swings, divergences, and overbought/oversold conditions.
Overbought/Oversold condition
The security is regarded as overbought if the MFI shows a rapid price rise to a high level. A security is considered oversold when the MFI shows a fast decline in the price to a significantly low level. The overbought and oversold levels are useful in recognizing price extremes.
Conditions of overbought occur if the MFI is above 80. While under 20 MFI indicates oversold conditions. The prices may rise when the upward trend is strong. Then the MFI can rise beyond 80.
The MFI beyond 90 and less than 10 happens rarely. It suggests that a price movement is not durable. Most securities trade don’t reach the price high of the 90/10 level.
If the MFI can go below 20 when the prices continue to decline in the presence of a strong downward trend. When the MFI increases above 90, it is perceived as a truly overbought condition. While below 10 MFI is a truly oversold condition.
Failure swings
Failure swings can result in a turnaround in price. They do not depend on price and rely on the MFI. In failure swings, there are four steps. Both types of failure swing bearish and bullish.
Bullish Money Flow Index failure swing
First: MFI decreases below 20 (oversold)
Second: MFI recovers and rises above 20
Third: MFI decreases but stays above 20
Fourth: MFI shoots above the previous high
Bearish Money Flow Index failure swing
First: MFI increases above 80 (overbought)
Second: MFI drops below 80
Third: MFI slightly increases but stays below 80
Fourth: MFI drops below the previous low
Divergences
Divergence signals occur if the indications from the price action and the MFI are the opposite. The difference in the indications can be regarded as an upcoming reversal. There are two types of divergences:
Bearish Money Flow Index divergence
When the price shifts to a new high and the MFI indicates a lower high. It marks the decrease in buying pressure and the time for the market to be taken over by sellers. This helps sellers to make profits.
Bullish Money Flow Index divergence
It occurs when the price changes to a new low, whereas, the MFI indicates a higher low showing a boost in money flow. It implies that the selling pressure is decreasing, and buyers will be taking over the market. It presents an opportunity of buying securities at low prices.
Conclusion
The MFI is a good indicator, but it can also show false signals. This means that it can decline when the price is rising. This happens when there are divergencies. The best way to circumvent these situations is to combine several analysis tools and technical indicators.
Money Flow Index indicator is a good technical analysis of buying and selling pressure. Trading opportunities using the momentum oscillator can make a big difference in the underlying security.
FAQ
What is a good money flow index?
The Money Flow Index is a technical indicator that creates overbought or oversold alerts using both volume and price data.
Which is better, MFI or RSI?
MFI incorporates volume, something RSI does not. MFI provides lead signals, and warns of possible reversals, in a timelier fashion at times ahead of RSI. Just like the RSI, the value of the MFI ranges between 0 and 100.
Is MFI a leading indicator?
It is considered a leading indicator, like other volume-based indicators it can predict price movement.
What is the best money flow indicator?
Several indicators offer quality results. If you have to choose one On Balance Volume is a simple but effective indicator.


