

Learn To Trade Forex • Best Forex Trading Course • AsiaForexMentor

Home » Forex Blog » NZD/JPY Analysis: Bears Target Key Support Levels

NZD/JPY Analysis: Bears Target Key Support Levels

Updated September 7, 2024

The NZD/JPY pair continues to exhibit a downward trend, extending the decline that began during Tuesday’s trading session. Technical indicators currently favor the bears, suggesting that the pair may experience further losses in the near term.

The Relative Strength Index (RSI) has fallen to 36, nearing the oversold zone. Despite a significant drop of over 3% this week, there is a possibility that the pair may stabilize in the coming sessions as bearish momentum could weaken.
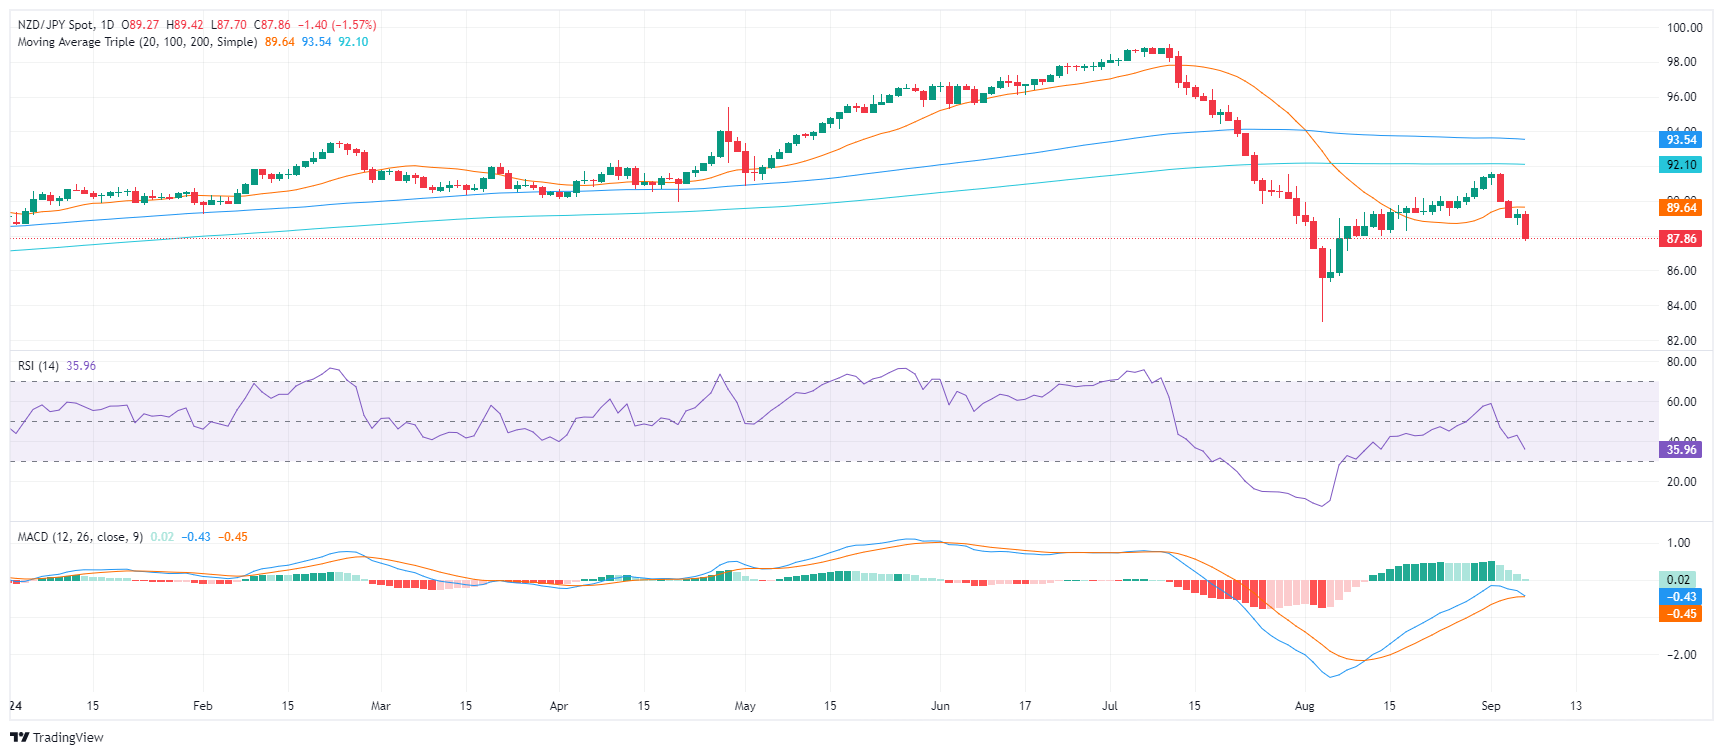
NZD/JPY Daily Chart as of September 6th, 2024

On the daily chart, the NZD/JPY pair shows persistent weakness. Having dropped below the 20-day Simple Moving Average (SMA) at 89.60, bearish forces appear to be in control. If the downward trend persists, critical support levels to watch are 87.50, 87.30, and 87.00.


This article is for education only and is not financial advice. Trading forex and CFDs carries a high risk of losing money. Past or tested performance does not guarantee future results.

One Core Program

Learn the full AFM trading framework

The structured course Ezekiel teaches, from market structure to trade management.

See the program

Related articles

Start your free 5-part forex trainingAsia Forex Mentor Proprietary One Core Program
Ezekiel Chew

Get Ezekiel Chew’s 5 Day Email Course on “How to be in the Top 10% league of Forex Traders”

100% Free – Delivered to your inbox

Subscribe to the most popular Forex Trading blog online, join thousands of readers

Join the Live Event
Get Your Free Ticket Now