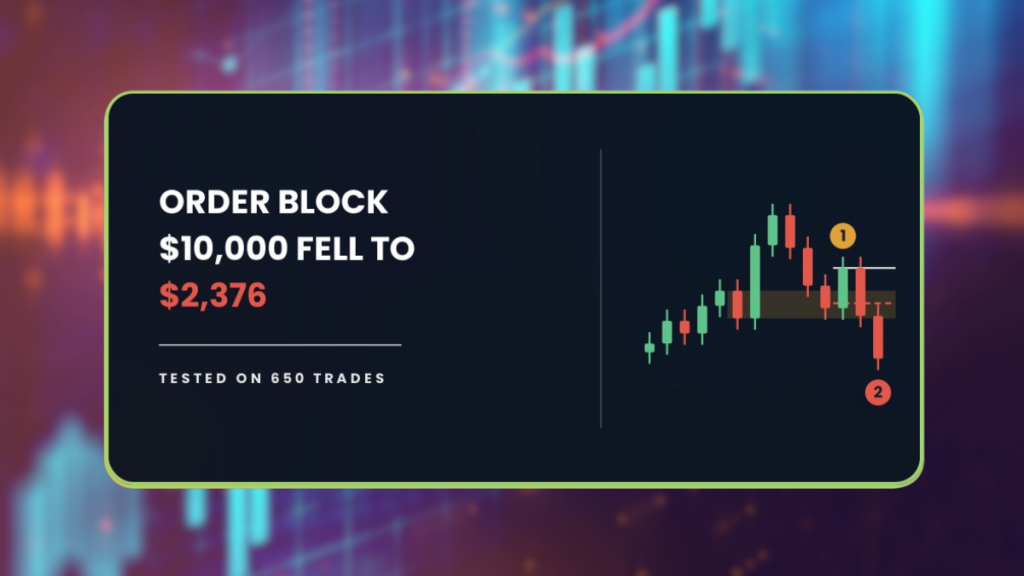
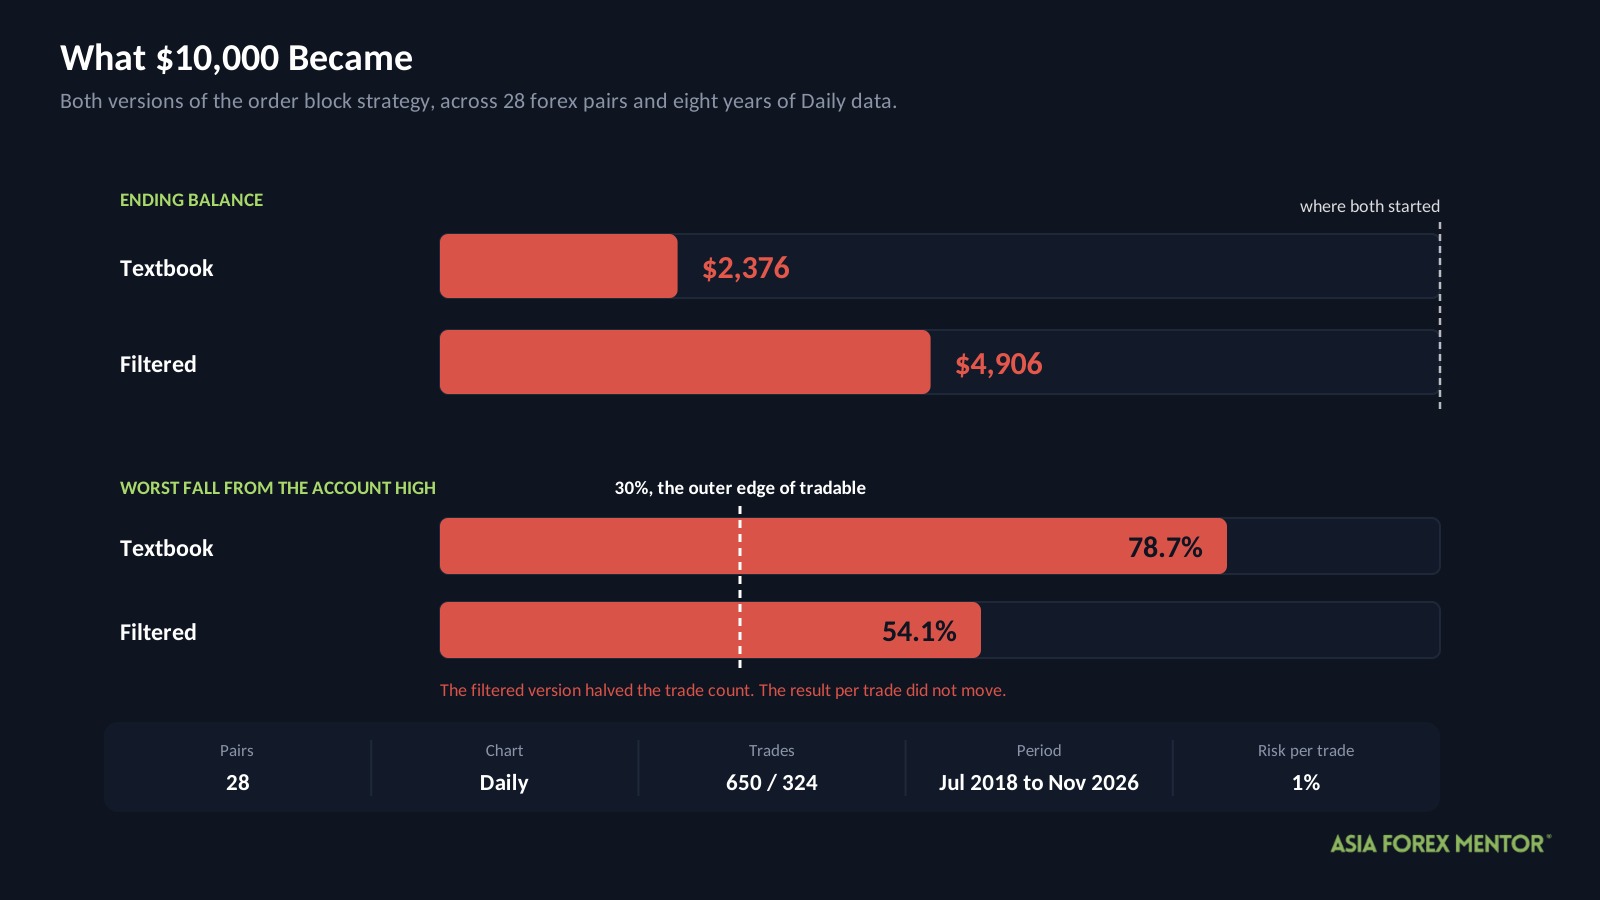
The order block strategy turned $10,000 into $2,376 across 650 trades. One filter then cut the worst drawdown by nearly a third, which looks like progress until you check what it did to the individual trades. It did nothing to them at all.
| About This Guide |
|---|
| This guide covers the order block strategy as the AFM Research Lab tested it, meaning a 50 EMA for direction, a return to the last order block, and an engulfing candle to trigger the entry, across 28 forex pairs and eight years of Daily data. You will finish knowing why an eight point gap in win rate drained the account, and how to tell a filter that helps from one that simply trades less. |
| Quick Answer |
|---|
| An order block is the zone a large move started from, and traders wait for price to return to it before entering. In the AFM Research Lab the textbook version lost money across 650 trades on 28 forex pairs, ending at $2,376 from $10,000. A volatility filter halved the trade count and left the result per trade unchanged. |
What Happened When We Tested The Order Block Strategy
Eight years, 28 pairs, 650 trades on the Daily chart. Here is where each version left a $10,000 account.
| Version | Start | End | Max drawdown | Trades |
|---|---|---|---|---|
| Textbook | $10,000 | $2,376 | 78.7% | 650 |
| Filtered | $10,000 | $4,906 | 54.1% | 324 |
Drawdown is the gap between the best the account ever looked and the worst that came after it. At 78.7 percent, nearly four fifths of the textbook peak had gone at the low point, which put the balance near $2,130 before it recovered to where it finished. The filtered version bottomed around $4,590.
Thirty percent is the drawdown we treat as the outer edge of tradable. Past that, most people abandon the rules long before the rules get a chance to recover, so a system that needs you to sit through 54 percent is not really a system you can run.
Costs came out at 0.05 percent of the entry price per round trip, and every position risked 1 percent of the account. The window runs from July 19, 2018 to November 2, 2026.
These numbers come from a backtest, which runs fixed rules over prices that have already happened. It cannot reproduce a missed fill, a spread that widened at the wrong moment, or the decision to stop trading after the ninth loss in a row.
Key Takeaways
- The textbook rules lost money across 650 trades, ending at $2,376 from a $10,000 start.
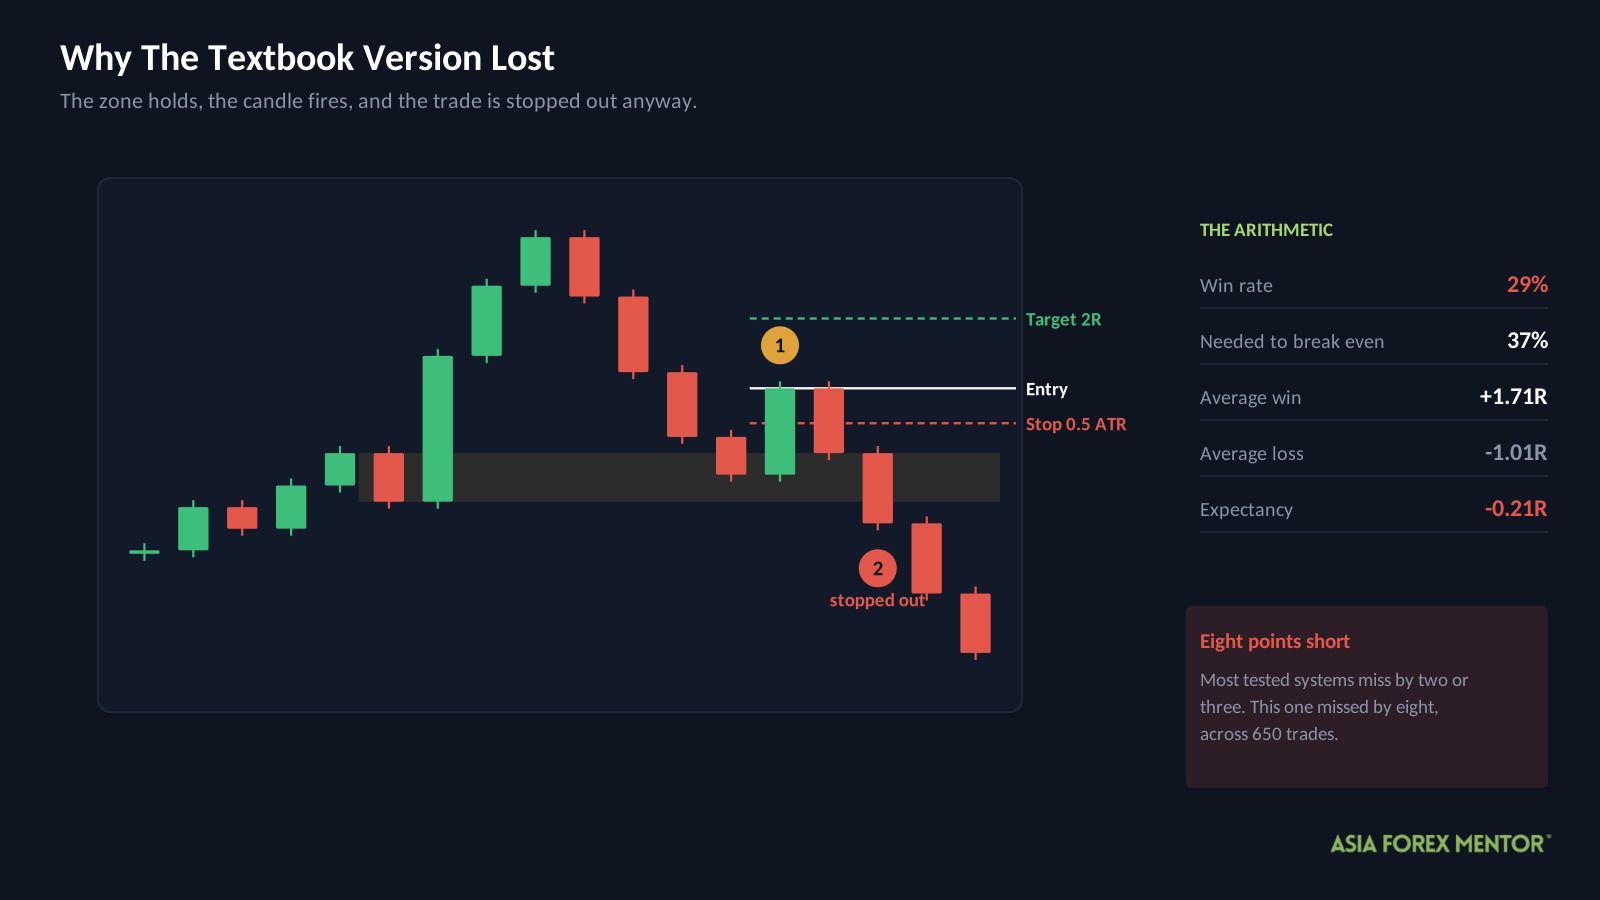
- Winners averaged 1.71R against losers at 1.01R, a payoff that needs a 37 percent win rate. The setup delivered 29.
- A low volatility filter cut the worst fall from 78.7 percent to 54.1 percent and the trade count from 650 to 324.
- Both versions finished on the same expectancy of minus 0.21R, so the filter did not improve a single trade.
- NZDUSD supplied 73 of the 324 filtered trades, more than six times an even share across 28 pairs.
What Is An Order Block?
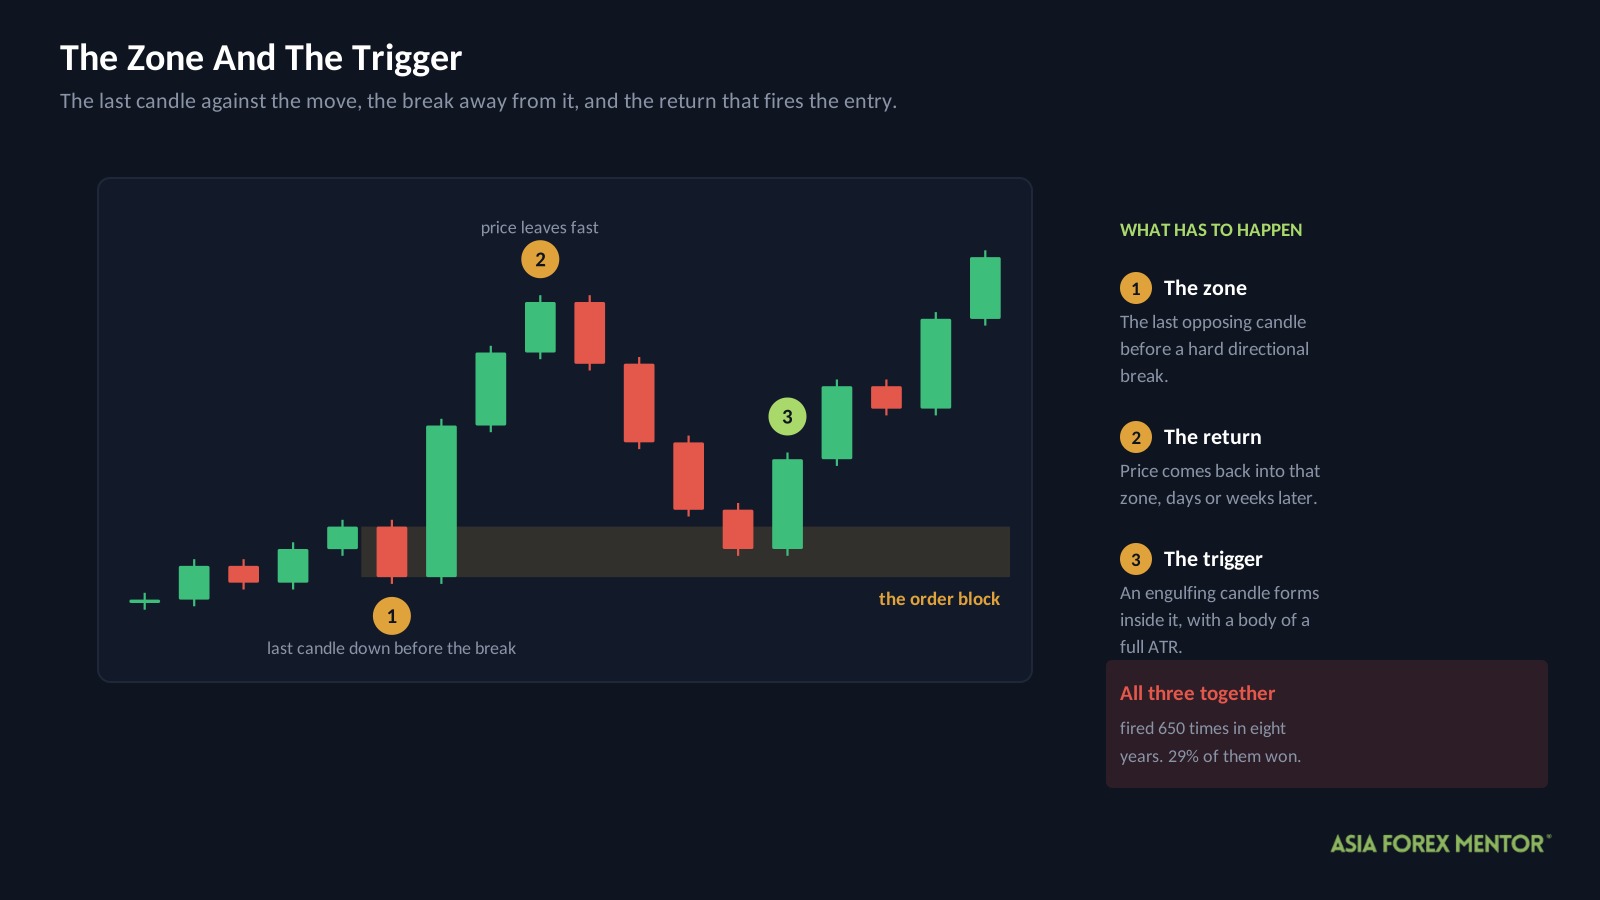
An order block is the zone a large directional move started from. On the chart it is the last candle pointing the other way before price broke hard in one direction.
The reasoning is that whoever drove that move left business unfinished. If they could not fill everything at the time, they may come back to the same level, and price should react when it returns.
So the zone becomes a place to wait rather than a signal to act. Traders mark it, leave it alone, and watch for price to come back.
What turns the wait into a trade is the engulfing candle. One bar opens beyond the previous bar’s close and finishes beyond its open, swallowing it whole, and that is read as the moment the zone did its job.
How Do Most Traders Trade It?
They set the direction with a moving average, mark the zone, and wait for the candle.
| Rule | Setting |
|---|---|
| Chart | Daily |
| Direction | 50 period EMA, longs above and shorts below |
| Zone | Most recent order block in the last 50 bars, at least 10 bars old |
| Trigger | Engulfing candle forming inside the zone |
| Signal size | Candle body at least 1 ATR |
| Stop loss | 0.5 ATR beyond the entry candle |
| Target | 2R |
Every result below is written in R. One R is whatever you staked on that trade, so on a $10,000 account risking 1 percent it is $100, and a trade returning 1.71R handed back $171.
ATR tracks how much ground a pair covers in a typical day. These rules use it twice, once to size the stop and once to decide whether a candle is large enough to count as a signal at all.
That second use matters more than it looks. Requiring a full ATR of body means most engulfing candles are rejected, which is why 28 pairs across eight years produced only 650 trades. That is under three per pair per year.
Why Did The Textbook Version Lose?
| Metric | Textbook |
|---|---|
| Trades | 650 |
| Win rate | 29% |
| Average win | +1.71R |
| Average loss | -1.01R |
| Expectancy | -0.21R |
| Profit factor | 0.70 |
| Yearly growth rate | -15.9% |
| Max drawdown | 78.7% |
| Ending balance from $10,000 | $2,376 |
Expectancy is the one number that settles whether a system makes or loses money. It averages every closed trade, winners and losers together, and at minus 0.21R this one handed back a fifth of each stake.
Profit factor stacks all the winnings against all the losses. Below 1.00 means the second pile is larger, and 0.70 means it was a great deal larger.
CAGR flattens eight years into a single annual figure. Minus 15.9 percent is the pace at which the account shrank, year after year, without a break.
The payoff ratio was never the issue. A 1.71R winner against a 1.01R loser means you can afford to be wrong most of the time, and the arithmetic sets the threshold at 37 percent.
The setup won 29 percent.
Eight percentage points is a wide miss, far wider than the two or three point gaps that sink most tested systems. Across 650 trades it removed three quarters of the account.
What Did We Change?
One rule: only trade when the market is quiet.
| Filter | Condition | The idea behind it |
|---|---|---|
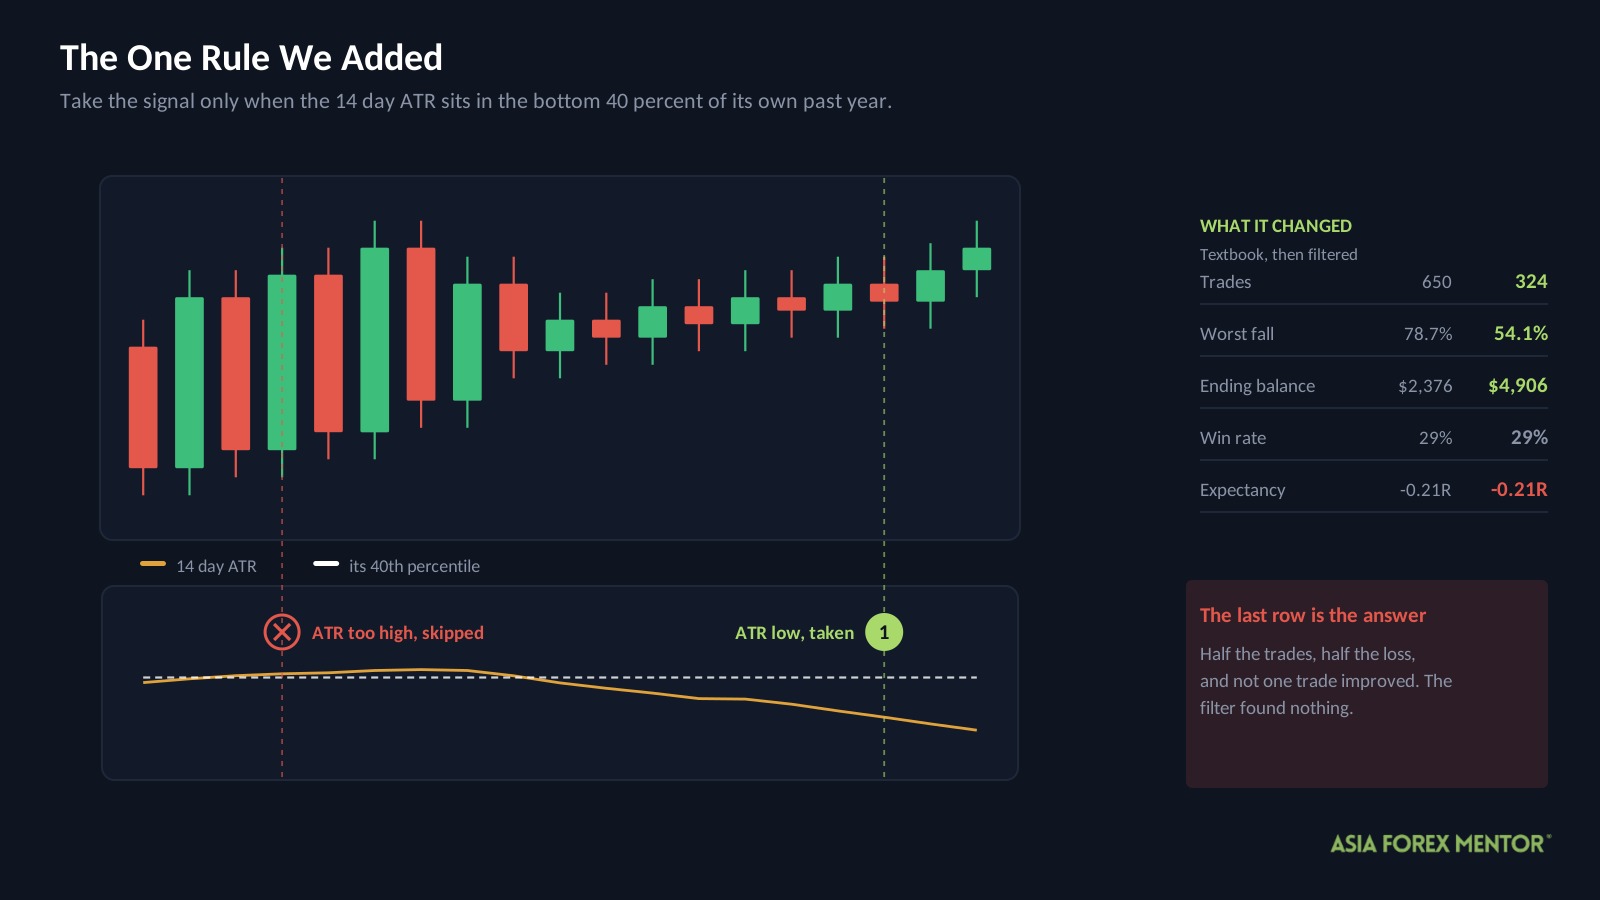
| Volatility | 14 day ATR in the bottom 40 percent of its past year | Zones hold better when price is not being thrown around |
The thinking is sound on paper. High volatility (https://www.asiaforexmentor.com/volatility-indicator/) widens spreads, pushes price through levels faster, and makes a 0.5 ATR stop easier to clip by accident. Quiet markets should let a zone do its work.
Entry, stop and target were untouched. The filter only decides whether a signal becomes a trade.
Worth naming the method: the grid search that chose this filter ran across the full eight years, so it scored itself on the same data it learned from. We call it the AFM version rather than the optimized version, because optimized would imply it had been tuned well.
Did The Filter Work?
Look at the last row before you answer.
| Metric | Textbook | Filtered |
|---|---|---|
| Trades | 650 | 324 |
| Win rate | 29% | 29% |
| Average win | +1.71R | +1.79R |
| Max drawdown | 78.7% | 54.1% |
| Ending balance from $10,000 | $2,376 | $4,906 |
| Expectancy | -0.21R | -0.21R |
The expectancy did not move. Neither did the win rate. Measured per hundred trades, the textbook lost 21.3R and the filtered version lost 21.1R, a difference of two tenths of one R.
So the filter did not make a single trade better. It made half of them disappear.
That is the whole explanation for the improved ending balance and the smaller drawdown. Run a losing edge 324 times instead of 650 and you lose roughly half as much. The account looks healthier because it did less, not because it did better.
Scaled so both carry the same 54.1 percent worst fall, the textbook ends at $4,855 and the filtered version at $4,906. Fifty-one dollars apart on a $10,000 account over eight years.
Did It Hold In Every Period?
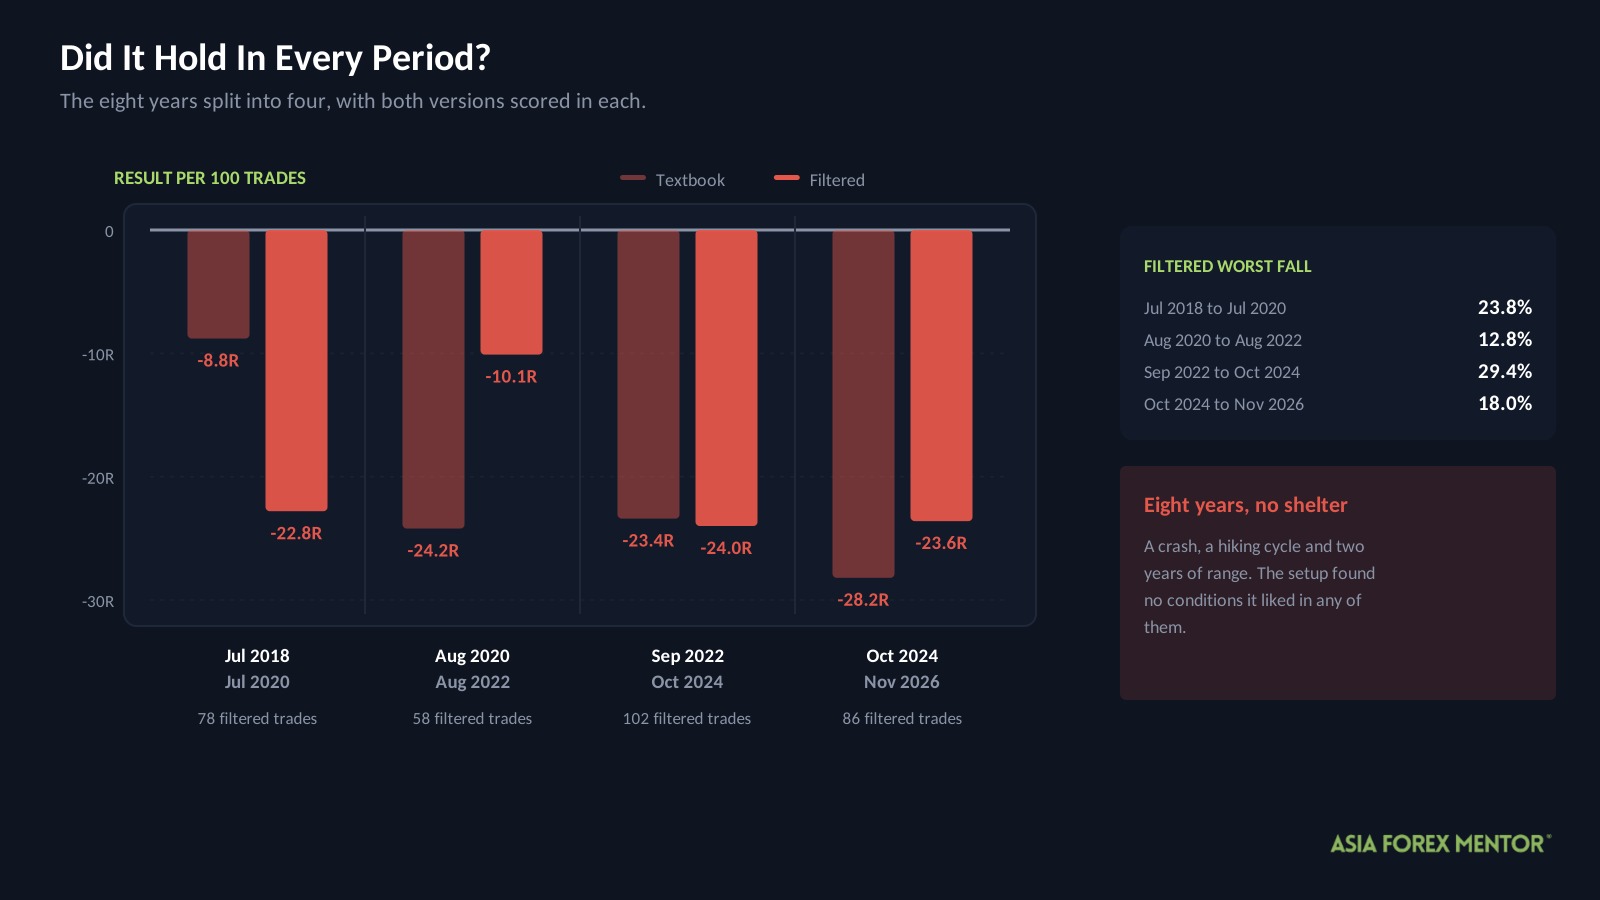
The eight years split into four stretches. Because the filter was selected using all of that history, these are a consistency check rather than an independent test.
| Period | Textbook per 100 | Filtered per 100 | Filtered win rate | Filtered drawdown | Trades |
|---|---|---|---|---|---|
| Jul 2018 to Jul 2020 | -8.8R | -22.8R | 28% | 23.8% | 78 |
| Aug 2020 to Aug 2022 | -24.2R | -10.1R | 33% | 12.8% | 58 |
| Sep 2022 to Oct 2024 | -23.4R | -24.0R | 27% | 29.4% | 102 |
| Oct 2024 to Nov 2026 | -28.2R | -23.6R | 29% | 18.0% | 86 |
Every stretch lost money for both versions, which is worth sitting with. Eight years covers a pandemic crash, a rate hiking cycle and two years of range, and the setup found no conditions it liked.
The filtered version came out ahead in two periods and behind in two, which is the pattern you get from noise rather than from an edge. Its drawdown was smaller in all four, and that is consistent, but a smaller drawdown on half the trades is what fewer trades buys you.
With 58 to 102 trades in each stretch, the win rate alone carries a swing of around five points either side from chance. The 27 to 33 percent range here sits entirely inside that.
What About The Pairs?
NZDUSD produced the best expectancy in the filtered version at 0.12R per trade, across 73 trades.
Check that trade count against the sample. The filtered version took 324 trades across 28 pairs, so an even spread gives about 12 each. NZDUSD supplied 73, which is six times its share and 22 percent of the entire sample.
That concentration matters more than the ranking. A result described as coming from 28 pairs is, in practice, leaning heavily on one of them, and a pair that generates six times the normal number of signals is behaving differently from the rest of the universe.
No pair stayed positive across both halves of the data, NZDUSD included.
What Did A Winning Trade Look Like?
| Detail | Value |
|---|---|
| Pair and chart | EURUSD, Daily |
| Direction | Long |
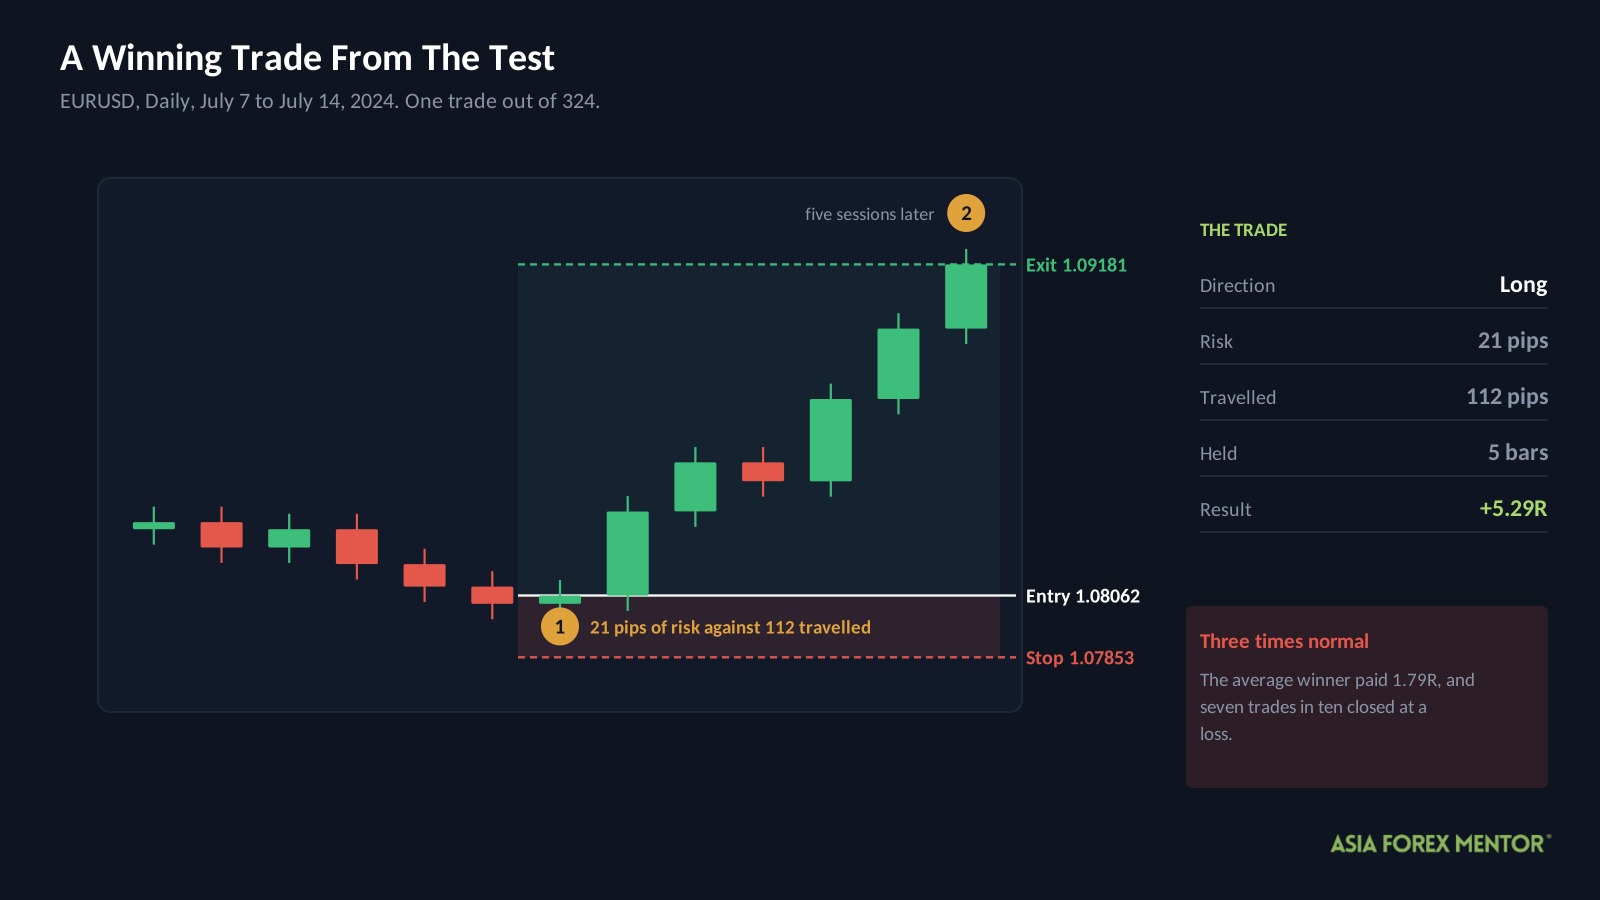
| Entry | July 7, 2024 at 1.08062 |
| Stop | 1.07853 |
| Exit | July 14, 2024 at 1.09181 |
| Result | +5.29R in 5 bars |
Price had returned to an order block with EURUSD above its 50 EMA, and an engulfing candle formed inside the zone with a body wide enough to qualify.
The risk was 21 pips and price covered 112 in five sessions. That ratio is what the setup is built to catch when everything cooperates.
It is also three times the average winner in the filtered sample, which came in at 1.79R. Seven trades in ten closed at a loss, and no quantity of trades like this one closes an eight point gap in win rate.
What Should You Take From This?
One habit transfers out of this test, and it will save you from a lot of bad filters.
When you add a rule and the equity curve improves, check the per-trade number before you believe it. Expectancy, or average R, or win rate. Any of them will do.
If the curve got better and the per-trade number did not move, the rule did not find anything. It just reduced how often you lose, which is a different thing entirely and offers no protection at all once you size up or trade more pairs.
Here is the test in one line: a filter that works improves the average trade. A filter that only reduces activity improves the total while leaving the average exactly where it was. The second kind feels like progress on a chart and does nothing for you.
The same check works in reverse. If a rule cuts your trade count in half and your expectancy holds steady, you have not found an edge, but you have found a cheaper way to run the same one.
Is The Order Block Strategy Worth Your Time?
Taught this way, no, and 650 trades across eight years is enough evidence to say so.
- The textbook rules lost money across 650 trades, ending at $2,376 with a 78.7 percent drawdown.
- A 37 percent win rate was needed and 29 percent arrived, an eight point miss that no filter here closed.
- Both versions finished on minus 0.21R per trade, so the improvement was volume, not quality.
The order block concept itself is not what failed. Price does react at levels where big moves originated, and learning to mark those zones is worth your time regardless of what you trade.
What failed is the trigger. Requiring a full ATR of engulfing body inside the zone produced fewer than three signals per pair per year and a 29 percent strike rate, which suggests the condition is filtering for large candles rather than for genuine reactions.
If you want to keep working on this one, that is the variable to change. Loosen the body requirement, keep the zone, and watch whether the win rate moves. Expectancy is the number to watch, not the ending balance.
Also Read: CHoCH Strategy Tested
Frequently Asked Questions
Does The Order Block Strategy Work In Forex?
Not in the form tested here. The AFM Research Lab ran it across 650 trades and eight years of Daily data, and $10,000 finished at $2,376 with a 78.7 percent drawdown.
What Is An Order Block In Trading?
It is the last candle pointing against the trend before price broke hard in one direction, marking the zone that move started from. Traders treat it as an area price may return to and react from.
What Win Rate Does This Setup Need?
Thirty-seven percent, based on winners averaging 1.71R against losers at 1.01R. The tested version reached 29 percent, and that eight point shortfall is what emptied the account.
Did The Volatility Filter Improve The Order Block Strategy?
It improved the ending balance and the drawdown, but not the trades. Expectancy stayed at minus 0.21R in both versions, so the gain came from taking 324 trades instead of 650 rather than from better entries.
Which Forex Pair Suited The Order Block Strategy Best?
NZDUSD led at 0.12R per trade, though it supplied 73 of the 324 filtered trades, which is six times an even share across 28 pairs. No pair stayed positive across both halves of the data.
How Often Does This Setup Trade?
About 78 times a year across all 28 pairs before filtering, which is under three trades per pair annually. The volatility filter cuts that roughly in half.