The piercing pattern candlestick formation is a technical indicator that signals a potential bullish reversal from a downward trend to an upward trend. It is a rare candlestick pattern and must be confirmed by other technical indicators (e.g., RSI, MACD, Stochastic). If the piercing pattern forms near or on the support line, the indicator is even stronger and more likely to predict the future short-term bullish reversal.
Also Read: What Is the Piercing Pattern?
Contents
- The Piercing Pattern Market Story
- Piercing Line Pattern Formation
- Meaning of Candlestick Colors
- Interpreting the Piercing Pattern Indicator
- Dark Cloud Cover Pattern
- Key Takeaways
- FAQs
The Piercing Pattern Market Story
The piercing pattern is also referred to as the piercing line pattern. It signals that the sellers' supply has been depleted and that the asset's price was driven down. The second day shows buyers driving prices upward.
This bullish engulfing pattern is rare. It is never used as a standalone technical indicator. Its market signal is always confirmed by at least one other technical indicator. The charts used by traders range from very short time periods (5, 10, 15-minute charts) to longer time periods that span hours. Often used by long-term investors, who use it to identify possible major trend reversals or trends that might last for days, weeks or months.
Piercing Line Pattern Formation
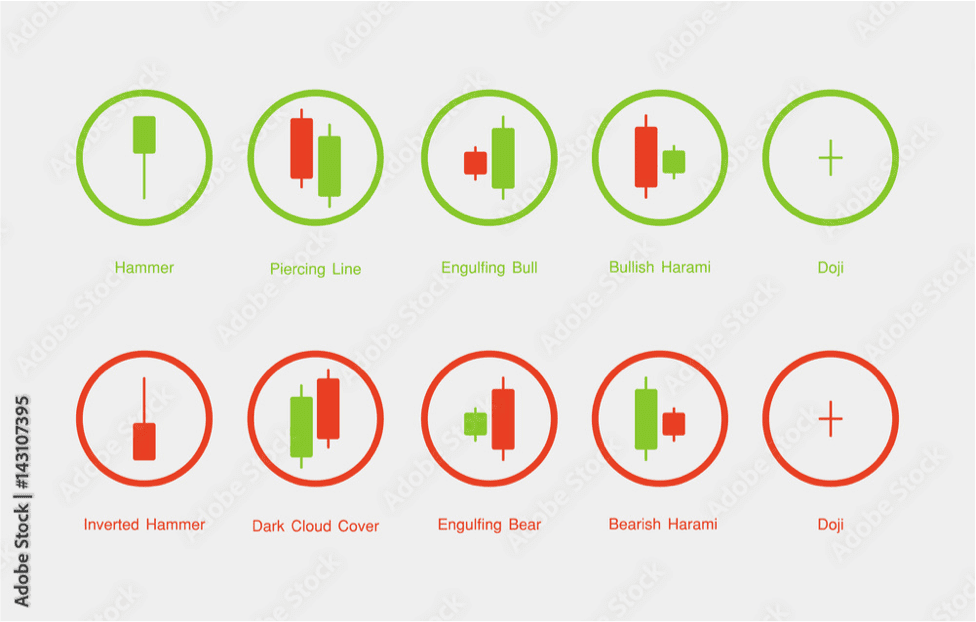
It's a two candlestick pattern. The first candlestick is bearish, and the second candlestick is bullish. They are seen in price movements with a downtrend, price gaps lower to begin the second day, and the second candle must close above the midpoint of the prior candle.
Breakaway Gap
The breakaway gap is created by market makers who set the opening price lower than the previous day's closing price at the opening of the market. The lower price attracts a flood of buyer who pour into the market and reverse the price trend. Their frenzied buying pushes the asset price upward at the beginning of the market day.
Piercing Pattern Description
This bullish candlestick pattern normally indicates that there will be a short-term trend reversal in approximately 5 days. The piercing pattern has three properties:
- a downward trend before the candlestick pattern forms
- a gap after the first day
- a strong reversal after the second bullish candle
The two candlesticks have different colors. The first candlestick, the green candlestick, opens near the market high and closes near the market low. It has an average-sized body, trading range. The second candlestick, the red candlestick, opens near the market low and closes near the market high. The real body of the second candlestick covers at least half of the upward length of the previous candle.
The first candle is a bearish candlestick. It can be green or black. The second candle is a bullish candlestick. It can be a red, pink, or white candle.
Meaning of Candlestick Colors
In a market chart, the candle symbolizing downward of the asset's price, the bearish candlestick, is black, green, or another dark color. The candle symbolizing upward movement of the asset's price, the bullish candlestick, is colored white, pink, red, or a some other bright color.
The presence of a red and green candle next to each other alerts traders that there could be a bullish reversal pattern in the near future.
Also Read: Candlestick Patterns Cheat Sheet
Interpreting the Piercing Pattern Indicator
This is a bullish trend indicator . The trend will be short-term. When investors spot the pattern, they will buy the asset at the low market price or set up call options to buy it at the lower price so that they can buy and quickly sell it for a profit after the price spikes upward. Traders can also set up put options if they think that the price will fall lower than the current market price after the short-term bull run.
This technical indicator is correct about 73% of the time. In short, for every US$100 spent on trades based on this indicator, investors earn US$18.50 (on average).
Dark Cloud Cover Pattern

The dark cloud cover pattern is the opposite of the piercing pattern. The pattern has two candlesticks. It is a bearish reversal trend technical indicator candlestick pattern. The bullish candlestick appears on the first day and the bearish candle appears on the second day.
The dark cloud cover pattern occurs when the bearish candlestick closes below the middle of the previous candlestick. It gaps up on the second day. On day 2, the bearish candles fills the gap and closes significantly into the gains made by the bullish candle.
This bearish engulfing pattern indicates a potential weakness in a bullish trend. The market signal should be confirmed by other technical indicators.
This pattern signals that bullish traders are unable to keep the price high and that demand cannot keep pace with market supply.
Trading the Dark Cloud Cover Pattern
This bearish candle pattern signals trades to set up call options, prepare to sell off their holdings before the price drops. Investors may also look at this as an opportunity to wait for the asset's market price to bottom out and then go long on it.
Key Takeaways
The piercing line pattern candlestick (a.k.a. piercing line pattern) and dark cloud cover pattern are both rare candlestick patterns. They indicate that it is likely that there is the potential for a short-term market trend reversal in the future.
Market trading is inherently risky. When trader bets on the future performance of an asset based on indicators that may be random or have more than one meaning, the risks to the trader are greater. Traders should be careful when placing bets without capped losses. Finally, since these technical indicators must be confirmed by other indicators before trading decisions are made based on them.
FAQs
What are the best charts to use for these candlestick patterns?
It is best to use daily market charts. Daily market charts filter out a lot of the noise in the market and make it easier to find the patterns and confirm them.
Why are the candlesticks different colors?
The candlesticks use different colors to make it easy to identify candlestick patterns on market charts.
A bullish candle is generally black or green. Whereas, a bearish candle is usually white, red, or pink.
There are many candlestick patterns. It is important that traders be able to quickly look over charts and find the patterns of interest to them.
What is the purpose of the gap between the first and second candlesticks?
The gaps between the first and second candles represent interference in the market by market makers. Regardless of whether they are buying or selling the asset, they are setting its price based on their own trading goals.
The gaps between the two candles can sometimes convey information about the mindset, trading needs, or motivation of the market makers. This kind of information is very useful to people who do naked trading or use technical analysis in some way when making decisions about t