
Identifying resistance and support levels is a crucial element in most trading strategies. Traders use different technical analysis tools to locate the potential levels, and the rectangle formation helps in locating the support and resistance with two parallel lines on the chart.
Investors purchase at the support level and sell when at resistance levels. The rectangle formation displays a period of hesitation among buyers and sellers as they make moves in the market, yet none of them has claimed the dominant position.

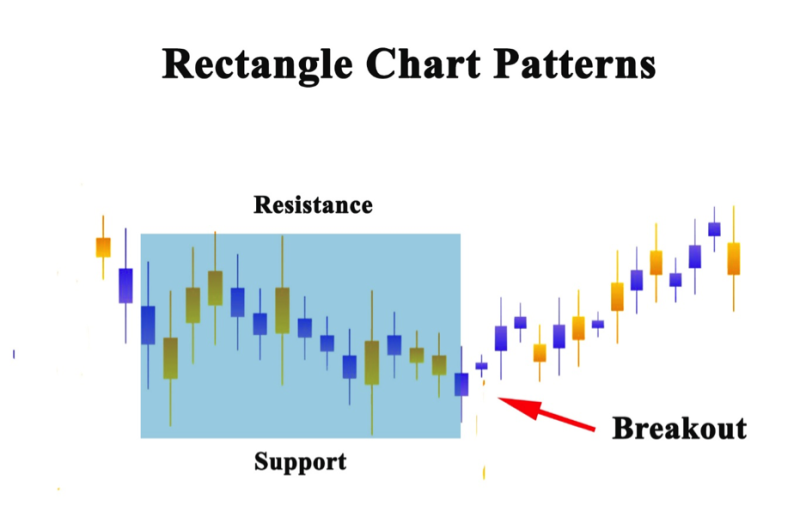
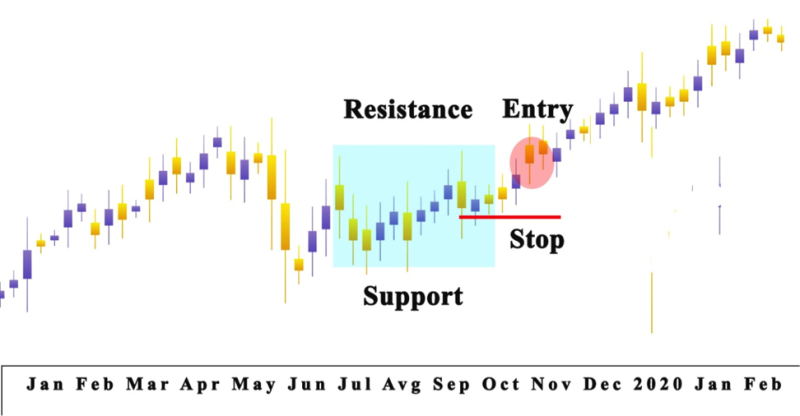
The rectangle emerges when price action moves among the horizontal lines, and the upper line constituting resistance, while the lower line constitutes support.
Both boundaries are a trend line, and the price action has to contact the lines at least twice. This point is what distinguishes rectangles from dual bottoms and tops. In that case, the requirement is for three reversals in prices.
The price moves amid the two parallel lines, and finally, the breakout happens in one or another orientation. Rectangles can have a tilt, yet both lines will be parallel.
These formations show the hesitation of traders, which is crucial in the course of the breakout when it happens.
Contents
- The Continuation Pattern
- Bearish Rectangle Pattern
- Bullish Rectangle Pattern
- Benefits of the Rectangle Patterns for Breakouts
- Breakout Trading Tips with the Rectangle Pattern
- Trading with the Rectangle Chart Pattern
- Conclusion
- FAQs
The Continuation Pattern
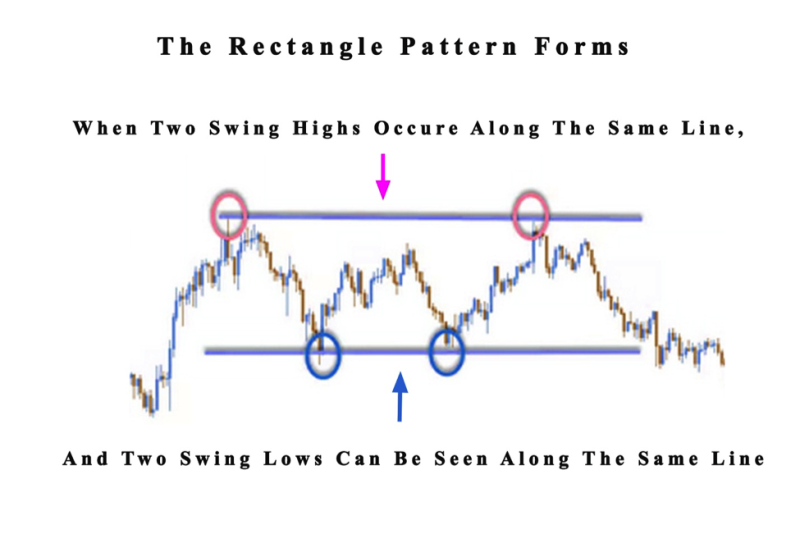
This continuation pattern emerges as a trading range during a standby in the present trend. The recognition of the pattern is not difficult because of the 2 similar highs and the same number of similar lows.
The highs and lows can get combined to form parallel lines, that represent the bottom and top of a rectangle. These rectangles are also referred to as trading ranges, crowding areas, or amalgamation zones.
Before the final breakout, the resistance and support levels get tested by the price. After that, the price can move with the course of the breakout, no matter if it’s going up or down.
It’s important to know that this trading method creates neutral patterns, and there is no bullish or bearish bias.
Investors don’t have an idea of the direction the breakout will happen until it unfolds at the last moment.
The positive note for most investors using the pattern is that chances are that the trade will be constantly moving with the present trend.
This is a practical technique to begin investing in a promising market with a breakout strategy.
Also read: Rising Wedge Pattern: A Complete Guide
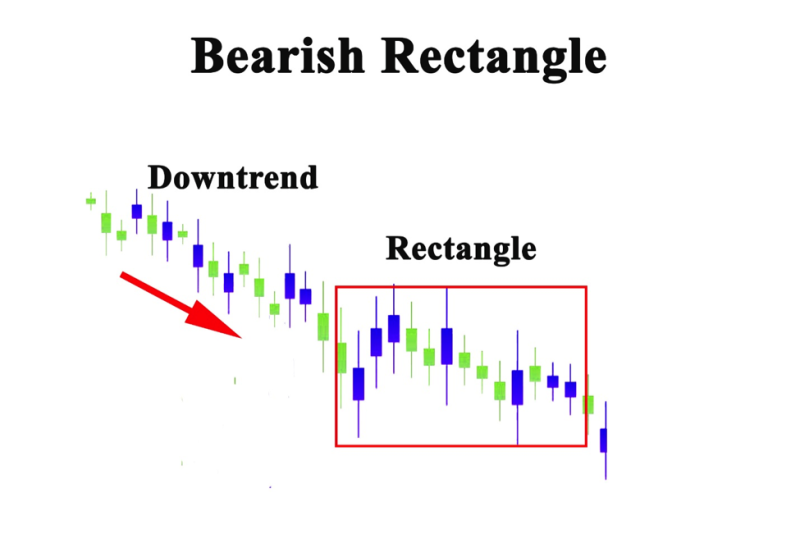
Bearish Rectangle Pattern
The bearish rectangle pattern happens in a downtrend when investors try to open short positions when the price breaks support and then closes in the breakout zone.
When a trader spots a verified bearish rectangle, they need to start a short position if the asset crosses the ranges bottom.
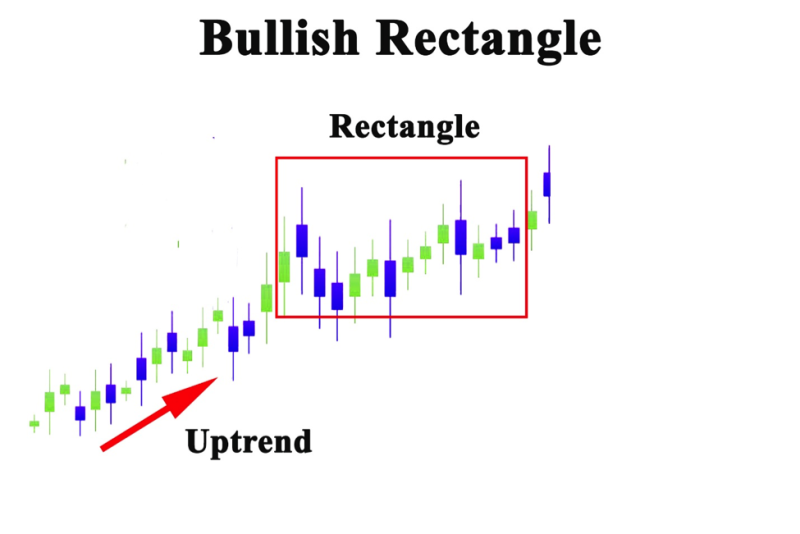
Bullish Rectangle Pattern
The opposite situation of the bearish rectangular pattern is present with the bullish rectangle chart pattern. In the case of the bullish rectangle, it can get observed in an uptrend, where investors plan to start a long position when the price breaks support and closes within the area of the breakout.
If the pattern emerges, a break to the upside signals a continuation of the bullish trend.
Benefits of the Rectangle Patterns for Breakouts
The rectangle patterns are attractive for investors when they use a breakout strategy, because of several advantageous factors:
- It can get used in different markets.
- The rectangle makes it easy to distinguish resistance and support.
- It can get implemented as a breakout or range-bound strategy.
- Entry, stop and limit levels are easy to spot and integrate with a trade.
- The concept is not complicated and beginners can use it to locate a consolidation pattern within a current trend, and then trade the breakout.
Rectangle patterns create barrier channels. The breakouts signal price moving in the established support or resistance level. Indicating they get contacted to breakout trading possibilities.
Also Read: Triangle Patterns: Does It Work?
Breakout Trading Tips with the Rectangle Pattern
The process of investing in the forex market with the rectangle pattern is uncomplicated. Investors can benefit from these recommendations when starting a trade:
- Locate a current trend.
- Check if any other patterns are present, before implementing the rectangle pattern analysis.
- Expect a breakout in the initial course of the trend with a candle close under or over the resistance and support.
- Form support and resistance by combining highs and lows in the rectangle.
- Investors can estimate the breakout price by calculating the height of the rectangle and projecting that height over resistance and under support.
Trading with the Rectangle Chart Pattern
The best aspect of this trading method is that it’s easy to estimate how high or how low it will send the price of the currency.
Recognizing the Pattern
To locate the rectangle pattern, traders must first identify a trending asset that's having a period of amalgamation.
Investors need to spot at a minimum 2 tops and the same number of bottoms, both are horizontal lines in relation to one another. The tops and bottoms of the rectangular range get formed by the support and resistance levels.
The break in a trend creates the initial top. The following 3 price swings form a bottom, and second top and bottom. The attitude of the asset reveals that the price is sealed in the box. When the price action stays still or rebounds from the lower level, then traders get a verification of the pattern.
Identify a Rectangle Pattern Breakout
In the case of a bearish rectangle, the price will have to break the lower level of the figure to verify its presence. In this case, traders will spot a signal on the chart that the price can start a renewed bearish move.
While for a bullish rectangle, traders have to locate a breakout in the patterns upper level. This will verify that the bullish move is returning.
Join the Trade
To get into the trade, brokers have to observe a rectangle breakout direction of the paused chart movement. Then buy the asset if the rectangle is bullish, or sell if you see a bearish rectangle.
In the case of a sell order, it is best to spot a break under support to get verification for the entry. Before coming to this point, traders should spot a false breakout over the resistance line.
The false breakout is crucial because it prevents investors from opening a shot position in the direction of the present trend and placing a stop-loss over the present level of the resistance. At the same time, investors with a resistance breakout trade can be confined by the false breakout.
Using a Stop-Loss
No matter the trading formation used, most investors have to be careful and not find themselves in a situation where they hope for the best, without making any preparations for a worst-case scenario. The correct move is to place a stop-loss for managing a trading position.
If traders spot a rectangle breakout, they should calculate the interval between the resistance and support and position their stop-loss in the middle of this distance.
By implementing these the trade is protected, and the most an investor can lose from the trade will amount to 50% of patterns dimensions.
The stop-loss needs to be positioned in the middle, following the purchase of an asset on a rectangle breakout pattern. The reason is the probable shakeout of the breakout before continuing the trend.
When investors place a stop at the breakout point, the smart money will hit the stop to acquire more shares, after which it will start to go higher.
Leaving the Trade
There are rules about the minimum target when trading the rectangle pattern. Traders have to stay in the trade for a minimum price move identical to the size of the pattern.
This means that the length amid the support and the resistance of the rectangle can be placed on the chart starting from the breakout moment. Because the stop-loss is at the midpoint of the rectangle range, it signals that the target is double the dimensions of the stop. This creates a win-loss ratio of 2:1.
Conclusion
The key factor for a majority of investors implementing the rectangle top chart pattern is that it’s easy to spot on charts that depict the price movement. When an indicator is lagging, it can be used as a real-time tool. Making the rectangle chart pattern crucial in relation to other indicators, and practical for technical analysis.
The classical chart patterns are an attractive trading method used by traders who want to meet a profit target. It’s a trading technique with a long history that has many benefits.
The rectangle formation is one of the classical patterns and is a continuation pattern, providing a solid option to trade in conjunction with the larger trend.
The dual between the bulls and bears is displayed by the double-bottom reversal pattern. Within the rectangle chart pattern, there is a consolidation that signals that neither side dominates the market.
Investors prefer the chart pattern simply because they know how the results are produced. The biggest blunder traders make is to invest in the consolidation price and put their safeguard stop-loss over and under.
When more stops build-up over and under the chart pattern, the more crucial levels become for the veteran investors who require the liquidity offered by these orders to make the important trades.
The rectangle patterns can be traded in different markets. Traders that practice the method will acquire the experience to locate the formations on your price chart, and will be empowered to realize their combinations of trading strategies.
FAQs
What Is the Pattern of Rectangle?
The rectangle pattern forms in price charts when the price achieves the identical horizontal support and resistance levels several times. The prices movement gets restricted among the two horizontal levels, forming a rectangle.
How do You Trade a Rectangle Pattern?
The technical analysis pattern gets traded by purchasing at support and selling at resistance.
What Is a Rectangle Pattern in Stocks?
The rectangle pattern gets used in different markets, and the principles are the same when implemented with stocks. The price is moving among the horizontal support and resistance levels. Traders like to buy close to the bottom and selling at the top. While some want to wait for trade breakouts.
Is a Rectangle Bullish or Bearish?
There is a bullish and bearish version of the pattern. The bearish rectangle gets created when the price consolidates in a downtrend, while the bullish pattern gets formed if the price goes upward.


