
Contents
- What is the Shooting Star Candlestick Pattern
- Identifying The Pattern
- The Shooting Star Candlestick Pattern
- Advantages Of Using The Pattern
- Shooting Star vs Hanging Man
- Shooting Star vs Inverted Hammer Pattern
- Trade the Shooting Star Candlestick Pattern
- Entry point
- Stop Loss
- Take Profit
- Extra Methods
- Conclusion
- FAQs
What is the Shooting Star Candlestick Pattern
Forex traders want to know the good entry, stop loss, and take profit points. To do this they consult price charts and look for patterns. The Shooting Star Candlestick Pattern is the indicator that provides answers to the above mention questions of interest for traders.
It is a bearish pattern that can be identified very easily. This pattern is appropriate for both newbies and veteran traders. It can be found in all intraday charts. And is part of the hammer pattern group.
Technical analysis is a crucial aspect of a forex trading strategy. Forex traders analyze candlestick chart patterns to be more effective in identifying trends when performing a trade.
It is a dependable pattern and is governed by rules that help identify it on the charts. By using the pattern forex traders can reduce anxiety when trading.
Also Read: Candlestick Patterns Cheat Sheet
Identifying The Pattern
The confirmed uptrend authenticates the shooting star candlestick pattern. It indicates that bulls are dominating the market. The proportions of the upper wick have to have double-length than the real body. Together with a small lower wick, they can be interpreted as a bearish shooting star candlestick.
The larger upper wick signals that the market is attempting to locate the following resistance level. The prices have risen because of the bulls.
But this move encounters resistance where bears entered the market. The change in price encourages bulls to leave their positions.
Bears are at the ready to identify the resistance and decompress the long positions and enter the market. This encourages bears to follow suit and overtakes the bulls.
When the deference that is depicted on the candle between the opening and low price is higher, it means bears are dominating and have triumphed in capturing the price from the bulls. The candle is perceived as a bearish candle in technical analysis.
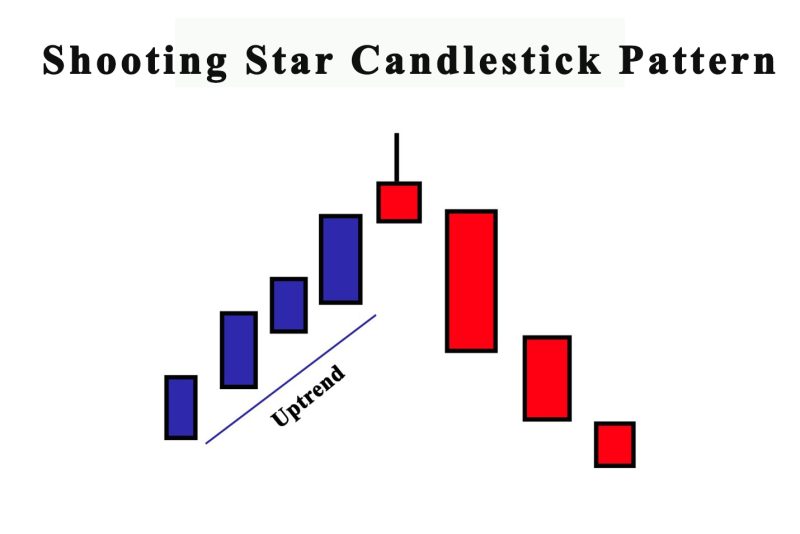
The Shooting Star Candlestick Pattern
The pattern is created in an uptrend. When this happens, prices rise by the bulls or the buyers. But at some point, the price stops climbing and comes under the opening price.
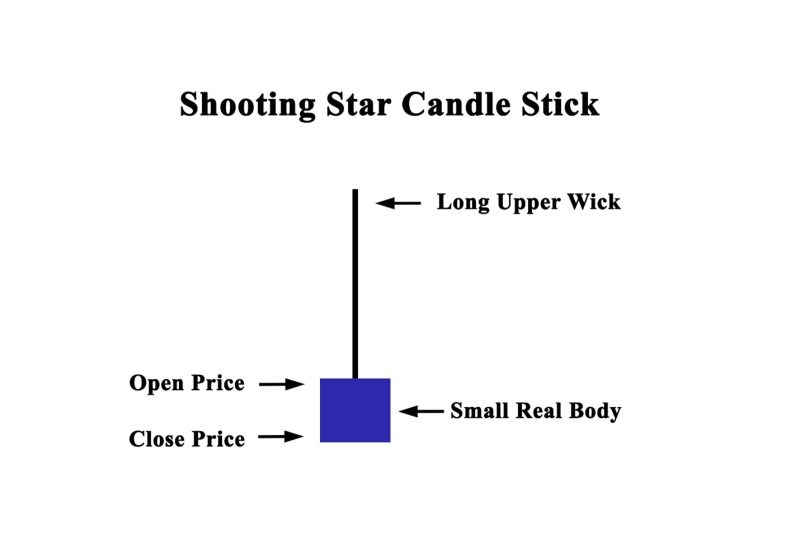
The candle will depict a long upper wick. And a small lower wick, with the closing price lower than the opening price. The length of the upper wick will have to be double that of the real body.
The proportions of the wick with respect to the real body graphically depicts the flop of the buyers and the triumph of the bears. The length of the wick is a factor in confirming the candlestick pattern.
The shooting star candle pattern can be seen on the top of an uptrend and signals reversals of the trend. When the bearish pattern appears, investors need to sell their position.
Advantages Of Using The Pattern
It is an excellent tool for newbies because of its simplicity. Noticing the pattern shooting star is easy if investors follow the description.
Every technical signal can produce false data. In the case of the shooting star, when the pattern nears the resistance level it confirms the bearish trend.
When using the pattern, you need to use risk management. This way investors can have some guarantees if the market changes attitude and goes negative.
Shooting Star vs Hanging Man
The shooting star pattern is frequently mixed up with a hanging man. Both are reversal patterns that appear at the top of a huge rally.
The hanging man pattern gets its name from the form that resembles a small body and long tail. On the chart, it looks like a man was hanged.
It has a small body and a long lower shadow. The opposite is the case with the shooting star pattern. It has a small body and a long upper shadow.
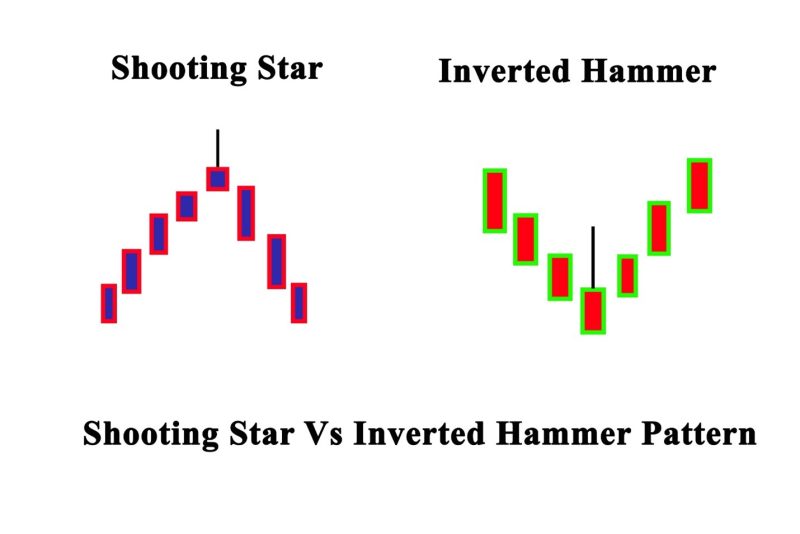
Shooting Star vs Inverted Hammer Pattern
Both shooting star and the inverted hammer pattern are similar in the form of the candle. They are patterns that indicate a reversal pattern.
The difference is that the shooting star candle displays in an uptrend and is a bearish reversal pattern. The Inverted hammer pattern is a bullish reversal pattern and shows up in a downtrend.
It is important to know that the contexts for both are different. The shooting star is created because of price advances. It generally signals the possibility of a turning point lower.
An inverted hammer is created when there is a reduction in a price and signals a possible turning point higher.
Trade the Shooting Star Candlestick Pattern
As a Bearish price reversal pattern, it is tradeable as an independent pattern.
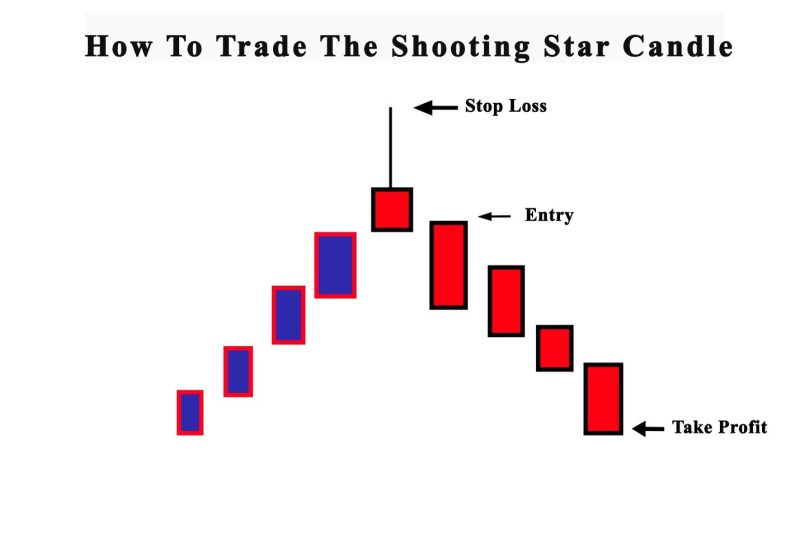
Entry point
The criteria that need to be fulfilled is an established uptrend. The market needs to be under the control of the bulls. This can be identified by the trader.
There need to be three bull candles in the uptrend before the creation of the shooting star candle.
Forceful investors can enter the market with a sell position. Patient traders can wait for the opening of the next candle. The price can go down and sellers will not be able to dominate the market.
Traders need to know that usual for prices to get a pullback before the beginning of a new trend. Traders may need time for a trend reversal. When resistance is identified.
The reversal begins and the following candle will have swings as there may be a struggle between bears and bulls for the next candle of the shooting star candle.
Brokers can expect a price reaction, and when the price goes under the shooting star candle, then the market will remain bearish in the subsequent candles.
Verification of the reversal can be done with trading volumes. They are important for established market activity.
The larger volume levels suggest that sellers are entering and increasing sell orders. At the same time, it signals the relaxing of buy positions and the departure of buyers.
The outcome is trading volumes is verification of candlestick reversal pattern.
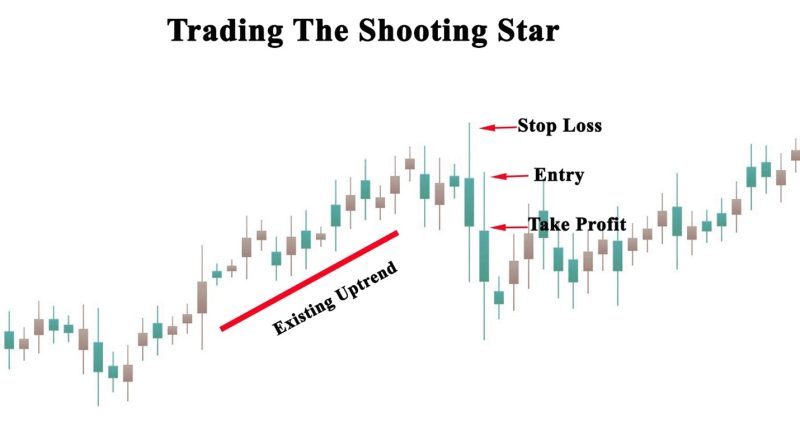
Stop Loss
The most favorable stop loss is the wick of the shooting star candle. The high of the candle is the declining point of the price and the point where the price is reversed.
The market has uncovered the resistance. Stop loss is usually placed by Forex traders above this level.
But if the price goes over this level. The resistance will be removed by the market. The pattern is not valid, and control reverts to bulls. With the possibility that buyers will dominate the price trend.
Take Profit
The pattern offers levels for the measurement of the take profit. The take profit is usually three times the length of the shooting star candle. Investors can calculate the length of the pattern candle.
This is done from the low to the high price. The pattern offers results on that level. Investors can leave if the price action is not what was expected. The pattern develops fast when the bears control the market. Following bear candles are larger and suggest the power of the bears.
Extra Methods
Traders prefer to join a sell position on the candle closing of the shooting star candle. Some may prefer the ending of the next candle to verify the direction of the trend.
An alternative method for minimizing risk is joining the market at a bargain price.
The candle that is to the reversal candle can show pullbacks because of market activity. Traders prefer to stay put and await pullbacks where prices go high as half the length of the reversal candle.
Traders will get a bigger price if they enter a sale at this level and diminish the distance of the stop loss. This will minimize risk and offer larger profit.
The pattern develops fast. Bears take action and the following bear candles are long suggesting the power of the bears.
Price exhaustion is obvious, traders can exit or cover partial positions. Forex traders use supplementary indicators to verify price reversals.
The reversal incorporates the discovery of resistance and the price had been rejected by the resistance. Traders must be careful and verify the reversal before starting a trade.
Conclusion
The Shooting Star Candlestick Pattern is a common and important reversal pattern. It is perceived as one of the more reliable candlestick patterns. It can be traded successfully. It is not hard to recognize the pattern. By nature, it is a bearish shooting star.
You can learn it quickly and it can be used by beginners and veteran forex traders. It is present in every chart and in every financial market.
The pattern offers entry, stop loss and take-profit levels. Investors can use other methods to verify the new trend.
Also Read: Rising Wedge Pattern
FAQs
Is shooting star bullish?
The shooting star is a bearish candlestick. It appears after an uptrend. The pattern has a long upper shadow, no lower shadow, a small real body near the low of the day.
What is the meaning of the shooting star candlestick pattern?
The shooting star pattern shows up on charts when the price of the security rises but then closes near the open price.
Can a shooting star candle be green?
The color of the pattern depends on the chart settings. It can be a green signalizing bullish or red bearish trend.
What is the difference between a hanging man and a shooting star?
A shooting star is a hanging man flipped upside down. The difference is that in the case of the hanging man the small real body is near the top of the entire candlestick.
It also has a long lower shadow. The shooting star has a small real body at the bottom of the candlestick, with a long upper shadow.


