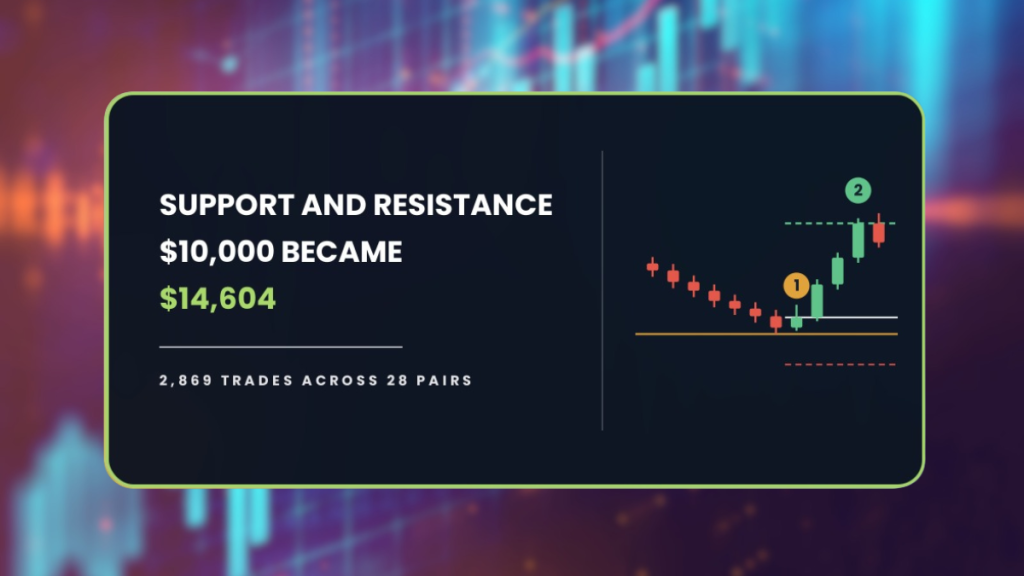
The support and resistance strategy turned $10,000 into $14,604 across 2,869 trades, the first textbook version in this series to finish ahead. One volatility filter took that to roughly $30,400 and cut the worst drawdown almost in half. Then we checked which years produced it.
| About This Guide |
|---|
| This guide covers the support and resistance strategy as the AFM Research Lab tested it, meaning a level touched at least twice in 20 bars, entered when price returns within 0.5 ATR of it, with the stop 1 ATR beyond the level and a 2R target, across 28 forex pairs and eight years of Daily data. You will finish knowing why a strategy can clear its break-even line and still be untradable, what one volatility condition changed, and why the last two years look nothing like the middle four. |
| Quick Answer |
|---|
| Support and resistance trading waits for price to return to a level that has stopped it before, then bets the level holds again. In the AFM Research Lab the textbook version made money across 2,869 trades on 28 forex pairs, ending at $14,604 from $10,000, with a 63.6 percent drawdown that makes it untradable as written. A volatility filter roughly doubled the result and nearly halved the fall. |
What Happened When We Tested The Support And Resistance Strategy
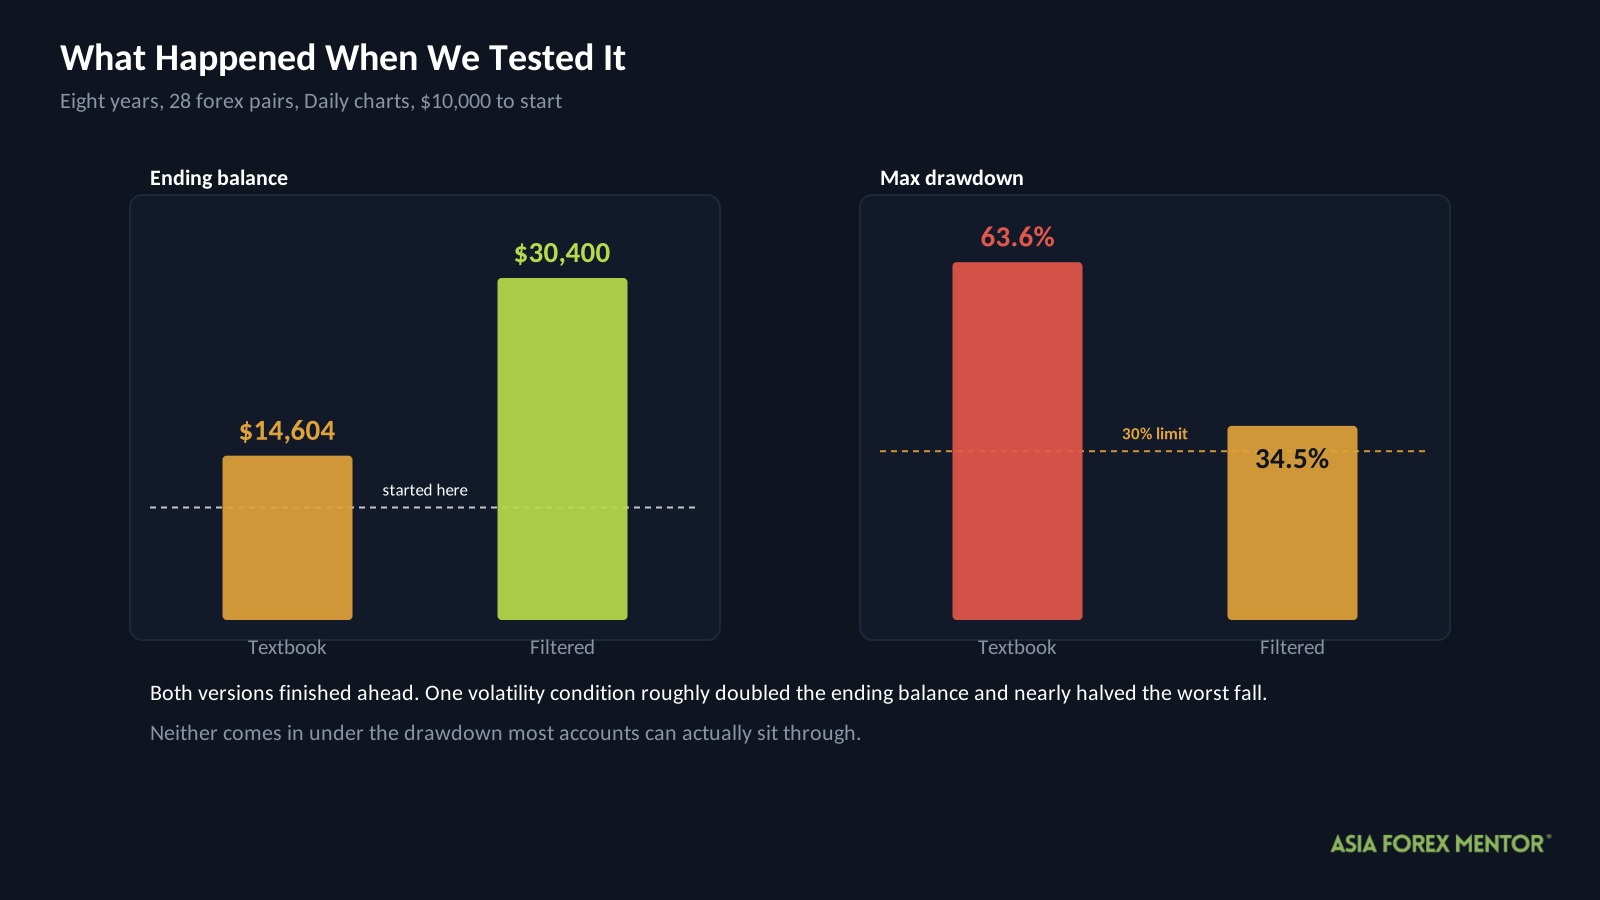
Eight years, 28 pairs, 2,869 trades on the Daily chart. Here is where each version left a $10,000 account.
| Version | Start | End | Max drawdown | Trades |
|---|---|---|---|---|
| Textbook | $10,000 | $14,604 | 63.6% | 2,869 |
| Filtered | $10,000 | $30,400 | 34.5% | 1,271 |
Drawdown is the fall from the highest point an account reached to the lowest that came after. It is a separate question from whether the strategy finishes ahead, and it is usually the one that decides whether you are still trading when it does.
Both versions finished ahead. Neither is tradable as written. Thirty percent is roughly the limit of what people sit through, and the textbook version asks for more than double that.
Every position risked 1 percent of the account and costs came out at 0.05 percent of the entry price per round trip. The window runs from July 10, 2018 to October 15, 2026.
A backtest runs fixed rules over prices that already happened, which measures the edge but not the person. It does not ask you to keep placing trades after the account has halved, which is exactly what the textbook version would have required.
Key Takeaways
- The textbook rules finished at $14,604 from $10,000 across 2,869 trades, the first version in this series to end ahead.
- Winners averaged 1.70R against losers at 1.02R, a payoff needing a 37.5 percent win rate. The setup delivered 38, which is why it barely moved.
- The worst fall reached 63.6 percent, more than twice what most accounts survive.
- One volatility condition removed 1,598 trades, lifted expectancy from 0.01R to 0.10R, and cut the worst fall to 34.5 percent.
- At 1,271 trades the filtered result clears its own margin of error, the first in this series to do so.
- The edge sits in 2020 to 2024. The most recent two years returned 0.03R a trade.
What Is Support And Resistance?
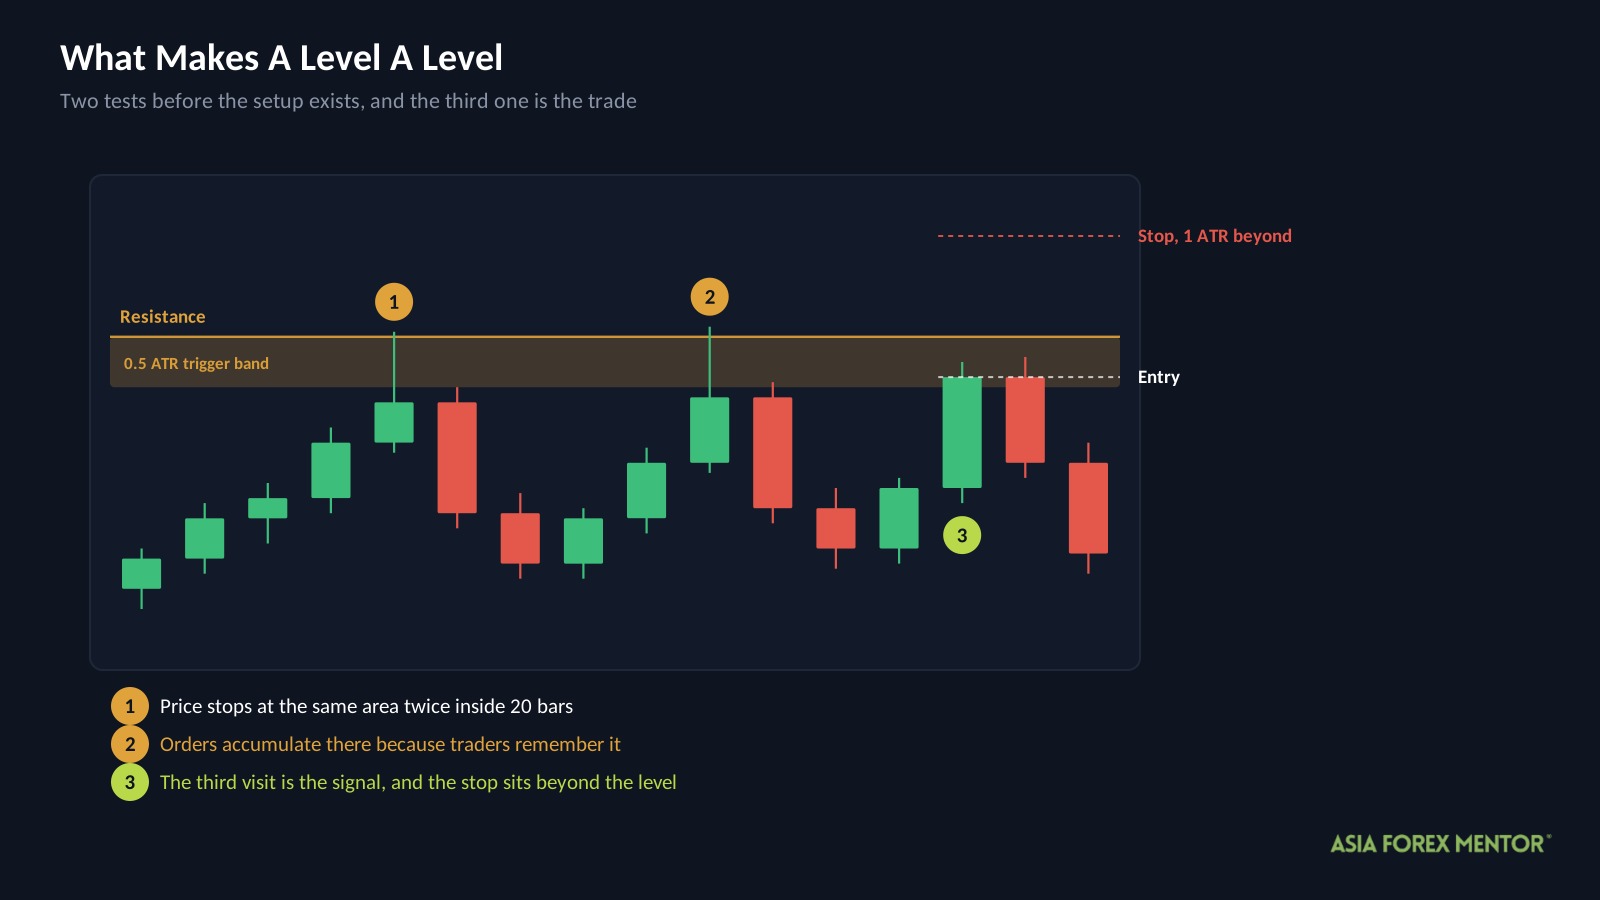
A support level is a price where falls have stopped before. A resistance level is a price where rises have stopped before. The strategy waits for price to come back to one and bets it stops again.
The reasoning is about memory rather than mechanics. Traders who bought at a level and did well remember it. Traders who sold too early and watched price run remember it too. So do the ones still holding losses from that price and waiting to get out even. When price returns, all of them act at once, and the level becomes a real thing rather than a line on a chart.
That also explains why daily levels behave differently from five-minute levels. A daily level has been visible to far more people for far longer, so more orders are waiting there.
What it does not explain is when a level fails, and a level that fails is where the money goes. Our guide to forex market structure covers marking the levels this strategy depends on.
How Do Most Traders Trade It?
They mark the levels first, then wait for price to come back.
| Rule | Setting |
|---|---|
| Chart | Daily |
| Level | Touched at least twice in the past 20 bars |
| Entry trigger | Price returns within 0.5 ATR of the level |
| Direction | Long at support, short at resistance |
| Stop loss | 1 ATR beyond the level |
| Target | 2R |
| Volatility condition | None |
Results below are written in R, where one R is the distance from entry to stop. Risking 1 percent of a $10,000 account makes 1R worth $100, so a 1.70R winner returned $170.
ATR measures the ground a pair typically covers in a session, and this setup uses it twice. It decides how close price has to come before the setup triggers, and it sizes the stop. Both scale with the pair, so the rules behave the same on a quiet pair and a lively one. Our guide to the ATR indicator covers reading it on a chart (https://www.asiaforexmentor.com/atr-indicator/).
Those conditions produced 2,869 signals in eight years across 28 pairs, which is about 12 per pair per year.
Why Did The Textbook Version Barely Work?
| Metric | Textbook |
|---|---|
| Trades | 2,869 |
| Win rate | 38% |
| Average win | +1.70R |
| Average loss | -1.02R |
| Expectancy | +0.01R |
| Profit factor | 1.02 |
| Yearly growth rate | +4.7% |
| Max drawdown | 63.6% |
| Ending balance from $10,000 | $14,604 |
Expectancy averages every closed trade into what a single attempt was worth. At plus 0.01R this version earned about a penny on each dollar risked, which over 2,869 attempts compounds into $4,604 and over any shorter run compounds into nothing you could distinguish from noise.
Profit factor divides everything won by everything lost. At 1.02 the strategy returned $1.02 for every dollar it put at risk, which is a margin thinner than most brokers’ spreads over a bad week.
Yearly growth rate compresses the whole period into one annual pace. Plus 4.7 percent a year sounds survivable until you set it beside the drawdown.
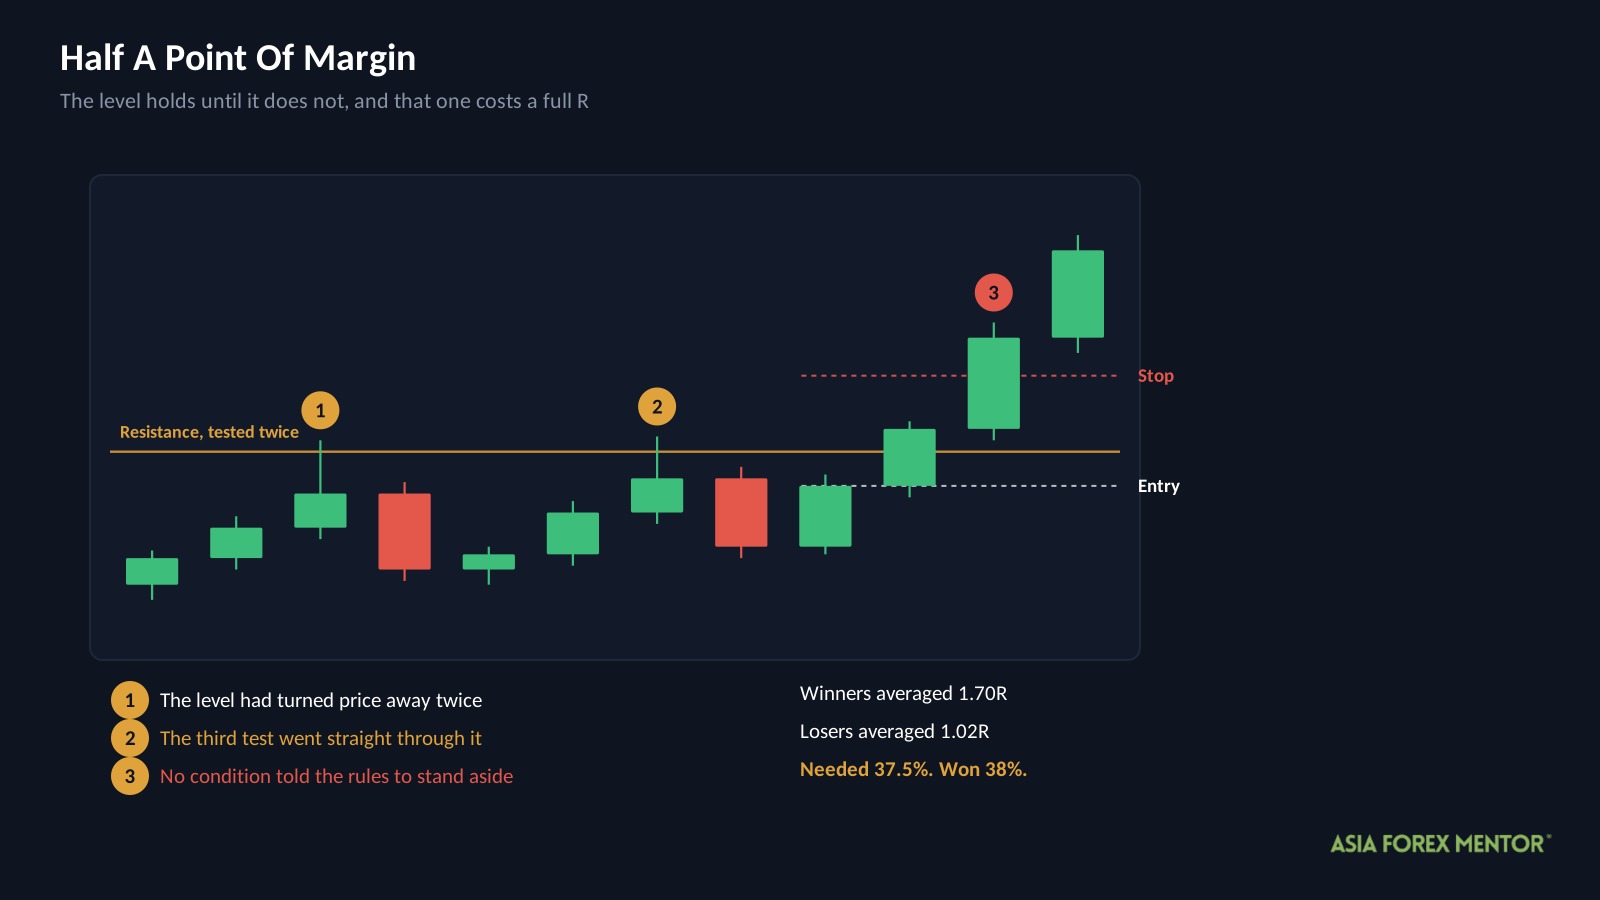
Now the arithmetic. A 1.70R winner against a 1.02R loser puts the break-even bar at 37.5 percent.
The setup won 38 percent.
Half a percentage point of margin. That is the entire edge, and it is why the result is $14,604 rather than a number worth celebrating. More to the point, earning 4.7 percent a year while enduring a 63.6 percent fall is a trade almost nobody should take. You would need to watch $10,000 become roughly $4,000 at some point, and keep going, to collect it.
What Did We Change?
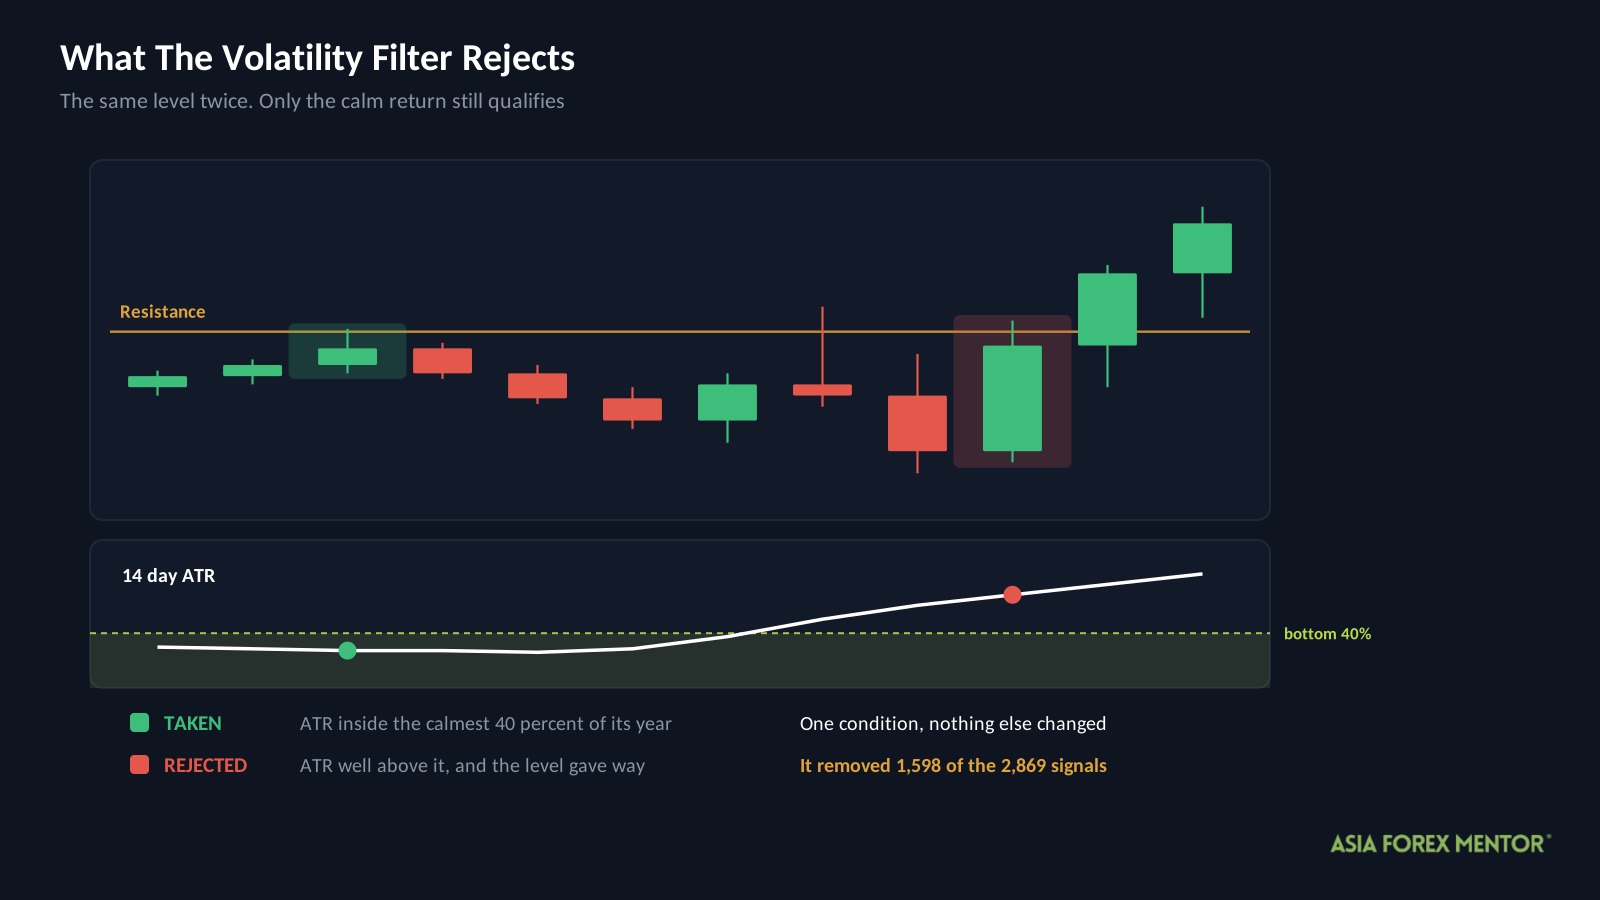
The level rules, the entry trigger, the stop and the target were untouched. The AFM Research Lab added one condition deciding whether a signal became a trade.
| Filter | Condition | The idea behind it |
|---|---|---|
| Volatility | 14 day ATR in the bottom 40 percent of its own past year | Levels hold in calm markets and get run through in fast ones |
The reasoning is specific to what this strategy is betting on. A level holds because the orders waiting there are large enough to absorb what arrives. When a market speeds up, more arrives than the level can absorb, and price goes through a zone that would have held a month earlier. Skipping fast conditions removes the trades most likely to find a level that fails.
The condition removed 1,598 of the 2,869 signals, which is 56 percent of the sample.
The settings came from testing twelve combinations across the full eight years and keeping the one that scored best, so they were fitted to the same data they were then measured on.
Did The Filter Work?
Every figure improved, and this time the sample is large enough to say so with some confidence.
| Metric | Textbook | Filtered |
|---|---|---|
| Trades | 2,869 | 1,271 |
| Win rate | 38% | 40% |
| Average win | +1.70R | +1.80R |
| Average loss | -1.02R | -1.03R |
| Max drawdown | 63.6% | 34.5% |
| Profit factor | 1.02 | 1.16 |
| Ending balance from $10,000 | $14,604 | $30,400 |
| Expectancy | +0.01R | +0.10R |
The filtered version clears its break-even bar with room. Winners at 1.80R against losers at 1.03R set the requirement at 36.4 percent, and it won 40. Expectancy went up roughly tenfold and the worst fall came down by 29 percentage points.
Here is why that matters more than the equivalent claim in our earlier tests. Individual trades here scatter with a standard deviation of about 1.39R, and across 1,271 trades that leaves a margin of error on expectancy of 0.039R. The result is 0.10R give or take 0.04R, so the honest range runs from 0.026R to 0.178R.
Zero is outside that range. A strategy with no edge would produce a result this good roughly once in a hundred attempts rather than one in five. This is the first filtered version in this series whose result survives its own uncertainty.
What it does not survive is the calendar.
Did It Hold In Every Period?
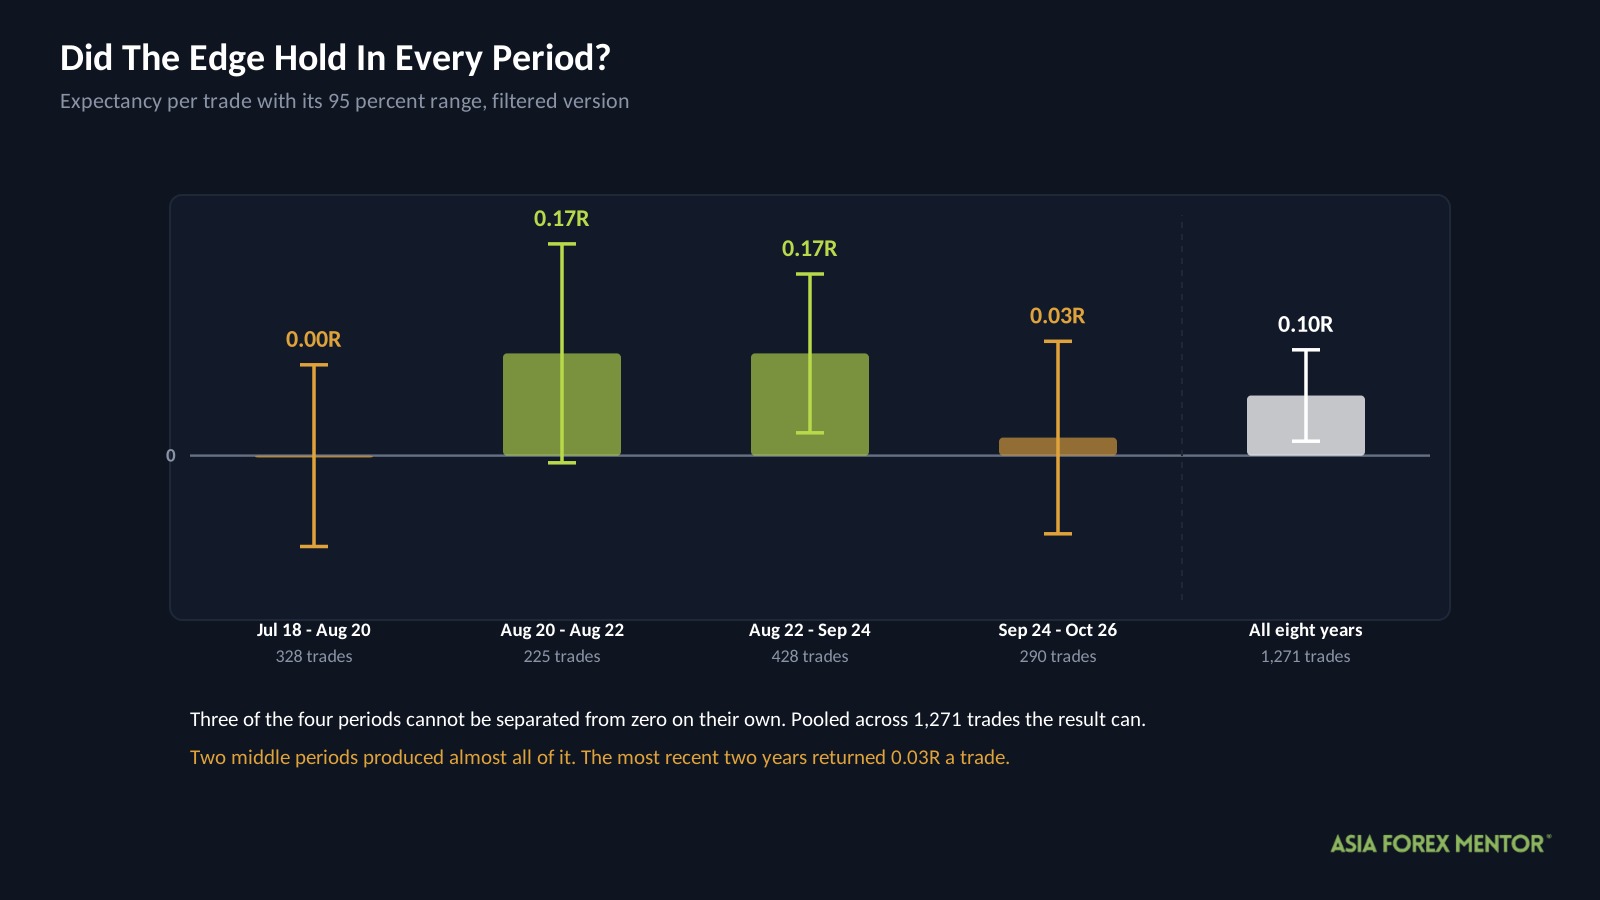
The eight years split into four stretches. The settings were chosen using all of them, so this is a consistency check rather than a test on anything unseen.
| Period | Trades | Win rate | Expectancy | Max drawdown |
|---|---|---|---|---|
| Jul 2018 to Aug 2020 | 328 | 37% | 0.00R | 25.9% |
| Aug 2020 to Aug 2022 | 225 | 41% | +0.17R | 33.3% |
| Aug 2022 to Sep 2024 | 428 | 42% | +0.17R | 21.6% |
| Sep 2024 to Oct 2026 | 290 | 39% | +0.03R | 32.6% |
Two stretches in the middle produced everything. The 653 trades from August 2020 to September 2024 returned 0.17R each. The 618 trades either side of them, covering the first two years and the last two, returned 0.014R between them.
The recent half of that is the part worth sitting with. The most recent period, September 2024 to October 2026, produced 0.03R a trade across 290 trades, with a 32.6 percent drawdown. That is close enough to nothing that the drawdown is the only part you would reliably experience.
A second reading sits in the drawdown column. Every individual stretch came in under 34 percent, three of them under 33, and the full run reached 34.5. The deepest fall did not happen inside any single period, which is what happens when a drawdown starts in one stretch and bottoms in the next. Period-by-period figures always flatter the real risk, ours included.
What About The Pairs?
Three pairs held up across both halves of the data. EURGBP returned 20.7R per 100 trades across 112 trades, EURNZD 13.3R across 118, and USDZAR 12.3R across 133.
Set those against the sample before acting on them. The filtered version averaged about 10.2R per 100 trades overall, and at 112 trades the margin of error on a single pair’s expectancy is roughly 13R per 100. EURGBP’s 20.7 therefore sits less than one standard error above the average, which is the statistical equivalent of nothing at all.
It is worth saying plainly because per-pair tables are the most persuasive and least reliable thing in any backtest. They look like a shortcut. What they usually show is which slice of a sample got lucky, and the smaller you cut the sample the luckier the best slice looks.
The number to ask for is always the trade count behind the pair. Under a hundred and there is nothing to act on.
What Did A Winning Trade Look Like?
| Detail | The typical winner |
|---|---|
| Pair and chart | Any of the 28, Daily |
| Entry | Within 0.5 ATR of a level touched at least twice in 20 bars |
| Stop | 1 ATR beyond the level |
| Target | 2R |
| Average winner | +1.80R |
| Average loser | -1.03R |
| Share of trades that win | 40% |
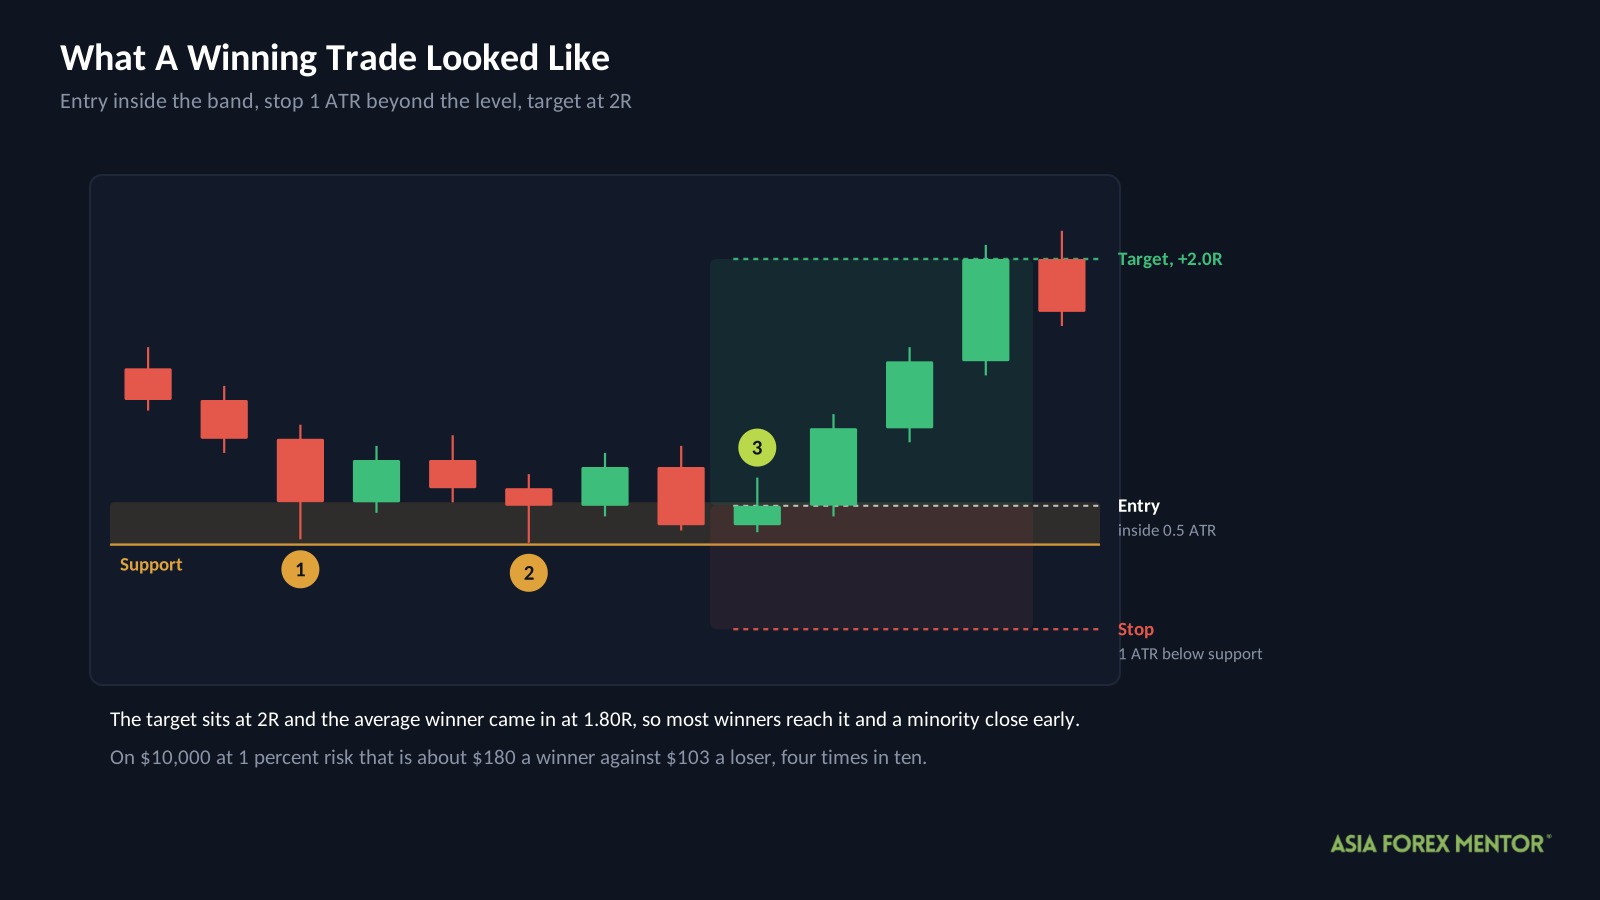
The shape of this strategy is worth understanding, because it is unusual. The target sits at 2R and the average winner comes in at 1.80R, which means most winners reach the target and a minority close early for less. There is no long tail of runners carrying the result.
The losses tell their own story. The stop is placed at a fixed distance, so a loss should cost exactly 1R, and the average loss is 1.03R. That extra 3 percent is spread and slippage, and across 762 losing trades it is the difference between a strategy that works and one that does not.
Run it in money. On a $10,000 account at 1 percent risk, a winner returns about $180 and a loser costs about $103. Win four in ten and a hundred trades return roughly $1,020. Then recall that getting there meant sitting through a fall of a third of the account.
What Should You Take From This?
One habit transfers out of this test, and it is the one that separates a usable backtest from an impressive one.
Read the drawdown before the return. Then ask whether you would have kept trading at the bottom of it.
Here that question answers itself. The textbook version returns 4.7 percent a year and asks you to watch $10,000 fall to about $4,000 on the way. Almost nobody holds through that, which means almost nobody collects the 4.7 percent, which means the headline return describes a result that was available in theory and not in practice.
The filtered version is a genuinely better system on every measure, and it still asks for a third of the account. The improvement is real. It is just not the kind of improvement that turns an untradable strategy into a tradable one, and those two things are easy to confuse when every number on the page moved the right way.
The useful move with a result like this is not to trade it. It is to ask what else would need to change to bring the drawdown under 30, and then test that. Our guide to risk management in forex trading covers sizing a strategy whose drawdown is the binding constraint .
Is The Support And Resistance Strategy Worth Your Time?
The concept yes, this version not yet, and the reason is the drawdown rather than the return.
- The textbook rules finished at $14,604 from $10,000 across 2,869 trades, with a 63.6 percent worst fall and a win rate half a point above break even.
- One volatility condition lifted expectancy tenfold to 0.10R, roughly doubled the ending balance, and cut the worst fall to 34.5 percent.
- The edge sits in 2020 to 2024. The 290 trades since September 2024 returned 0.03R each.
Support and resistance itself is not what failed. Levels do matter, price does react at them, and the textbook version clearing its break-even line across 2,869 trades is real evidence that the idea has something in it.
What fails is the risk the package asks you to carry for what it returns. A 34.5 percent fall for 14 percent a year is a poor exchange, and the recent two years suggest even that return is not currently on offer.
If you want to take it further, the drawdown is the variable to work on rather than the entry. The volatility filter already proved that conditions matter more than level selection here, so the obvious next test is a second condition in the same direction, something that keeps you out of the stretches where the falls accumulate. Watch the drawdown column rather than the ending balance, because the ending balance has never been the problem with this one.
Also Read: Forex Market Structure
Frequently Asked Questions
Does Support And Resistance Trading Work In Forex?
In our test it made money and still could not be traded. The AFM Research Lab ran it across 2,869 trades and eight years of Daily data, finishing at $14,604 from $10,000, but with a 63.6 percent drawdown that almost nobody would sit through.
What Win Rate Does Support And Resistance Trading Need?
About 37.5 percent, based on winners averaging 1.70R against losers at 1.02R. The textbook version reached 38 percent, which is why it finished only slightly ahead after 2,869 trades.
Does A Volatility Filter Improve Support And Resistance Trading?
Substantially. Restricting entries to days when the 14 day ATR sat in the bottom 40 percent of its past year lifted expectancy from 0.01R to 0.10R and cut the worst drawdown from 63.6 percent to 34.5 percent, though it removed 56 percent of the trades to do it.
Why Do Support And Resistance Levels Fail?
A level holds when the orders resting there can absorb what arrives. In fast markets more arrives than the level can take, and price runs through a zone that would have held in calmer conditions, which is exactly what the volatility filter is screening out.
Which Forex Pairs Work Best For Support And Resistance?
EURGBP, EURNZD and USDZAR led our filtered results, but at around 112 to 133 trades each the margin of error is roughly 13R per 100 trades, so none of them is distinguishable from the average. Per-pair rankings on samples this size are noise.
Is Support And Resistance Trading Suitable For A Prop Firm Challenge?
Not as tested. This test risked 1 percent per trade and still produced a 34.5 percent drawdown in its best version, while most prop firm rules cap drawdown at 10 to 12 percent. Risk per trade would need to come down by roughly two thirds before the question is worth asking.