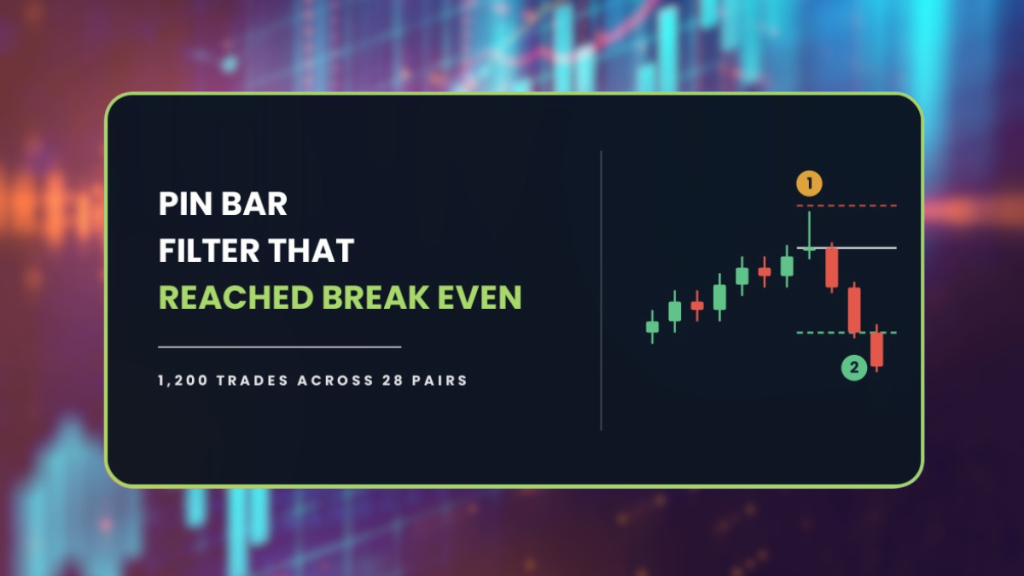
The pin bar strategy turned $10,000 into $2,937 across 1,200 trades. One volatility filter then cut the worst drawdown almost in half and shrank the loss per trade to almost nothing, which reads like a fix until you ask what almost nothing means. It means the strategy became a coin flip.
| About This Guide |
|---|
| This guide covers the pin bar strategy as the AFM Research Lab tested it, meaning a single candle whose wick runs twice the body and fills 60 percent of the range, formed at support or resistance, with the stop behind the wick tip and a 2R target, across 28 forex pairs and ten years of Daily data. You will finish knowing why a three point gap in win rate drained three quarters of the account, and why a filter landing on break even teaches more than one that fails outright. |
| Quick Answer |
|---|
| A pin bar is a single candle with a small body and one long wick, read as a rejection when it forms at a level traders already watch. In the AFM Research Lab the textbook version lost money across 1,200 trades on 28 forex pairs, ending at $2,937 from $10,000. A volatility filter halved the trade count and brought the result per trade to within a rounding error of zero. |
What Happened When We Tested The Pin Bar Strategy
Ten years, 28 pairs, 1,200 trades on the Daily chart. Here is where each version left a $10,000 account.
| Version | Start | End | Max drawdown | Trades |
|---|---|---|---|---|
| Textbook | $10,000 | $2,937 | 75.9% | 1,200 |
| Filtered | $10,000 | Below $10,000 | 41.0% | 617 |
Drawdown measures the fall from the highest point the account ever reached down to the lowest that followed it. At 75.9 percent the low put the textbook balance near $2,907, and it finished barely above that at $2,937, which tells you the account bled to its floor and stayed there rather than collapsing and recovering.
Thirty percent is the line we treat as the limit of what anyone can sit through. Past it people abandon the rules well before the rules get a chance to recover, so a version asking for 41 percent is still asking too much.
Every position risked 1 percent of the account and costs came out at 0.05 percent of the entry price per round trip. The window runs from June 9, 2016 to October 14, 2026.
A backtest applies fixed rules to prices that already happened, which lets it measure an edge but never the person trading it. It does not flinch at the fourteenth loss in a row, does not meet a spread that widened at the worst moment, and never talks itself out of the next signal.
Key Takeaways
- The textbook rules lost money across 1,200 trades, ending at $2,937 from a $10,000 start.
- Winners averaged 1.95R against losers at 1.05R, a payoff needing a 35 percent win rate. The setup delivered 32.
- The worst fall reached 75.9 percent, two and a half times what most accounts survive.
- A volatility filter cut that fall to 41.0 percent and halved the trade count from 1,200 to 617.
- The filtered version won 34 percent against a 34.2 percent requirement, an expectancy of minus 0.006R and a profit factor of 0.99.
- Four test periods split two profitable and two losing, spread from minus 0.10R to plus 0.09R.
What Is A Pin Bar?
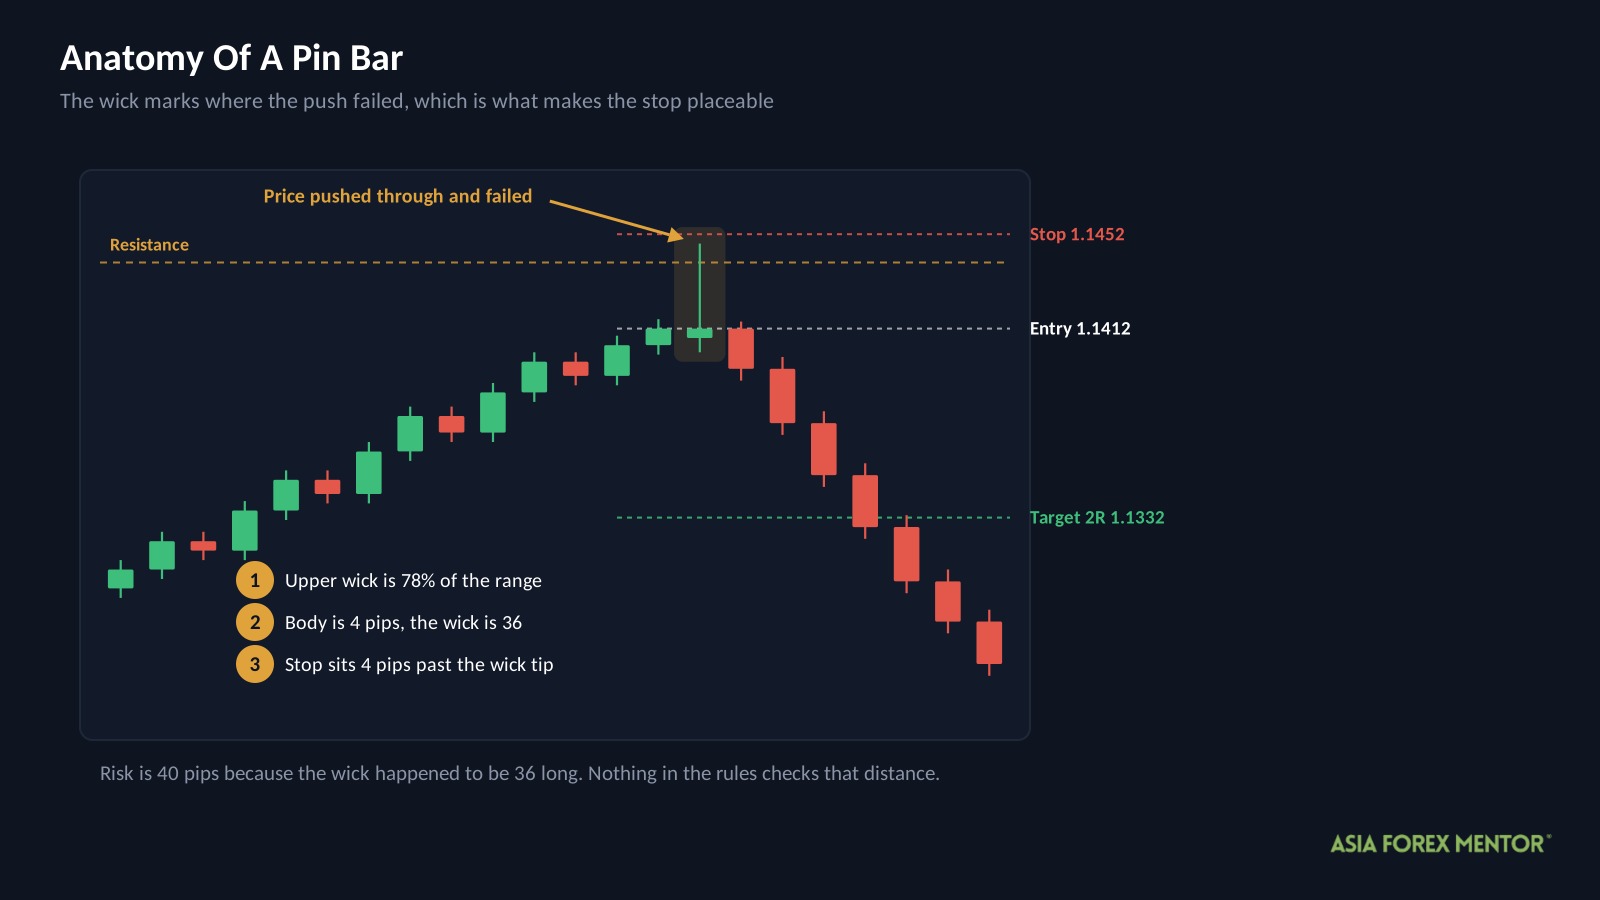
A pin bar is one candle with a small body and a single long wick. The body closes back near where the candle opened, which leaves the wick standing alone as the only record of what happened.
What the wick records is a failed push. Price drove into a level, found nothing waiting on the other side, and got sent back inside the same session.
The pattern earns its following from where that leaves your stop. The tip of the wick is the exact price at which the attempt died, so you can sit a stop just beyond it and know precisely what being wrong will cost.
That same precision is the weakness. A stop 30 pips away is a stop ordinary noise can reach long before your idea has had time to be right or wrong.
How Do Most Traders Trade It?
They mark the levels first, then wait for the candle to come to one.
| Rule | Setting |
|---|---|
| Chart | Daily |
| Pattern | Single candle, wick at least twice the body |
| Wick share | At least 60 percent of the candle’s total range |
| Location | At support or resistance |
| Stop loss | Just beyond the tip of the wick |
| Target | 2R |
| Time exit | Close after 10 bars |
Results below are written in R, where one R is the distance from entry to stop. Risking 1 percent of a $10,000 account makes 1R worth $100, so a 1.95R winner returned $195.
ATR measures the ground a pair typically covers in a session, and it is worth noticing that these rules never use it. The stop is set by whatever length the wick happened to be, not by how much the pair normally moves.
That is where the trade sizes come from. A long wick hands you a wide stop and a short one hands you a stop barely outside the daily noise, and nothing in the rules checks which of the two you are taking.
Why Did The Textbook Version Lose?
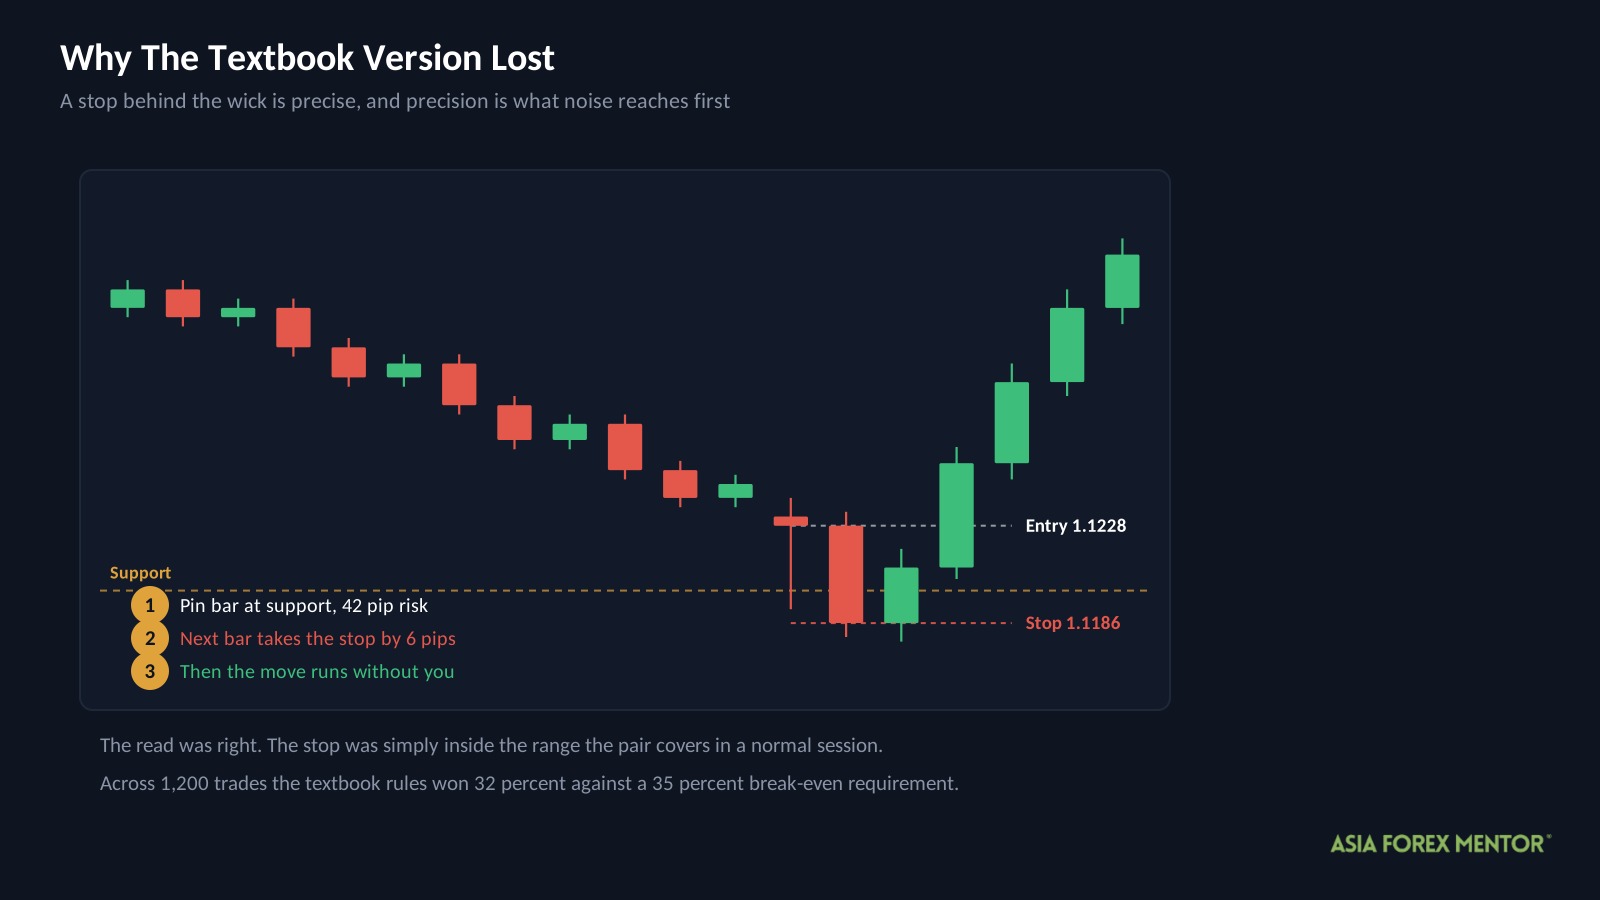
| Metric | Textbook |
|---|---|
| Trades | 1,200 |
| Win rate | 32% |
| Average win | +1.95R |
| Average loss | -1.05R |
| Expectancy | -0.090R |
| Profit factor | 0.87 |
| Yearly growth rate | -11.1% |
| Max drawdown | 75.9% |
| Ending balance from $10,000 | $2,937 |
Expectancy averages every closed trade together, winners and losers alike, into what a single attempt was worth. At minus 0.090R this setup handed back about a eleventh of each stake every time, regardless of what any individual trade did.
Profit factor divides everything won by everything lost. Under 1.00 describes a strategy paying out more than it takes in, and 0.87 leaves it 13 cents short on the dollar.
Yearly growth rate compresses the full decade into one annual pace. Minus 11.1 percent a year, compounded for ten years without a break, is the arithmetic that arrives at $2,937.
The payoff ratio was never the weak point. A 1.95R winner against a 1.05R loser puts the break-even bar at 35 percent, which means you can be wrong two times in three and still finish level.
The setup won 32 percent.
Three percentage points is a narrow miss, narrower than most failed systems manage. It was also enough. Across 1,200 trades those three points removed 71 cents of every dollar in the account.
What Did We Change?
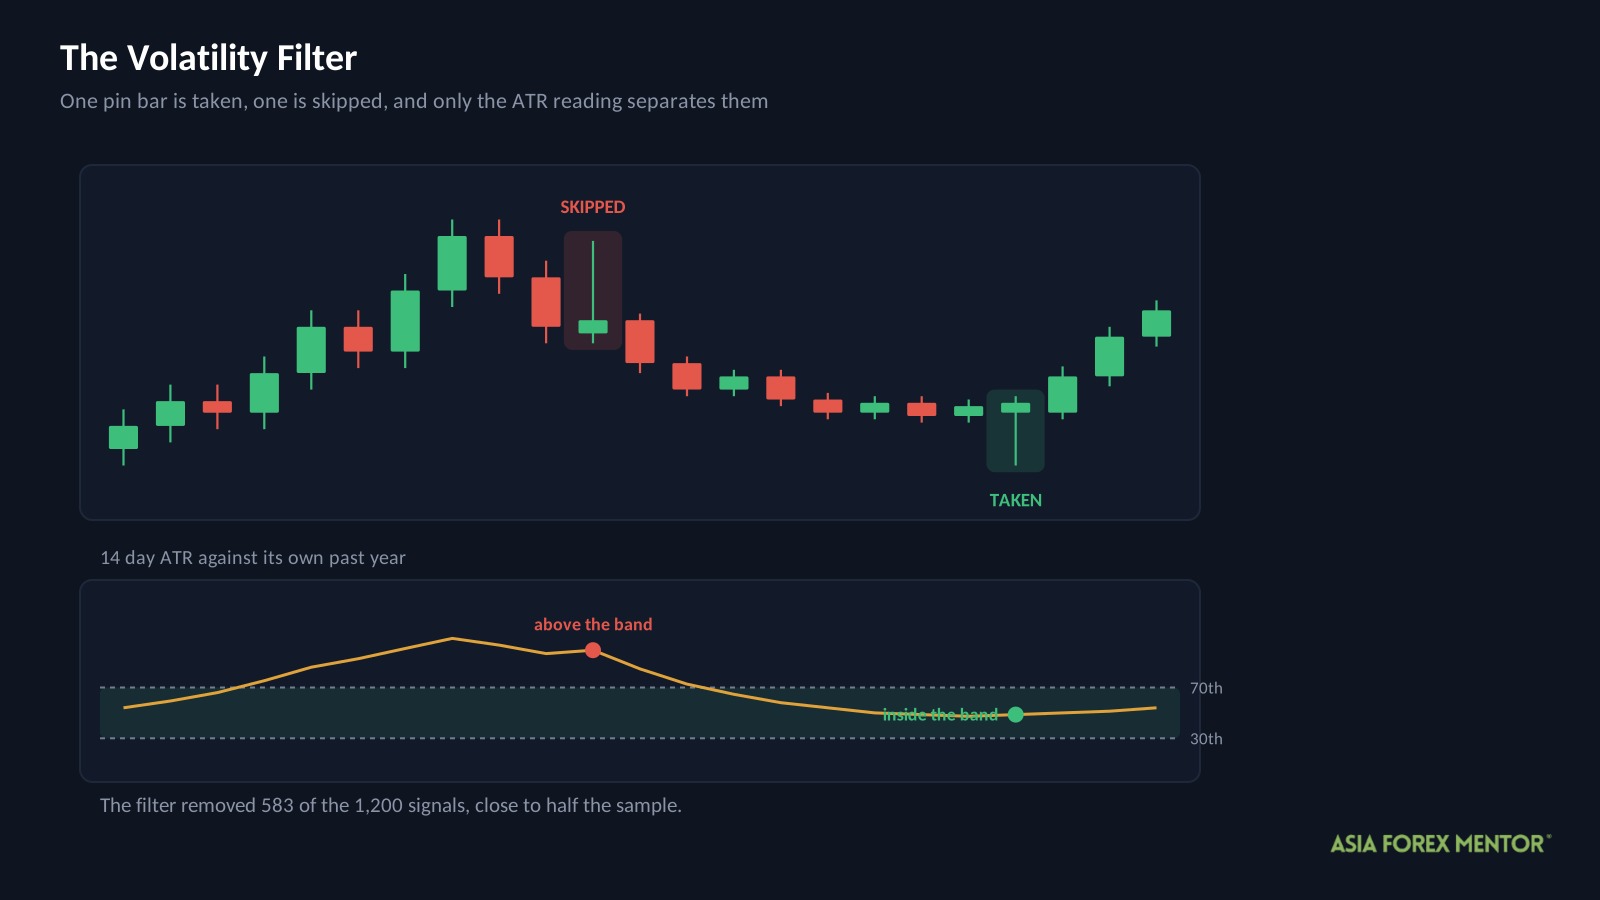
One rule: trade only when the market is moving at its ordinary pace.
| Filter | Condition | The idea behind it |
|---|---|---|
| Volatility | 14 day ATR between the 30th and 70th percentile of its past year | A rejection means nothing in a dead market, and a stop behind a wick means nothing in a violent one |
Both extremes work against the pattern, for opposite reasons. When volatility collapses the wick is thin trading rather than a genuine refusal, so there is no rejection there to trade. When volatility spikes the refusal may be real, but a stop 30 pips from entry gets taken out on the way to being right. Our guide to the volatility indicator covers reading those conditions on a chart.
The pattern rules, the stop and the target were untouched. The filter decides only whether a qualifying candle becomes a trade, and it removed 583 of the 1,200 signals.
Did The Filter Work?
Read the expectancy row against the win rate row before answering.
| Metric | Textbook | Filtered |
|---|---|---|
| Trades | 1,200 | 617 |
| Win rate | 32% | 34% |
| Average win | +1.95R | +2.02R |
| Average loss | -1.05R | -1.05R |
| Max drawdown | 75.9% | 41.0% |
| Profit factor | 0.87 | 0.99 |
| Ending balance from $10,000 | $2,937 | Below $10,000 |
| Expectancy | -0.090R | -0.006R |
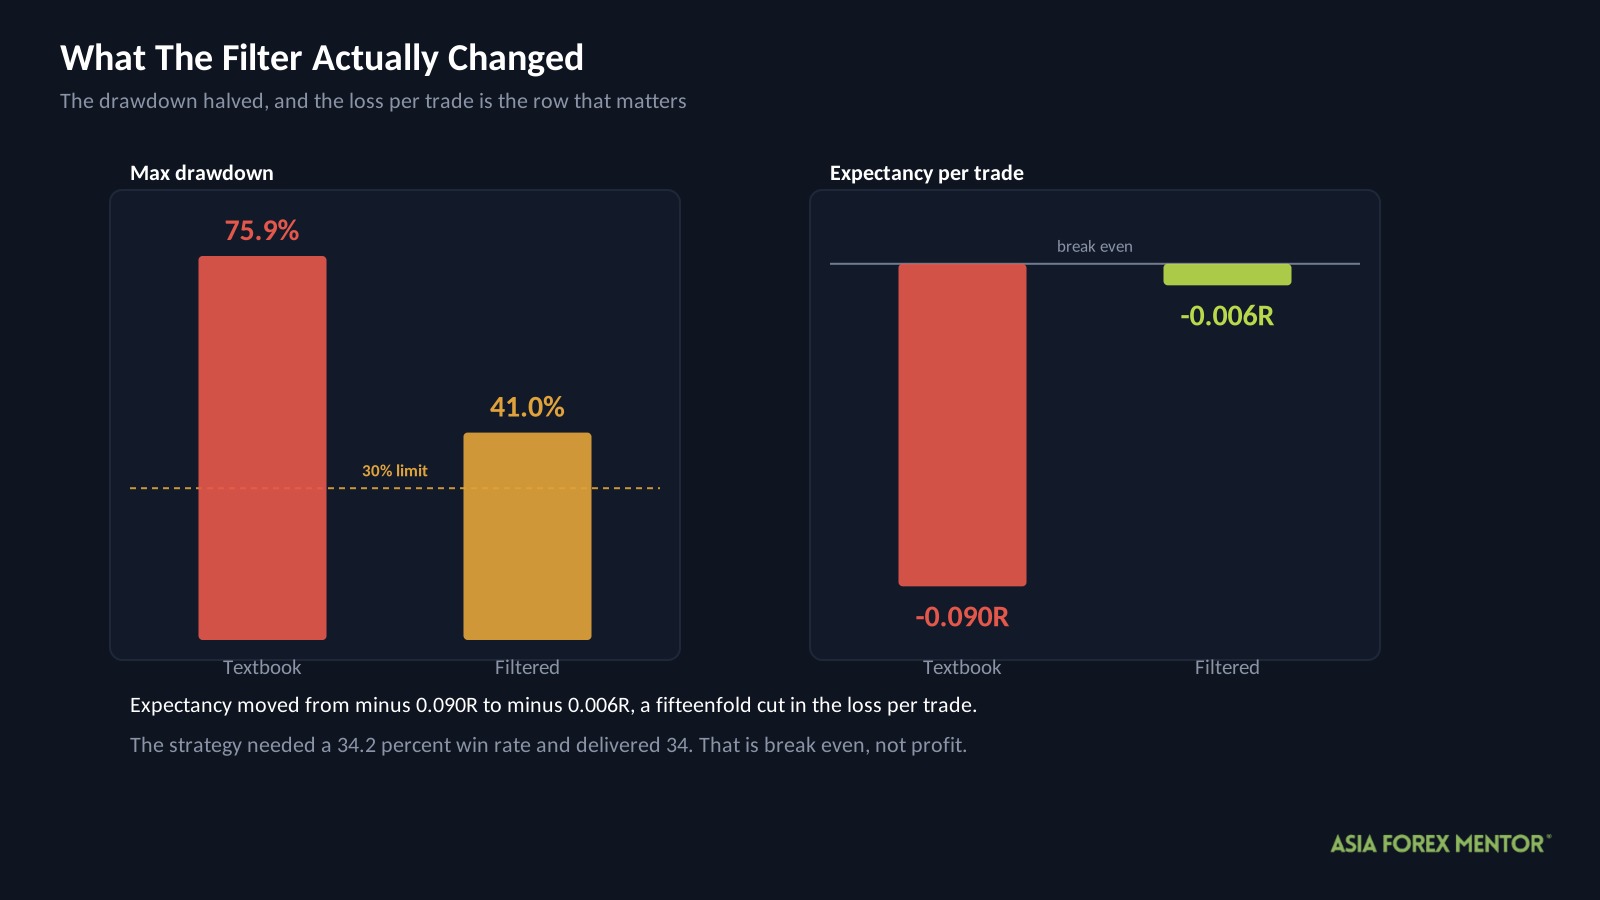
This is the first filter in the series that improved the trades themselves rather than simply taking fewer of them. Expectancy moved from minus 0.090R to minus 0.006R, a fifteenfold reduction in the loss per trade, and it got there by lifting the win rate two points and the average winner by 0.07R at the same time.
Now run the break-even test on the new figures. An average win of 2.02R against an average loss of 1.05R sets the bar at 34.2 percent, and the filtered version won 34.
So the strategy needed 34.2 and delivered 34. Measured per hundred trades it lost 0.6R against the textbook version’s 9.0R, and the profit factor landed at 0.99.
Those numbers do not describe a losing strategy. They describe one standing on its break-even line, close enough that ten years of data cannot say which side of that line the real edge falls on.
Did It Hold In Every Period?
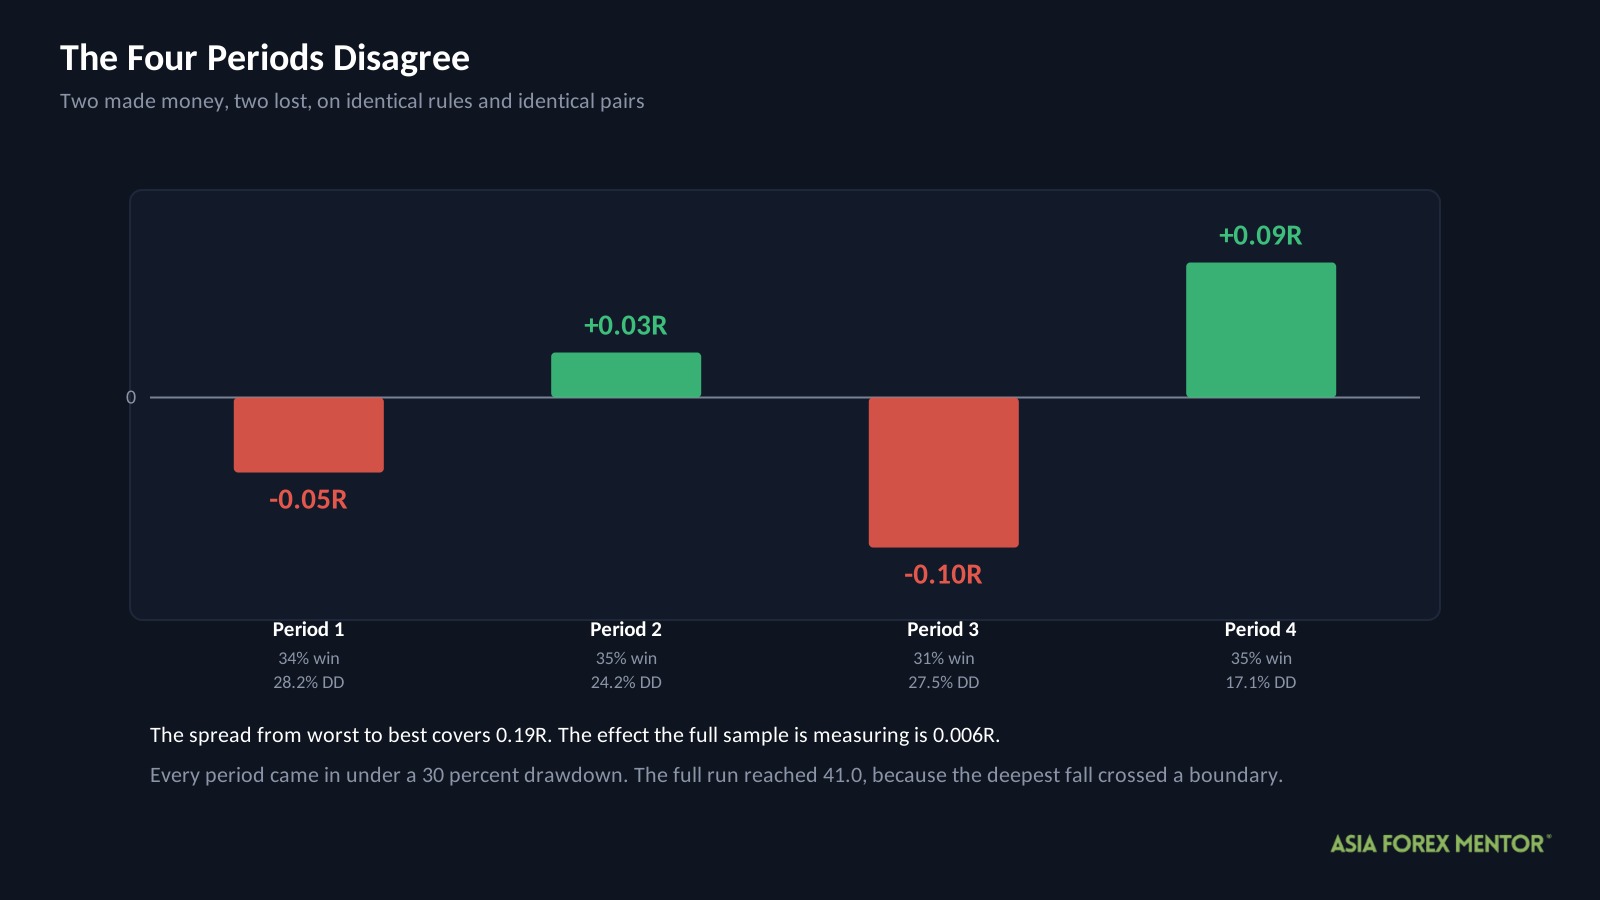
The ten years split into four stretches.
| Period | Filtered win rate | Filtered expectancy | Filtered drawdown |
|---|---|---|---|
| 1 | 34% | -0.05R | 28.2% |
| 2 | 35% | +0.03R | 24.2% |
| 3 | 31% | -0.10R | 27.5% |
| 4 | 35% | +0.09R | 17.1% |
Two stretches made money and two lost. The spread from worst to best covers 0.19R, which is thirty times the size of the 0.006R effect the full sample is trying to measure.
Picture two traders running the same rules on the same pairs. The one who happened to trade period four finished positive with a 17 percent worst fall and would tell you pin bars work. The one who ran period three finished negative with a deeper fall and would tell you they do not. Both are reporting honestly, and neither holds the sample to be right.
There is a second reading in that table most people walk straight past. Every individual stretch came in under 30 percent while the full run reached 41.0. Both figures are correct. The deepest fall simply started inside one stretch and ended inside the next, so cutting the history into four pieces cut that fall in half and hid it. Every walk forward table understates real drawdown for this reason, ours included.
What About The Pairs?
EURJPY produced the highest win rate in the filtered version at 57 percent, with EURUSD behind it at 53.
Hold those against the sample before reading anything into them. The filtered version took 617 trades across 28 pairs, so an even spread leaves about 22 each, and at 22 trades a win rate swings roughly 10 percentage points either side from chance alone. A 57 percent result sits two of those swings out, and across 28 pairs you should expect one or two to land that far from the average with no cause behind it at all.
That is what a ranked pair list usually is: one sample divided 28 ways with the luckiest slice promoted to a finding. We include it because leaving it out would be dishonest, and because the same arithmetic undoes most of the pair rankings published anywhere else.
The number to ask for is the trade count behind the pair, never the win rate on its own. Under a hundred and there is nothing there to act on.
What Did A Winning Trade Look Like?
| Detail | Value |
|---|---|
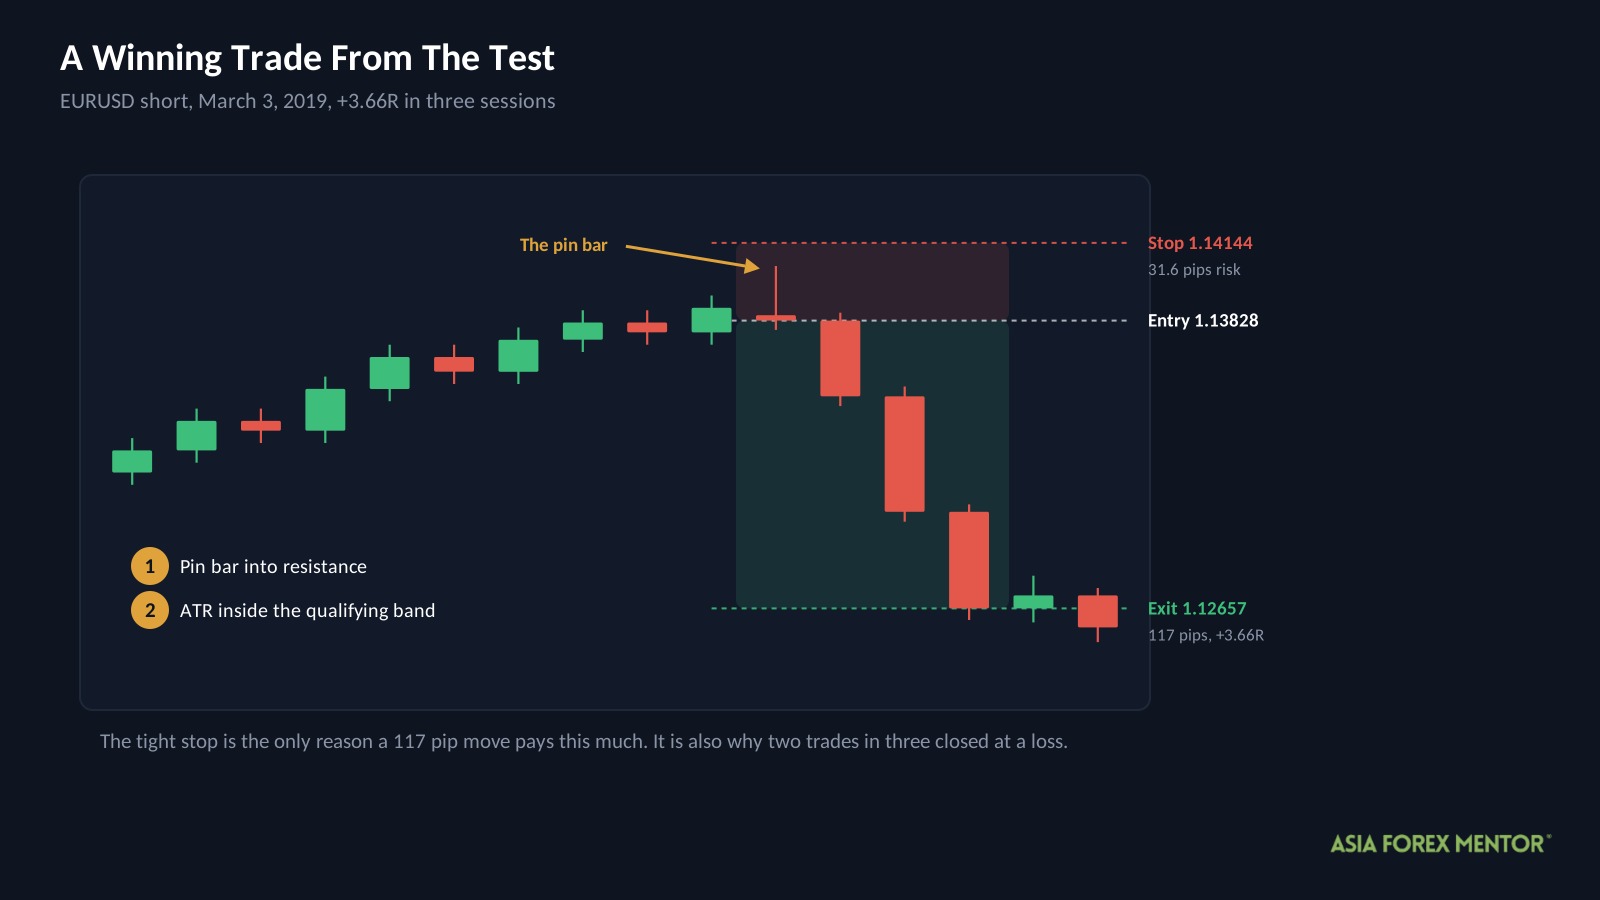
| Pair and chart | EURUSD, Daily |
| Direction | Short |
| Entry | March 3, 2019 at 1.13828 |
| Stop | 1.14144 |
| Exit | 1.12657 |
| Result | +3.66R in 3 bars |
A pin bar formed into resistance with the 14 day ATR inside the qualifying band, and the stop went just above the wick at 31.6 pips.
Price then covered 117 pips in three sessions. That ratio is what the pattern exists to capture, and the tight stop is the only reason a 117 pip move pays this much.
It also paid getting on for twice the filtered version’s average winner of 2.02R. Two trades in three closed at the stop, and no quantity of trades like this one moves a strategy sitting two tenths of a point below its break-even requirement.
What Should You Take From This?
One habit transfers out of this test, and it will keep you out of a trap that catches experienced traders.
Recalculate your break-even win rate every time you touch a rule. Divide the average loss by the sum of the average win and the average loss.
Here it is in one line: the bar you have to clear moves whenever you change your stop or your target. It is not a property of your strategy, it is a property of your current settings.
That is exactly what happened here. Tightening the entry conditions lifted the average winner from 1.95R to 2.02R, which pulled the requirement down from 35.0 percent to 34.2. A meaningful part of the improvement came from lowering the bar rather than from clearing it.
The trap runs the other way too, and that direction is far more common. Traders shrink a target so it gets hit more often, watch the win rate climb, and never register that the same change raised the bar by just as much. The win rate went up and the strategy got worse.
Also Read: Candlestick Patterns Cheat Sheet
Is The Pin Bar Strategy Worth Your Time?
Not on its own, and the drawdown settles that without needing the expectancy at all.
The textbook rules lost money across 1,200 trades, ending at $2,937 with a 75.9 percent drawdown.
A 35 percent win rate was needed and 32 arrived, and the filter closed nearly all of that gap.
The filtered version finished on minus 0.006R per trade with a 41 percent worst fall, which is break even at a price nobody should pay.
The pattern itself is not what failed. A long wick genuinely does record a push that found nothing, and learning to read that is worth your time whatever you end up trading.
What failed is everything the rules leave out. One candle, a stop behind a wick of whatever length it happened to be, and nothing anywhere checking whether the wider market agrees with the direction. That is a signal rather than a strategy, and the result shows it is a signal worth roughly zero when traded alone.
If you want to keep working on this one, direction is the variable to change. The filter here only addressed volatility, so a trend condition is the obvious next test, and the number to watch is whether the win rate clears 34.2 rather than whether the equity curve looks healthier. Our breakdown of how to spot trend reversals in trading is a reasonable place to start.
Frequently Asked Questions
Does The Pin Bar Strategy Work In Forex?
Not in the form it is usually taught. The AFM Research Lab ran it across 1,200 trades and ten years of Daily data, and $10,000 finished at $2,937 with a 75.9 percent drawdown.
What Is A Pin Bar In Trading?
It is a single candle with a small body and one long wick, where the wick records price driving into a level and being pushed straight back. Traders read it as a rejection and look for it at support or resistance.
What Win Rate Does The Pin Bar Strategy Need?
Thirty-five percent, based on winners averaging 1.95R against losers at 1.05R. The tested version reached 32 percent, and those three points removed three quarters of the account across 1,200 trades.
Did The Volatility Filter Improve Pin Bar Trading?
More than any filter in this series so far. Holding entries to days when the 14 day ATR sat between the 30th and 70th percentile of its past year lifted expectancy from minus 0.090R to minus 0.006R, which is break even rather than profit.
Which Forex Pairs Work Best For Pin Bars?
EURJPY led the filtered version at a 57 percent win rate with EURUSD at 53, though an even spread across 28 pairs leaves only about 22 trades each. At that count a win rate swings roughly 10 points from chance alone.
How Often Does The Pin Bar Setup Trade?
About 120 times a year across all 28 pairs before filtering, which is roughly four trades per pair annually. The volatility filter cuts that close to half.