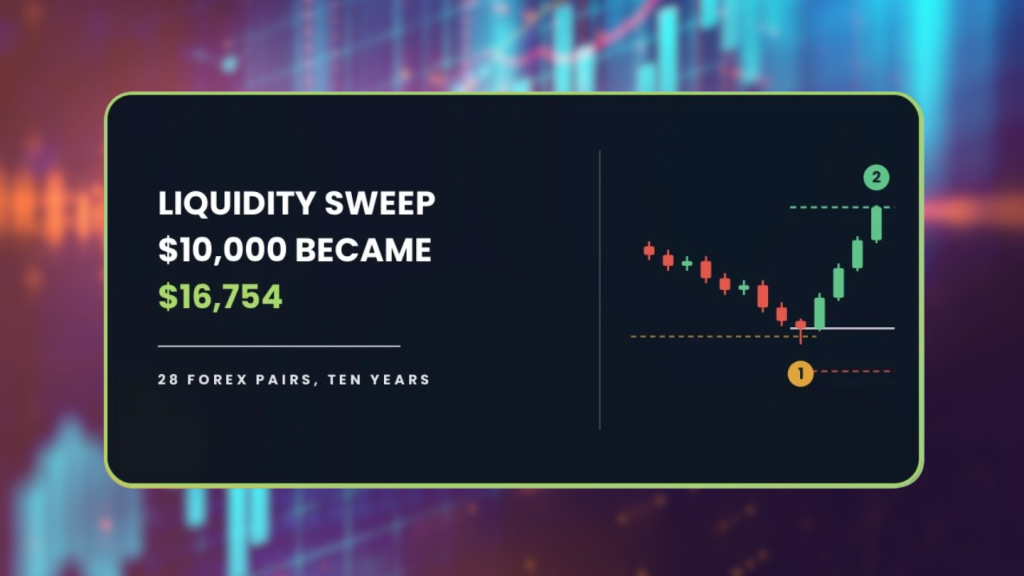
The liquidity sweep strategy made $6,754 over ten years and almost nothing over the last seven. Same backtest, same 28 pairs, same rules. The only thing that changed was the date you started.
| About This Guide |
|---|
| This guide covers the liquidity sweep trading strategy as the AFM Research Lab tested it, meaning a sweep beyond a recent swing high or low, confirmed by a close back inside, entered with an ATR-based stop and a 2R target and gated by a minimum ADX reading, across 28 forex pairs and ten years of Daily data. You will finish knowing why the textbook version missed break even by one point, what five tightened inputs changed, and why a ten year profit can still describe a strategy that stopped working seven years ago. |
| Quick Answer |
|---|
| A liquidity sweep is price pushing beyond a swing high or low, triggering the stop orders resting there, then reversing. In the AFM Research Lab the textbook version lost money across 1,706 trades on 28 forex pairs, ending at $6,725 from $10,000. A tightened version finished at $16,754, with nearly all of that gain landing in the first two and a half years. |
What Happened When We Tested The Liquidity Sweep Strategy
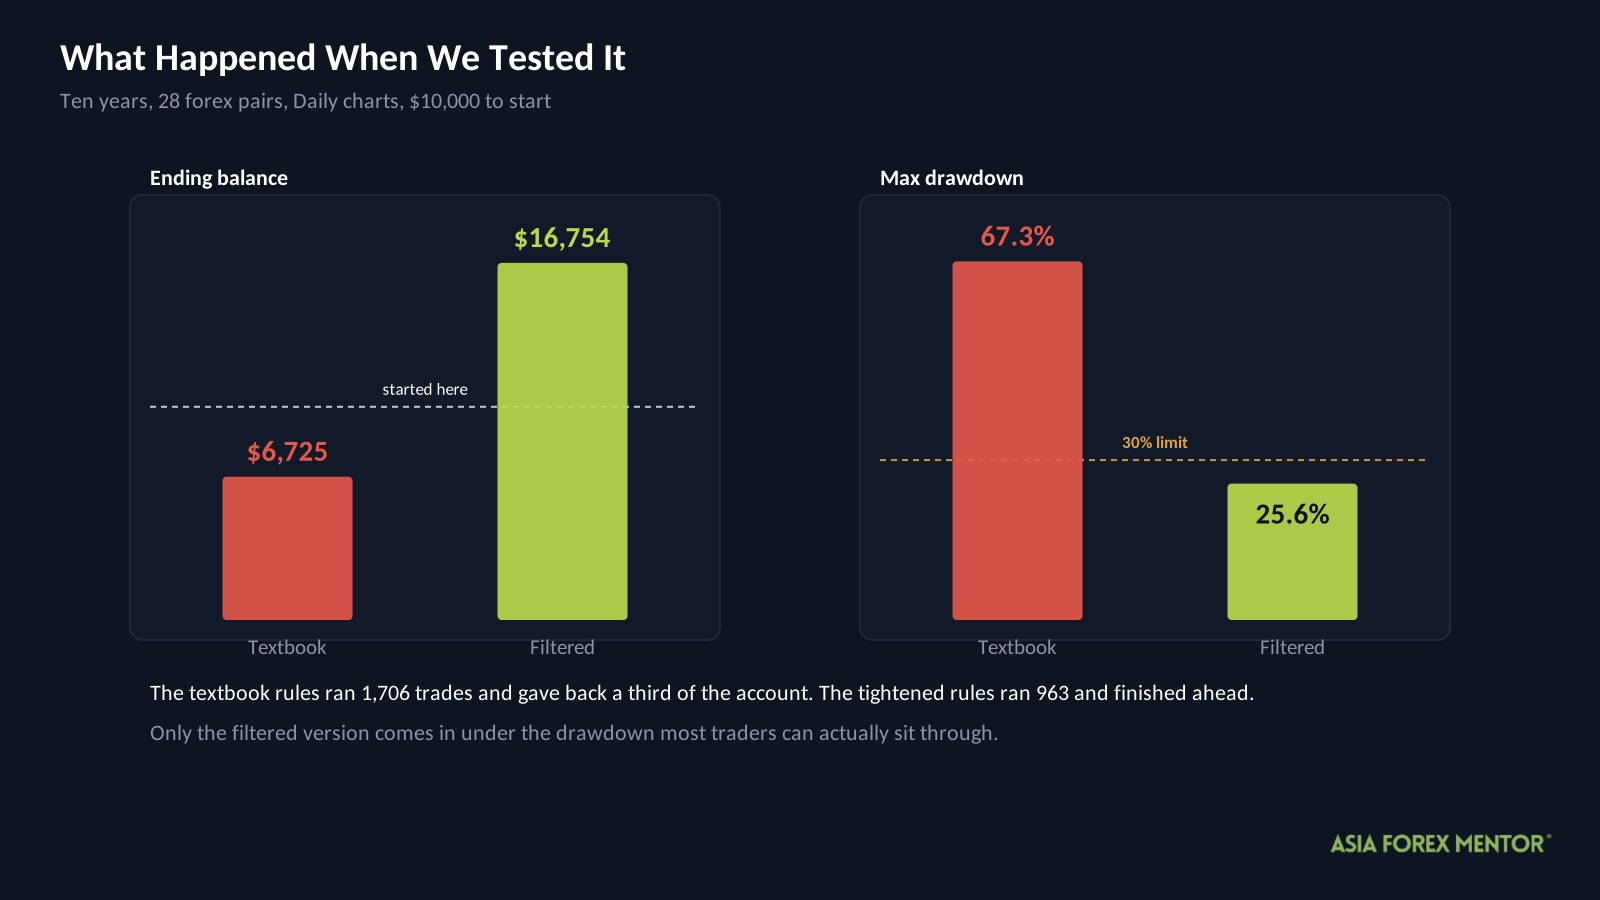
Ten years, 28 pairs, 1,706 trades on the Daily chart. Here is where each version left a $10,000 account.
| Version | Start | End | Max drawdown | Trades |
|---|---|---|---|---|
| Textbook | $10,000 | $6,725 | 67.3% | 1,706 |
| Filtered | $10,000 | $16,754 | 25.6% | 963 |
Drawdown is the fall from the highest point an account reached to the lowest that followed. The textbook version’s low put the balance near $3,583. The filtered version dipped to about $9,895, which is below where it started, despite finishing at $16,754.
Hold onto that second figure. An account that ends at $16,754 but once sat below its own starting balance did not climb steadily, and the reason is the whole story of this test.
Thirty percent is the level past which most people stop following their rules. The textbook version at 67.3 percent is not tradable as written. The filtered version at 25.6 percent clears that line.
Every position risked 1 percent of the account and costs came out at 0.05 percent of the entry price per round trip. The window runs from July 4, 2016 to November 8, 2026.
A backtest runs fixed rules over prices that already happened. It cannot reproduce a fill that slipped, a spread that widened into a news release, or the decision to stop trading halfway through a flat year.
Key Takeaways
- The textbook rules lost money across 1,706 trades, ending at $6,725 with a 67.3 percent worst fall.
- Winners averaged 1.56R against losers at 1.00R, a payoff needing a 39.1 percent win rate. The setup delivered 38.
- Five tightened inputs cut the trade count to 963, lifted expectancy to plus 0.06R and brought the worst fall to 25.6 percent.
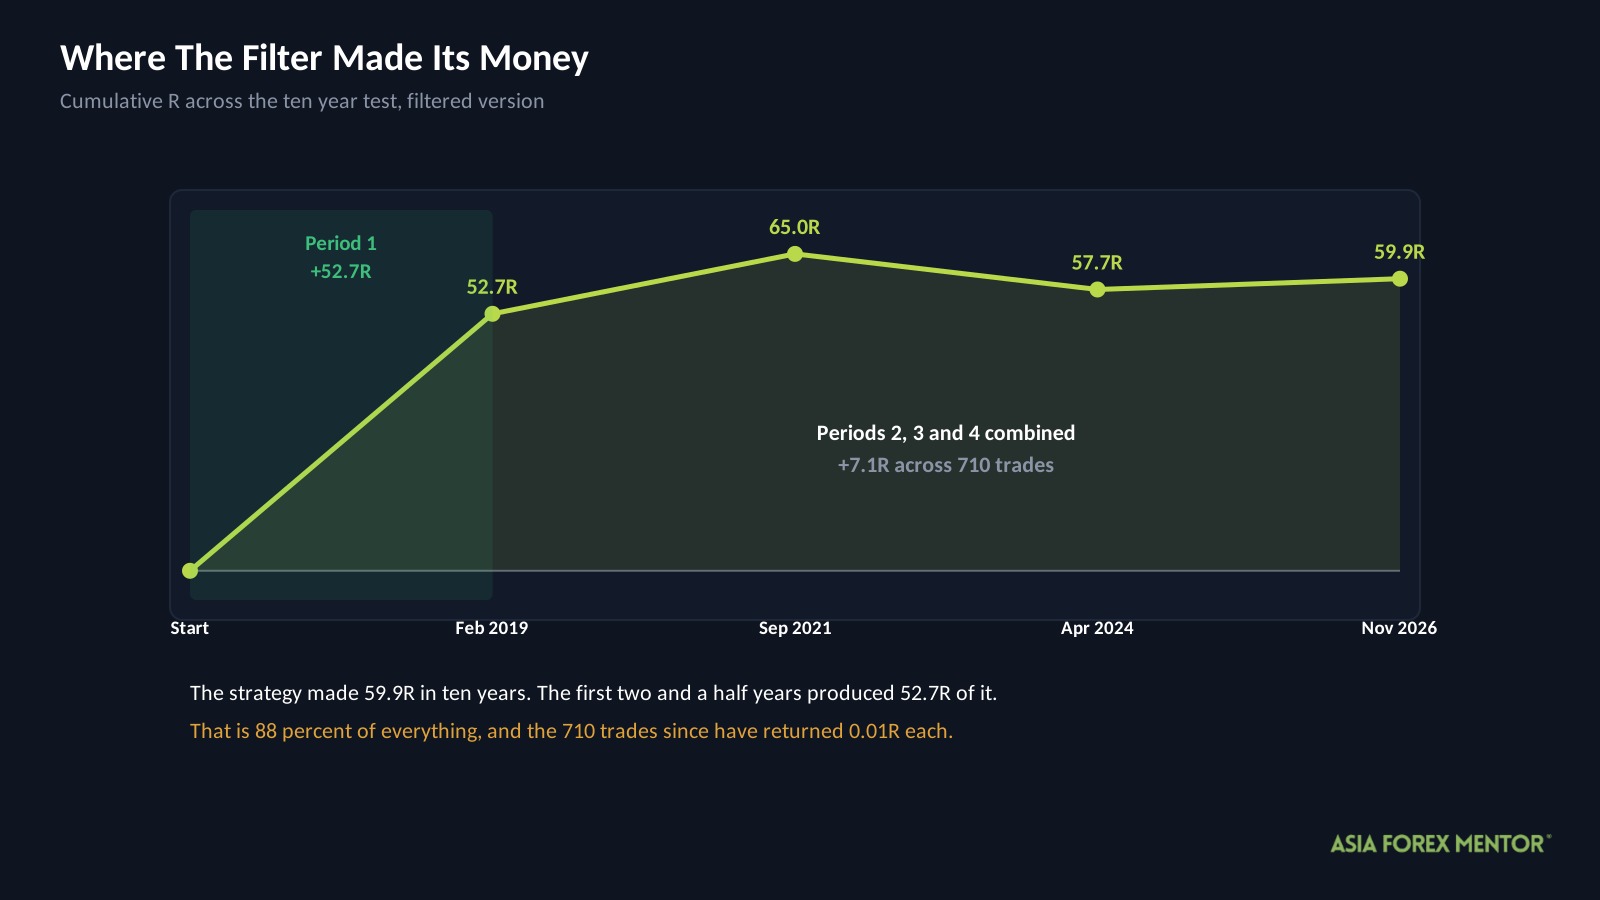
- Across four test periods, the first produced 52.7R of the 59.9R the strategy made in total, which is 88 percent of everything.
- The remaining 710 trades, covering July 2019 onward, produced 7.1R between them. That is 0.01R per trade.
- The filtered settings were chosen by searching the full ten years, so the period results are a consistency check rather than an independent test.
What Is A Liquidity Sweep?
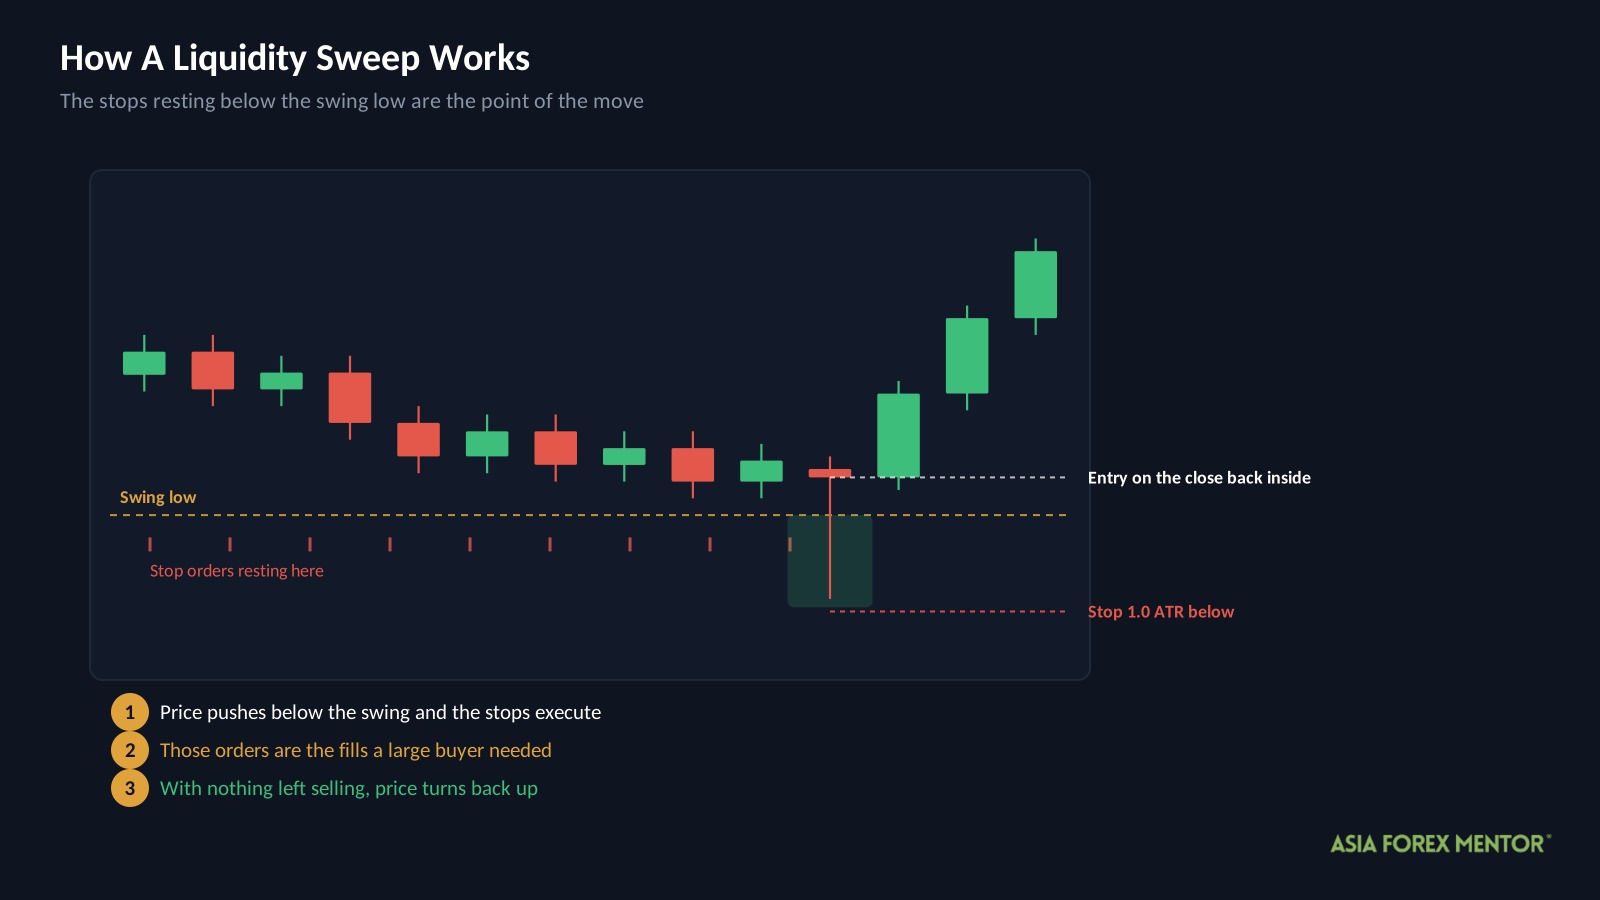
A liquidity sweep is price running past an obvious level, taking the orders waiting there, then turning around.
The levels are obvious because everyone marks them the same way. A swing high is where price last turned down, a swing low is where it last turned up, and traders place protective stops just beyond both. Those stops are resting orders, and resting orders are what a large participant needs in order to fill size without moving the market against themselves.
So the sequence is mechanical rather than mystical. Price reaches past the swing, the stops sitting there execute, that execution provides the fills, and with the orders absorbed there is nothing left pushing price in that direction. It turns.
The trade is the turn. You are not trading the break, you are trading the failure of the break, which is what separates this from a breakout entry. Our guide to forex market structure covers identifying the swing points these setups depend on.
How Do Most Traders Trade It?
They mark the recent swing, wait for price to exceed it, and enter only once price closes back inside.
| Rule | Setting |
|---|---|
| Chart | Daily |
| Lookback | 20 bars to find the swing high and low |
| Sweep confirmation | Price exceeds the swing by at least 0.1 ATR |
| Level tolerance | 0.3 ATR when matching the swing level |
| Trend gate | ADX of 15 or higher |
| Stop loss | 1.5 ATR from entry |
| Target | 2R |
Results below are written in R, where one R is the distance from entry to stop. Risking 1 percent of a $10,000 account makes 1R worth $100, so a 1.56R winner returned $156.
ATR measures how far a pair typically travels in a session, which is what lets the stop widen on a volatile pair and tighten on a calm one instead of using a fixed pip count everywhere.
ADX measures how strongly a market is trending, on a scale running from zero upward, and it was devised by Welles Wilder. It says nothing about direction. A reading of 15 is a low bar, which is deliberate: the gate is there to keep you out of markets going nowhere, not to demand a strong trend.
Those conditions produced 1,706 signals in ten years across 28 pairs, which works out to about 164 a year, or roughly six per pair annually.
Why Did The Textbook Version Lose?
| Metric | Textbook |
|---|---|
| Trades | 1,706 |
| Win rate | 38% |
| Average win | +1.56R |
| Average loss | -1.00R |
| Expectancy | -0.03R |
| Profit factor | 0.96 |
| Yearly growth rate | -3.7% |
| Max drawdown | 67.3% |
| Ending balance from $10,000 | $6,725 |
Expectancy averages every closed trade into what a single attempt was worth. At minus 0.03R this version handed back about three cents of every dollar risked, which sounds survivable and compounds into something that is not.
Profit factor divides everything won by everything lost. At 0.96 the strategy returned 96 cents on the dollar, which is close enough to even that most traders would blame their execution rather than the rules.
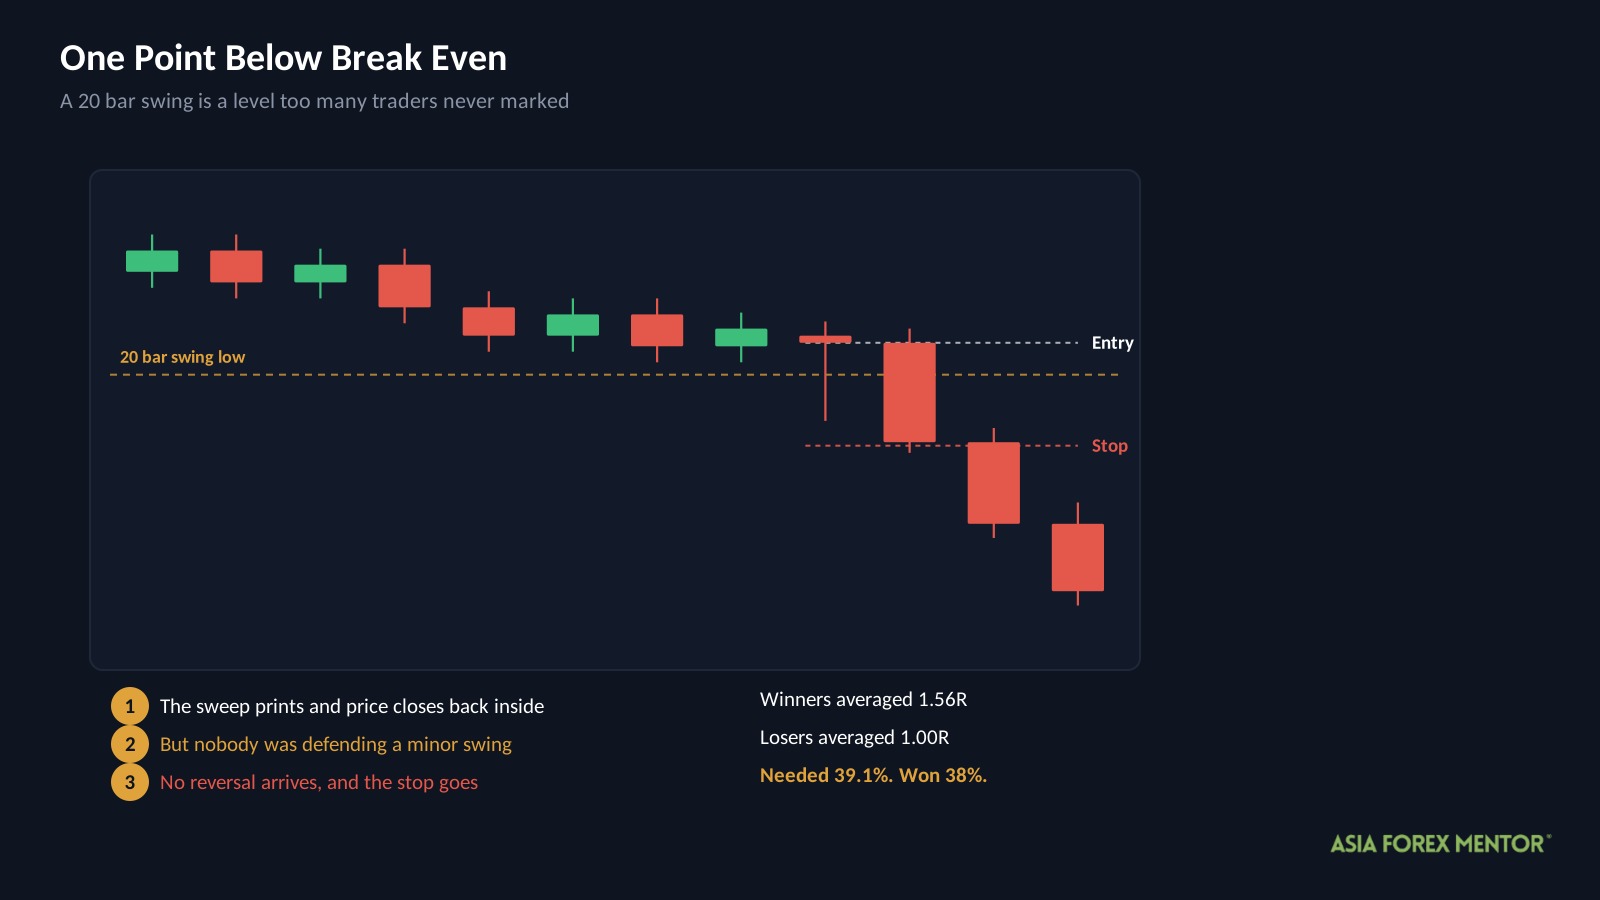
Now the arithmetic that explains it. A 1.56R winner against a 1.00R loser puts the break-even bar at 39.1 percent.
The setup won 38 percent.
A little over one percentage point. That gap, repeated 1,706 times, is what took the account to $6,725 and put it through a 67.3 percent fall on the way.
The payoff structure was not the problem. A winner worth more than one and a half times a loser is a perfectly workable shape. The entry simply was not selective enough to find winners often enough, and that points at the rules governing which sweeps qualify.
What Did We Change?
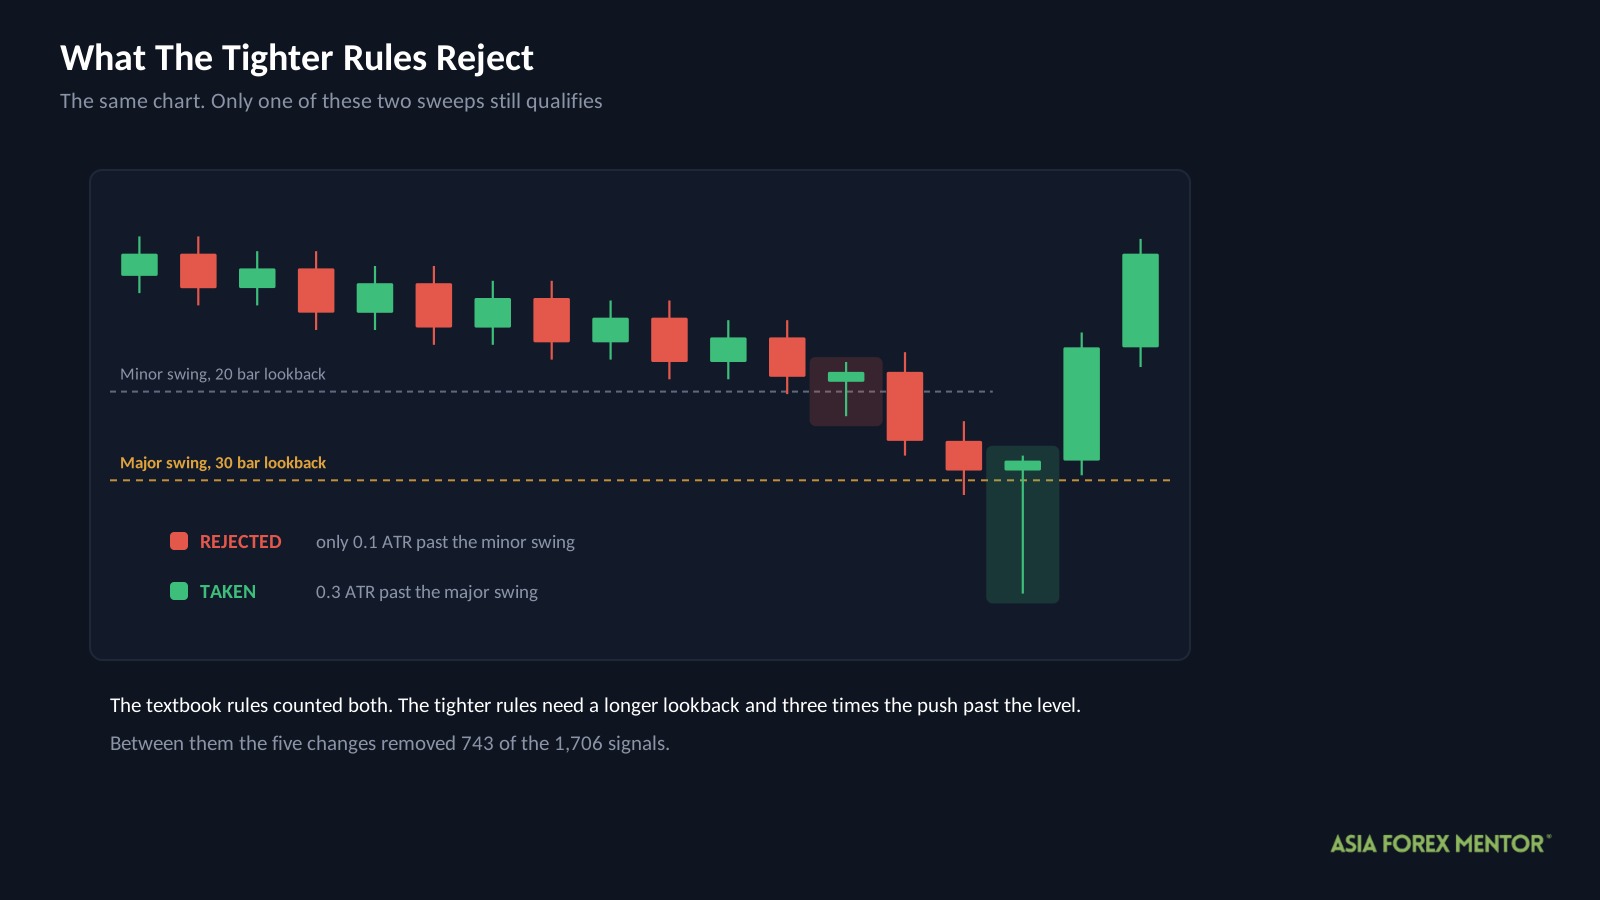
The entry logic stayed the same. The Lab tightened five of the inputs that decide which sweeps count.
| Input | Textbook | Filtered | The idea behind it |
|---|---|---|---|
| Lookback | 20 bars | 30 bars | A longer window finds swings that more traders are watching |
| Level tolerance | 0.3 ATR | 0.5 ATR | A looser match treats nearby highs as one level rather than several |
| Sweep confirmation | 0.1 ATR | 0.3 ATR | Price must push three times further past the swing to count |
| Stop loss | 1.5 ATR | 1.0 ATR | A tighter stop raises the reward against the risk on every trade |
| Trend gate | ADX 15 | ADX 20 | A higher bar skips the flattest conditions |
The reasoning behind all five is the same. A sweep only means something if the level was worth defending, and a minor swing that nobody was watching attracts no stops worth collecting. Every change makes the level harder to qualify.
The target stayed at 2R and the entry trigger was untouched. Between them the five changes removed 743 of the 1,706 signals.
The settings were chosen by searching the full ten years for the combination that scored best, which means they were fitted to the data they were then measured on.
Did The Filter Work?
Every number improved, and the ending balance more than doubled the textbook result.
| Metric | Textbook | Filtered |
|---|---|---|
| Trades | 1,706 | 963 |
| Win rate | 38% | 40% |
| Average win | +1.56R | +1.66R |
| Average loss | -1.00R | -1.01R |
| Max drawdown | 67.3% | 25.6% |
| Profit factor | 0.96 | 1.10 |
| Ending balance from $10,000 | $6,725 | $16,754 |
| Expectancy | -0.03R | +0.06R |
The filtered version clears its break-even bar. With winners at 1.66R and losers at 1.01R the requirement is 37.8 percent, and it won 40. The worst fall came in under the 30 percent ceiling. On a full ten year run that is a genuine result.
Note what did the work, though. The win rate moved two points and the average winner moved 0.10R. Neither is dramatic. Most of the improvement came from cutting the stop from 1.5 ATR to 1.0 ATR, which made every loss smaller without needing the entries to get better.
That is worth understanding before the next section, because a result built on smaller losses rather than better entries behaves differently when conditions change.
Did It Hold In Every Period?
The ten years split into four stretches. The settings were chosen using all of it, so these are a consistency check rather than a test on anything unseen.
| Period | Trades | Win rate | Expectancy | Total R | Max drawdown |
|---|---|---|---|---|---|
| Jul 2016 to Feb 2019 | 251 | 45% | +0.21R | +52.7R | 15.5% |
| Feb 2019 to Sep 2021 | 245 | 40% | +0.05R | +12.3R | 17.4% |
| Sep 2021 to Apr 2024 | 244 | 37% | -0.03R | -7.3R | 18.8% |
| Apr 2024 to Nov 2026 | 221 | 38% | +0.01R | +2.2R | 20.3% |
Add the right-hand column. The strategy made 59.9R across the whole ten years. The first period produced 52.7R of it.
That is 88 percent of everything, earned in the first two and a half years.
Now take that period out and look at what remains. The other 710 trades, running from February 2019 to November 2026, produced 7.1R between them. Divided across those trades it comes to 0.01R each, which after costs is indistinguishable from doing nothing at all for seven and a half years.
The equity path agrees. The account dipped to about $9,895 at its lowest, below where it started, despite finishing at $16,754. An account cannot both end 67 percent up and visit a point below its starting balance unless the gains arrived early and were largely handed back before being slowly rebuilt.
Watch the right-hand column too. The drawdowns get steadily worse across the four periods, from 15.5 percent to 20.3, while the returns fall away. The strategy is not simply flat in recent years. It is flat and rougher.
What About The Pairs?
USDCAD led the filtered results at 0.64R per trade, with CADJPY at 0.62R and GBPCHF at 0.48R. Fourteen of the 28 pairs came in negative.
Before reading anything into that, check the sample behind it. 963 trades across 28 pairs averages about 34 each, and at 34 trades the margin of error on expectancy is roughly 0.22R. So USDCAD’s 0.64R carries an honest range of about 0.20R to 1.08R.
That is not nothing. It is also nowhere near precise enough to decide which pairs to trade, and the fourteen negative pairs are simply the half that came in below the middle, which is what half of anything does.
The detail that settles it sits in the trade section below. AUDCAD produced the single largest win in the entire test and finished the ten years at minus 0.05R per trade. One spectacular result and an overall loss, on the same pair, in the same sample.
Our guide to ICT order blocks covers the wider family of liquidity concepts these setups come from.
What Did A Winning Trade Look Like?
| Detail | Value |
|---|---|
| Pair and chart | AUDCAD, Daily |
| Direction | Long |
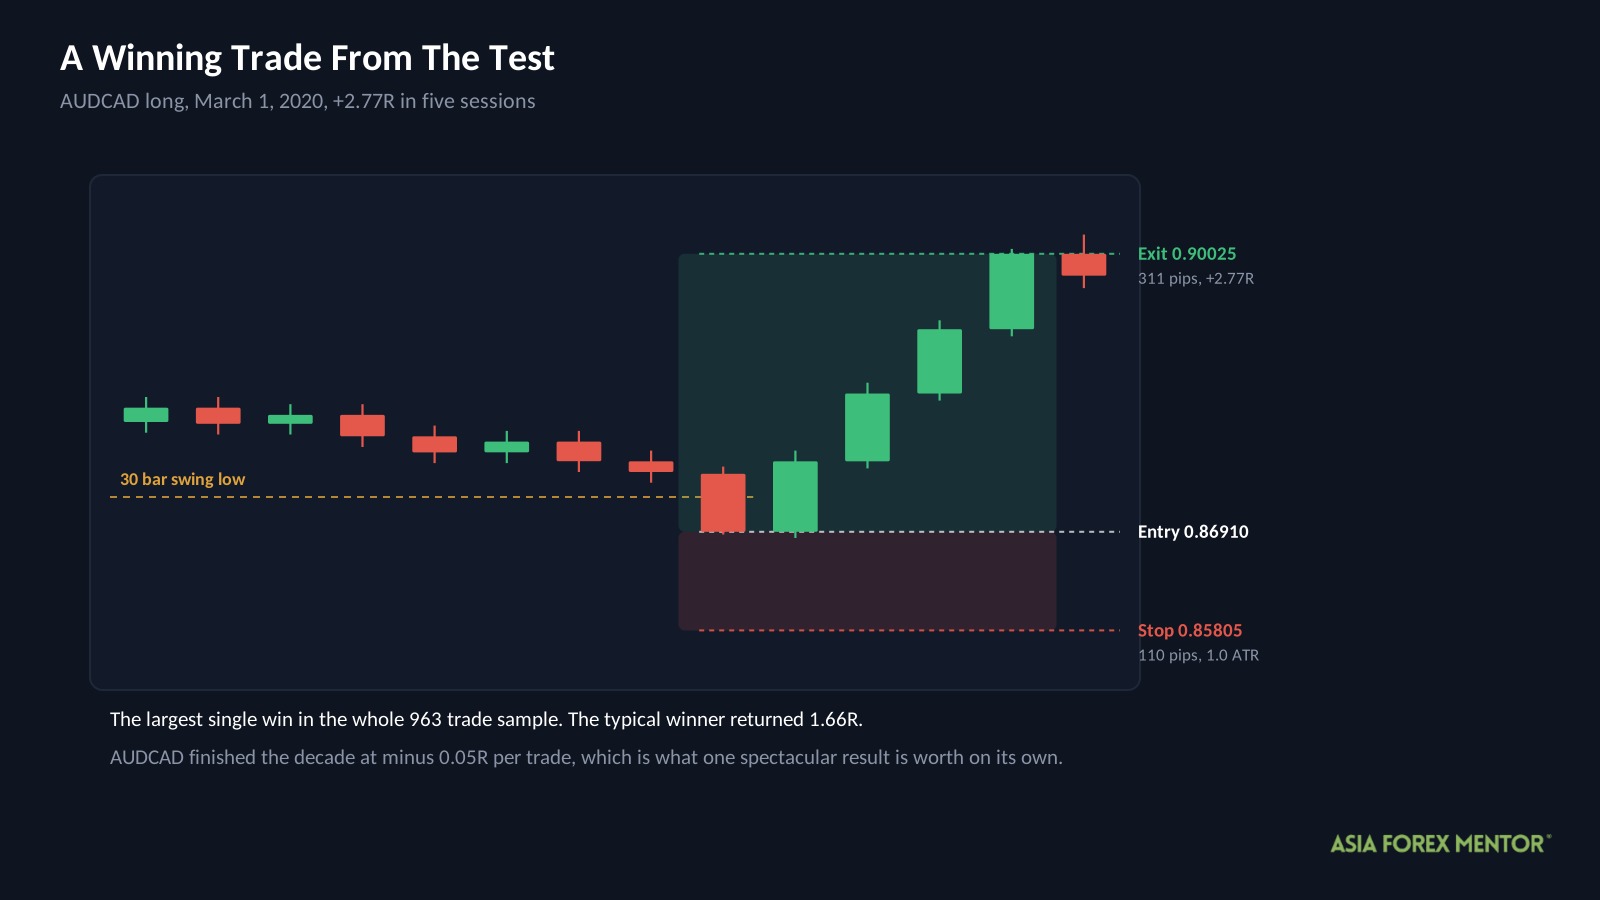
| Entry | March 1, 2020 at 0.86910 |
| Stop | 0.85805 |
| Exit | March 8, 2020 at 0.90025 |
| Result | +2.77R in 5 bars |
AUDCAD had pushed below its 30 bar swing low and closed back above it, with ADX above 20. The stop went 110 pips below entry, which was 1.0 ATR in a week when volatility was climbing sharply.
Price then covered 311 pips in five sessions.
This was the largest single win in the whole 963 trade sample, and it is the outlier in every sense. The typical winner here returned 1.66R, and three trades in five closed at a loss. The pair that produced it finished the decade at minus 0.05R per trade.
What Should You Take From This?
One habit transfers out of this test, and almost nobody applies it.
When a backtest shows a profit, ask when the profit was made. Split the history into periods and look at where the returns actually landed.
A ten year total hides everything. This strategy made 88 percent of its money before February 2019 and has returned 0.01R per trade since, and both facts live inside the same headline figure of $16,754.
That matters because you cannot trade the average. You trade the next period, and the last three periods here are the best guide to what that looks like.
It also explains something you will notice if you read enough strategy content. Setups built around liquidity and stop hunts tend to show their best numbers on older data, and backtests that start in 2015 or 2016 flatter them in a way that backtests starting in 2020 do not. Whether that is markets adapting or simply a quiet stretch is not something ten years can settle. What it does settle is that you should check the date range on anyone’s results before you trust the total.
Is The Liquidity Sweep Strategy Worth Your Time?
The concept yes, this version of it no.
- The textbook rules lost money across 1,706 trades, ending at $6,725 with a 67.3 percent worst fall and a win rate one point below break even.
- Five tightened inputs produced plus 0.06R per trade, a 25.6 percent drawdown and an ending balance of $16,754.
- The first of four periods supplied 88 percent of the total return, and the 710 trades since February 2019 produced 0.01R each.
The mechanism behind a liquidity sweep is real. Stops do cluster beyond obvious swings, those orders do provide fills, and price does frequently turn once they are absorbed. That observation is worth carrying into whatever you trade.
What this test questions is whether the pattern is still tradable on its own on a Daily chart. The last seven and a half years say the entry no longer selects anything the market rewards, and the drawdowns over that stretch got steadily deeper while the returns went flat.
If you want to take it further, the recent periods are the ones to work on rather than the full history. Rebuild the test on 2019 onward only, change one input at a time, and see whether anything lifts that 0.01R. Anything that looks like a fix across the full ten years is being carried by 2016 to 2019, and that is a period you will never trade again.
Also Read: ICT Order Block Strategy
Frequently Asked Questions
What Is A Liquidity Sweep In Forex?
It is price pushing beyond a recent swing high or low, triggering the protective stop orders resting there, then reversing. The orders that execute provide the fills a large participant needs, and once they are absorbed there is nothing left driving price in that direction.
Does The Liquidity Sweep Strategy Work?
The textbook version lost money in our test, ending at $6,725 from $10,000 across 1,706 trades, with a win rate of 38 percent against a 39.1 percent break-even requirement. A tightened version finished at $16,754, though 88 percent of that came before February 2019.
How Is A Liquidity Sweep Different From A Breakout?
They begin identically and end opposite. A breakout trade enters when price moves past a level and bets it continues. A sweep trade waits for price to move past the level, fail, and close back inside, then bets on the reversal.
What Win Rate Does The Liquidity Sweep Strategy Need?
The textbook version needed 39.1 percent, based on winners averaging 1.56R against losers at 1.00R, and it reached 38. Tightening the stop to 1.0 ATR lowered the requirement to 37.8 percent, which the filtered version cleared at 40.
Which Forex Pairs Work Best For Liquidity Sweeps?
USDCAD, CADJPY and GBPCHF led the filtered results, but at roughly 34 trades per pair the margin of error is about 0.22R, so those rankings are not precise enough to act on. AUDCAD produced the single largest win in the test and still finished the decade negative.
Has The Liquidity Sweep Strategy Stopped Working?
In this test the edge was concentrated in the first two and a half years. The 710 trades from February 2019 onward produced 0.01R each, with drawdowns deepening from 15.5 percent to 20.3 percent across the four periods.