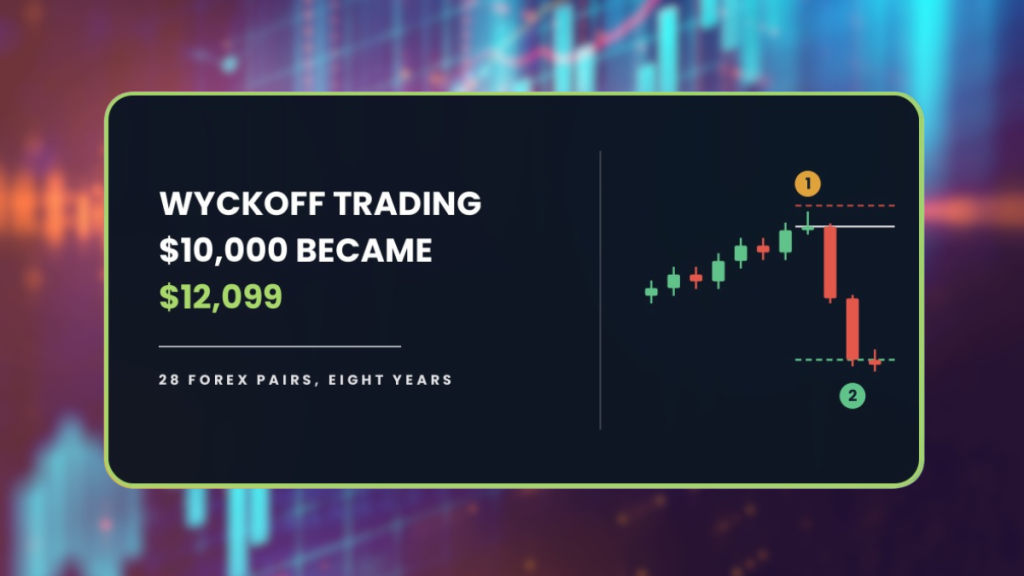
The textbook Wyckoff setup turned $10,000 into $8,426 across 660 trades. One trend filter turned that into $12,099 and cut the worst drawdown from 42.1 percent to 10.1, which is the first result in this series that looks like a working strategy. It also rests on 120 trades, and that number is the whole story.
| About This Guide |
|---|
| This guide covers Wyckoff trading as the AFM Research Lab tested it, meaning the spring and the upthrust, entered on the reversal candle with a stop 0.25 ATR beyond the extreme and a 2R target, across 28 forex pairs and eight years of Daily data. You will finish knowing why the textbook version sits one point below its break-even line, what a single trend filter did to that, and why 120 trades is not enough to call it an edge. |
| Quick Answer |
|---|
| Wyckoff trading looks for a false breakout at the edge of a range: a spring dips below support and snaps back, an upthrust spikes above resistance and fails. In the AFM Research Lab the textbook version lost money across 660 trades on 28 forex pairs, ending at $8,426 from $10,000. A 200 EMA trend filter produced a profit, on a sample too small to separate from luck. |
What Happened When We Tested Wyckoff Trading
Eight years, 28 pairs, 660 trades on the Daily chart. Here is where each version left a $10,000 account.
| Version | Start | End | Max drawdown | Trades |
|---|---|---|---|---|
| Textbook | $10,000 | $8,426 | 42.1% | 660 |
| Filtered | $10,000 | $12,099 | 10.1% | 120 |
Drawdown is the distance from the highest point an account reached to the lowest point that came after it. It decides whether you can stay in a strategy long enough to find out whether it works, which is a separate question from whether it finishes ahead.
Thirty percent is the level past which most people stop following their own rules. The textbook version at 42.1 percent clears that line, so it is not tradable as written. The filtered version at 10.1 percent is the first result in this series to come in under it.
Every position risked 1 percent of the account and costs came out at 0.05 percent of the entry price per round trip. The window runs from September 20, 2018 to October 20, 2026.
A backtest applies fixed rules to prices that have already happened. It can measure an edge, but it cannot measure whether you would still be placing the trades after a year of flat results, which for this setup is a realistic ask.
Key Takeaways
- The textbook rules lost money across 660 trades, ending at $8,426 with a 42.1 percent worst fall.
- Winners averaged 1.86R against losers at 1.04R, a payoff needing a 36 percent win rate. The setup delivered 35.
- A 200 EMA trend filter removed 82 percent of the trades and produced an expectancy of plus 0.17R on the 120 that remained.
- That filtered result carries a margin of error of plus or minus 0.13R, so the honest range runs from minus 0.09R to plus 0.43R.
- Establishing an edge that size with confidence would take roughly 560 trades, which at this signal rate is about 38 years of data.
- The filter settings were chosen by searching the full test history, so the four period results are a consistency check rather than an independent test.
What Is The Wyckoff Setup?
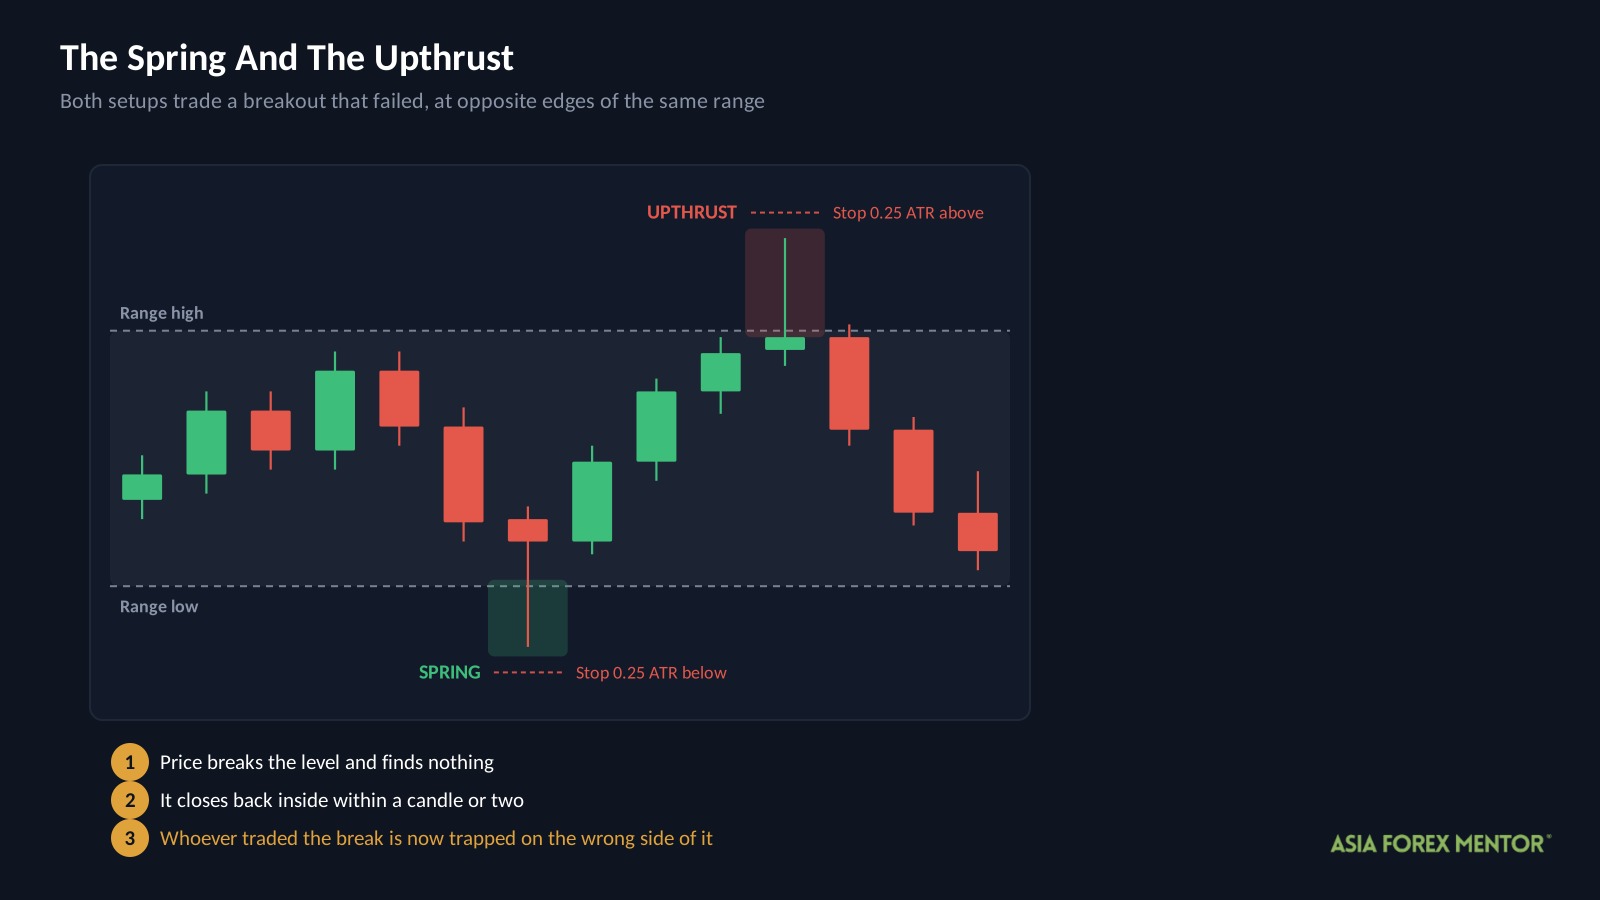
Wyckoff trading watches the edges of a range for a breakout that fails.
A spring forms at the bottom. Price drops below the range low, finds no sellers willing to push it further, and snaps back inside within a candle or two. An upthrust is the same event at the top: price pokes above the range high, buyers do not follow, and it drops back in.
The reasoning behind both is about who is now trapped. Traders who sold the break of support are offside the moment price returns above it, and their stops sit just above the range low. When those stops trigger they buy, which pushes price further in the direction of the reversal.
So the setup is not really betting on the level. It is betting that a failed breakout creates forced buyers or forced sellers on the wrong side of it. Our guide to price action trading covers reading those moments on a chart.
How Do Most Traders Trade It?
They mark the range first, then wait for one of its edges to fail.
| Rule | Setting |
|---|---|
| Chart | Daily |
| Setup | A clear horizontal trading range |
| Spring | A close below the range low that reverses back inside |
| Upthrust | A close above the range high that reverses back inside |
| Entry | On the reversal candle |
| Stop loss | 0.25 ATR beyond the spring or upthrust extreme |
| Target | 2R |
| Spacing | At least 10 candles before another trade on the same pair |
| Trend filter | None |
Results below are written in R, where one R is the distance from entry to stop. Risking 1 percent of a $10,000 account makes 1R worth $100, so a 1.86R winner returned $186.
ATR measures the ground a pair typically covers in a session, which is what sizes the stop here. A 0.25 ATR buffer beyond the extreme is deliberately tight, on the logic that if the reversal is real price should not revisit the failed break.
Those conditions are selective. They produced 660 signals in eight years across 28 pairs, which is under three per pair per year.
Why Did The Textbook Version Lose?
| Metric | Textbook |
|---|---|
| Trades | 660 |
| Win rate | 35% |
| Average win | +1.86R |
| Average loss | -1.04R |
| Expectancy | -0.02R |
| Profit factor | 0.98 |
| Yearly growth rate | -2.1% |
| Max drawdown | 42.1% |
| Ending balance from $10,000 | $8,426 |
Three of those rows need a sentence.
Expectancy averages every closed trade into what a single attempt was worth. At minus 0.02R this setup gave back about a fiftieth of each stake, which is close enough to nothing that it took eight years to do visible damage.
Profit factor divides everything won by everything lost. At 0.98 the strategy returned 98 cents for every dollar it took in, which is the narrowest shortfall we have measured on anything.
Yearly growth rate compresses the whole period into one annual pace. Minus 2.1 percent a year is slow, and slow is precisely what makes this version dangerous rather than obviously broken.
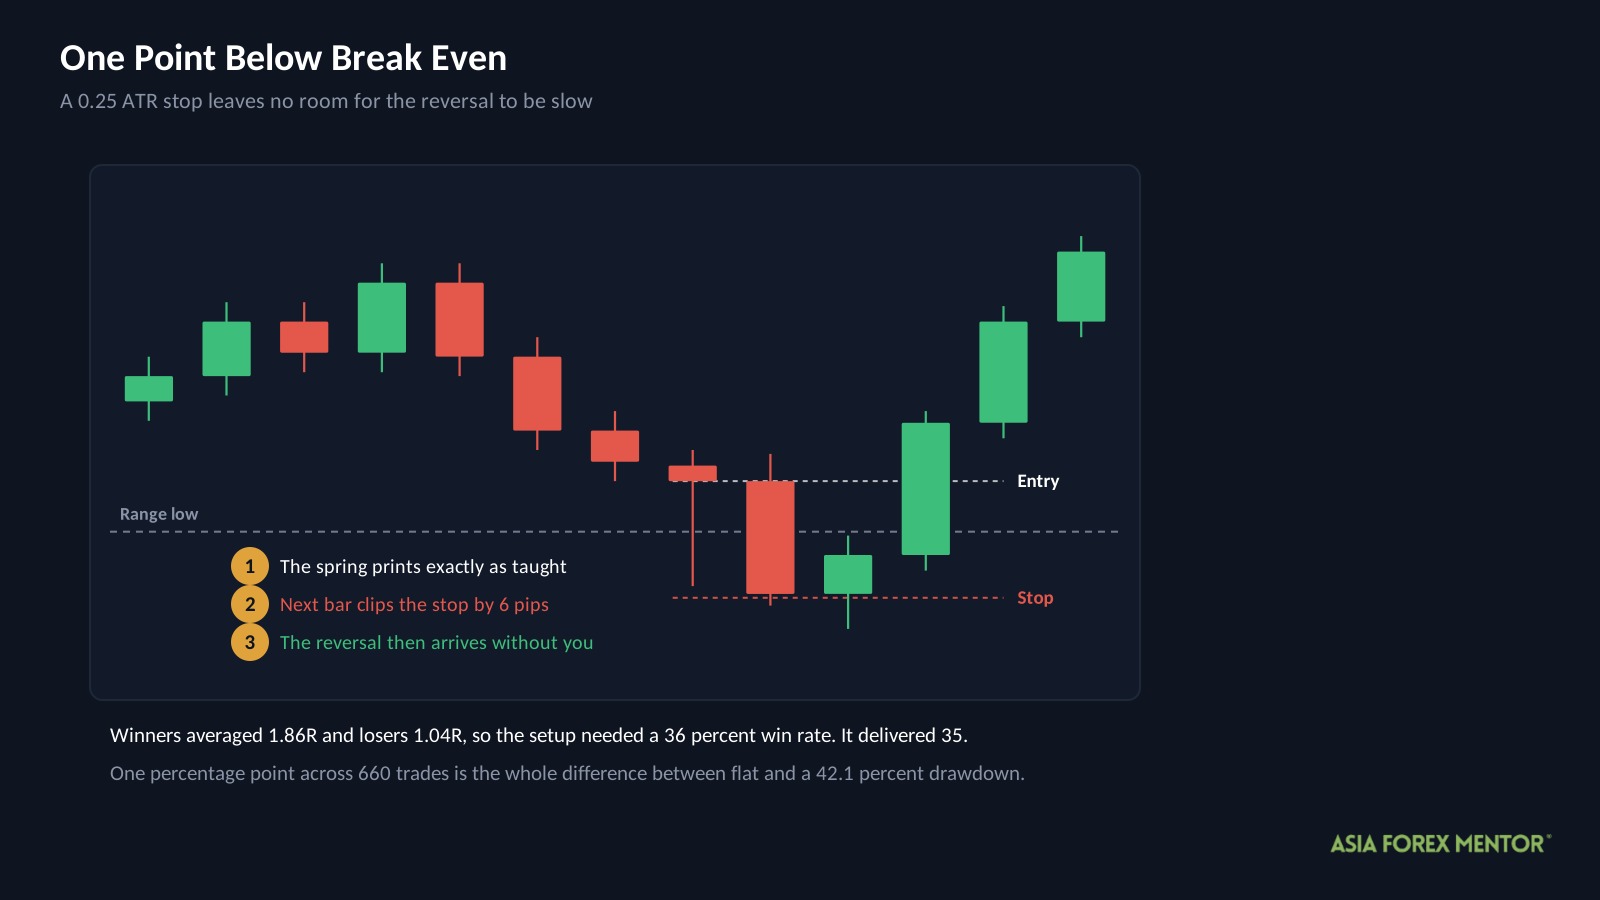
Now the arithmetic. A 1.86R winner against a 1.04R loser puts the break-even bar at 36 percent.
The setup won 35 percent.
One percentage point. That is the entire gap, and it is the smallest miss in this series by a wide margin. The order block setup missed by eight points and the moving average version by four. This one is close enough that the honest description is not that the strategy fails, but that it has no margin at all. Anything that shaves a fraction of a point off the win rate, a wider spread, a slower fill, one skipped signal, drops it into losses.
The 42.1 percent drawdown is what makes that unlivable. You would be sitting through a 42 percent fall for a strategy whose expected return is roughly nothing.
What Did We Change?
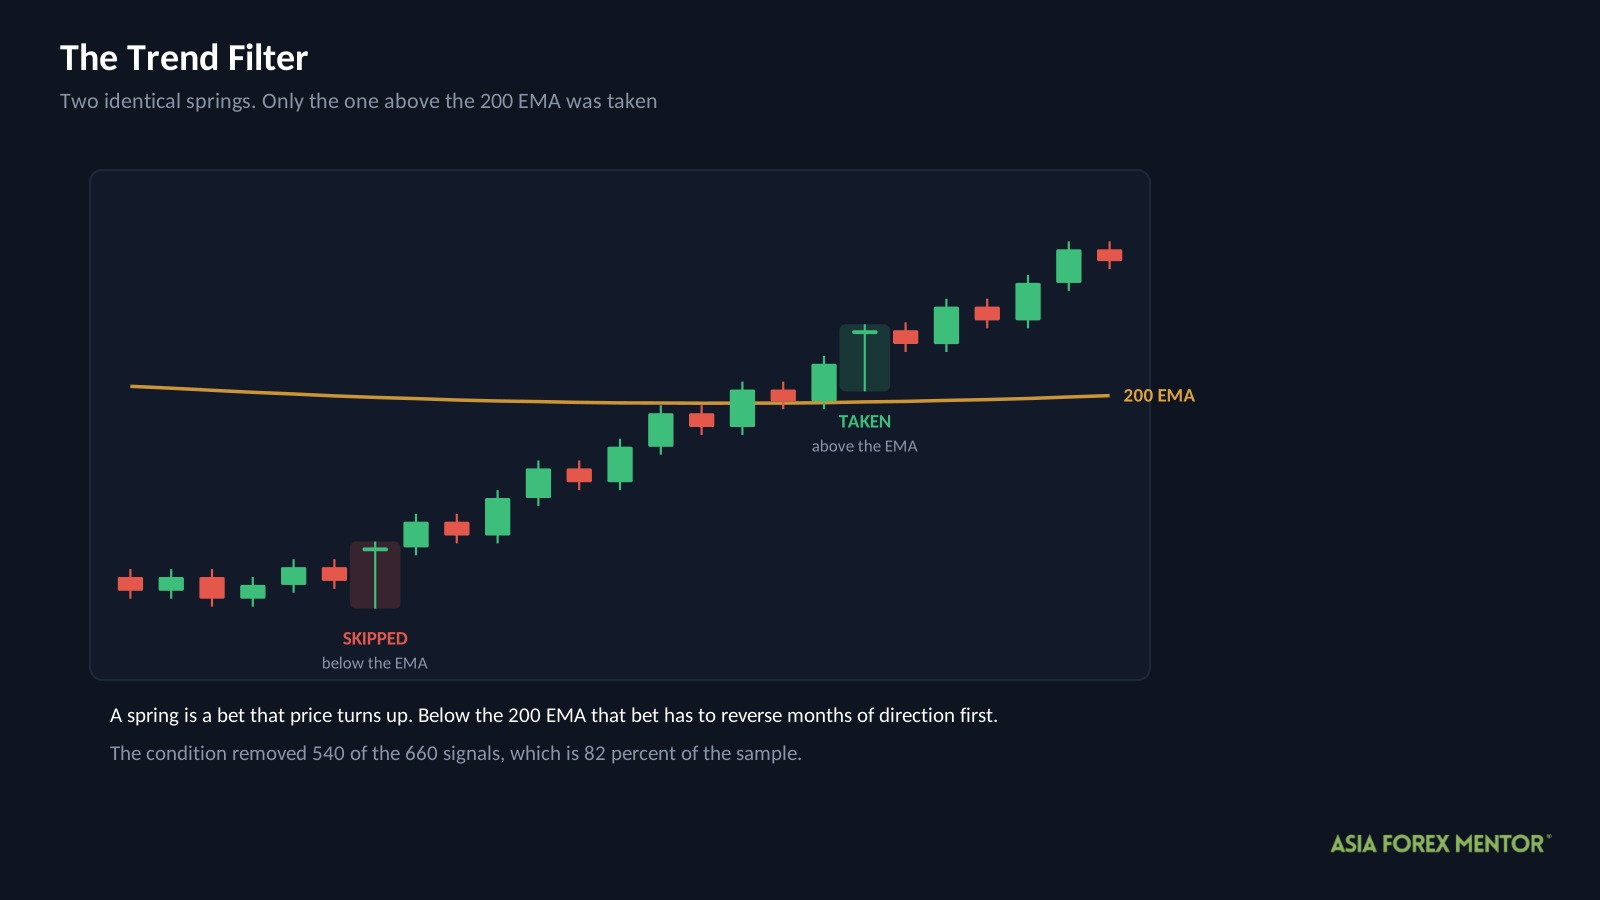
The entry, stop, target and spacing rules were untouched. The AFM Research Lab added one condition deciding whether a signal became a trade.
| Filter | Condition | The idea behind it |
|---|---|---|
| Trend direction | Springs only above the 200 period EMA, upthrusts only below it | A failed breakout that points with the larger trend has momentum behind it, one that points against it does not |
The logic is about what happens after entry rather than at it. A spring is a bet that price turns up. Taken below the 200 EMA, that bet needs price to reverse the direction the market has been travelling for months, and the trapped buyers it relies on have to overcome everyone still selling into strength. Above the EMA the same trapped buyers are pushing the way the market was already going.
The condition removed 540 of the 660 signals, which is 82 percent of the sample.
That number matters as much as anything the filter did to the results, and the next two sections are about why.
Did The Filter Work?
On every measure, yes. Then look at the trade count.
| Metric | Textbook | Filtered |
|---|---|---|
| Trades | 660 | 120 |
| Win rate | 35% | 42% |
| Average win | +1.86R | +1.88R |
| Average loss | -1.04R | -1.07R |
| Max drawdown | 42.1% | 10.1% |
| Profit factor | 0.98 | 1.28 |
| Ending balance from $10,000 | $8,426 | $12,099 |
| Expectancy | -0.02R | +0.17R |
The filtered version clears its break-even bar. With winners at 1.88R and losers at 1.07R the requirement works out to 36.2 percent, and it won 42. That is a genuine 5.8 point margin rather than a one point deficit, and the drawdown came in under the 30 percent ceiling.
At equal risk it holds up too. Scale the textbook version down until its worst fall also sits at 10.1 percent and it finishes at $9,764 against the filtered version’s $12,099.
So why is this not a recommendation?
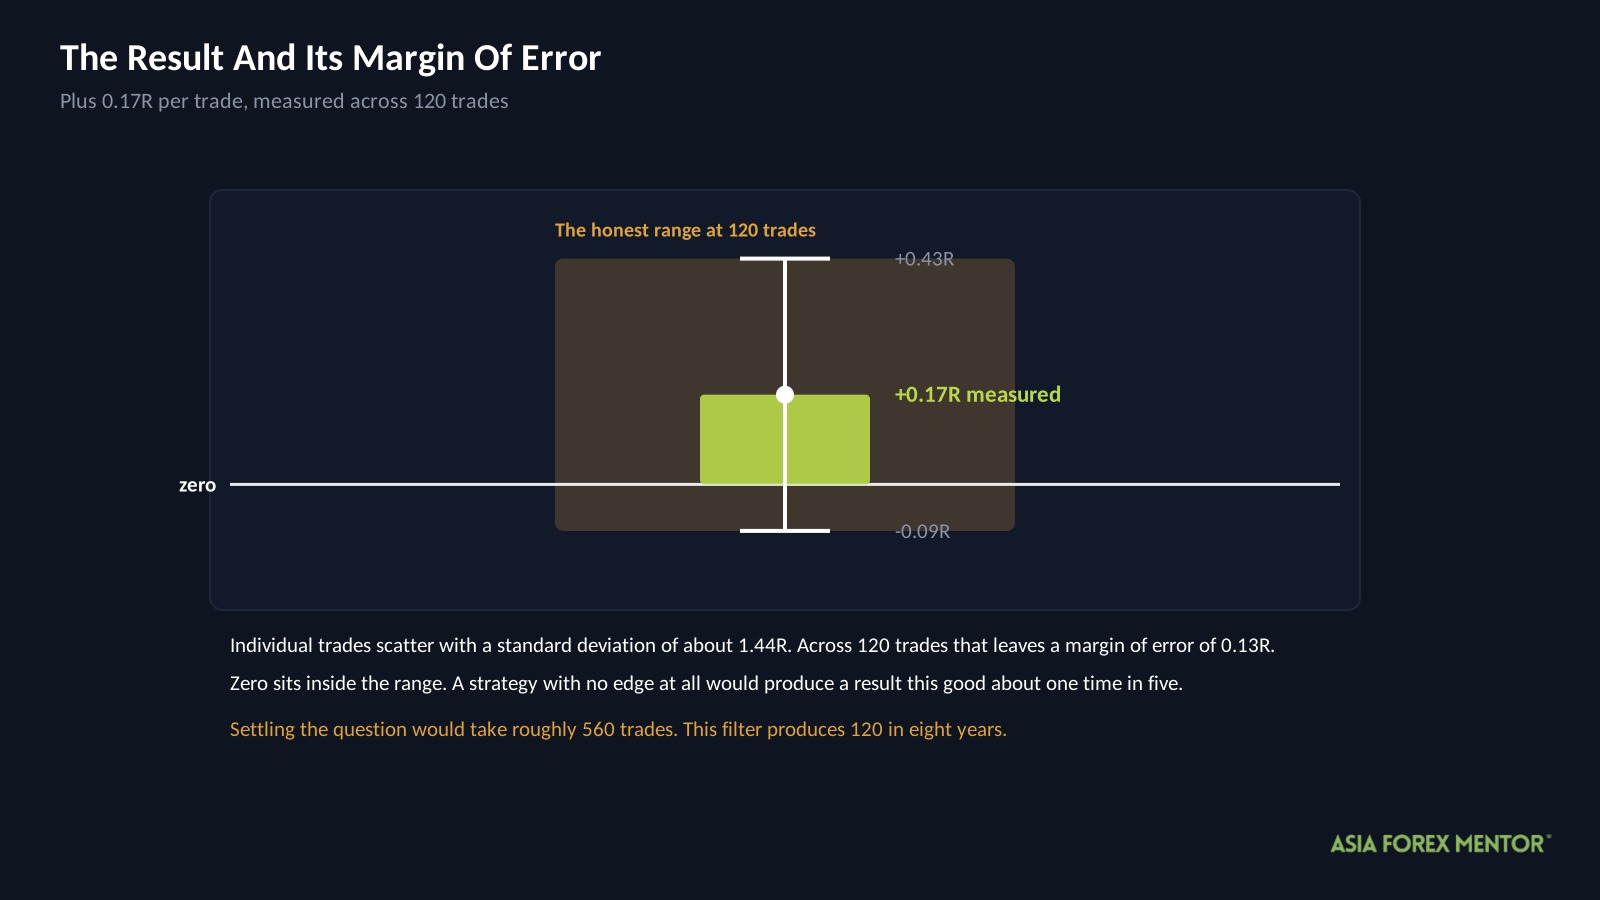
Because 120 trades is not enough to tell a plus 0.17R edge from zero. With winners at 1.88R and losers at 1.07R, individual trade results scatter with a standard deviation of about 1.44R. Spread that across 120 trades and the margin of error on the average comes to 0.13R.
The result is plus 0.17R, give or take 0.13R.
Written as a range, the honest answer runs from minus 0.09R to plus 0.43R. Zero is inside it. Put the other way round: a strategy with no edge at all would produce a result this good or better about one time in five, purely by chance.
Settling the question would take roughly 560 filtered trades. This filter produces 120 in eight years. That is close to 38 years of daily data on 28 pairs.
Did It Hold In Every Period?
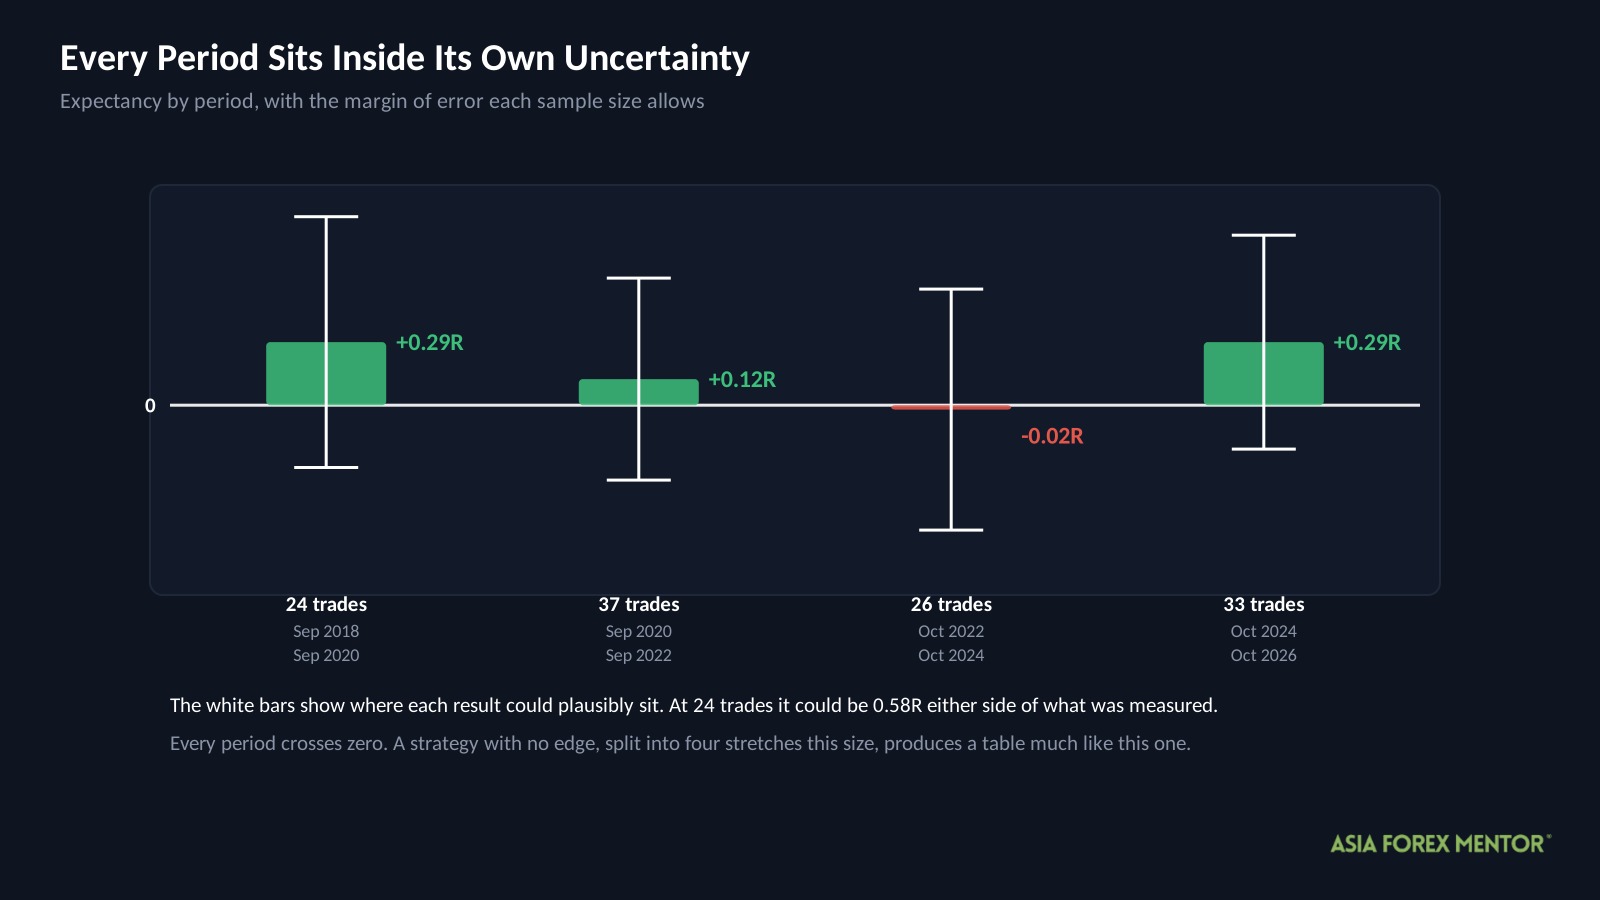
The eight years split into four stretches. The filter settings were chosen by searching the whole history, so these are a consistency check rather than a test on anything unseen.
| Period | Trades | Win rate | Expectancy | Max drawdown |
|---|---|---|---|---|
| Sep 2018 to Sep 2020 | 24 | 46% | +0.29R | 3.3% |
| Sep 2020 to Sep 2022 | 37 | 41% | +0.12R | 5.1% |
| Oct 2022 to Oct 2024 | 26 | 35% | -0.02R | 5.2% |
| Oct 2024 to Oct 2026 | 33 | 45% | +0.29R | 3.3% |
Three positive, one flat. On its face that looks like consistency.
Apply the same arithmetic as above and it dissolves. At 24 trades the margin of error on expectancy is 0.29R, which is the size of the entire result reported for that period. Every row here sits inside its own uncertainty. A strategy with no edge, split into four stretches of this size, would produce a table that looks much like this one most of the time.
One more detail worth noticing. The textbook version was also profitable in the first stretch, at plus 7.1R per 100 trades. The setup had a good two years in 2018 to 2020 whether it was filtered or not, which makes the filter a smaller part of this story than the headline numbers suggest.
What About Volume?
Worth being direct about scope, because anyone who has read Wyckoff will ask.
Wyckoff’s method is built on volume confirming price. In the original work a spring is convincing when it happens on low volume, because that signals sellers have run out rather than that they are overwhelming the level. The same price pattern on heavy volume means something closer to the opposite. The price shape is half the signal and the volume reading is the other half.
This test used the price half only. Spot forex has no central exchange, so there is no true volume figure, only the tick counts an individual broker sees, and those differ between brokers for the same candle.
That is a real limitation and it cuts both ways. It means these results describe the price skeleton of Wyckoff rather than the full method, so a trader who reads volume properly on a futures contract may do better than these numbers suggest. It also means anyone selling you Wyckoff signals on a spot forex chart is working from the same half you are.
What Did A Winning Trade Look Like?
| Detail | Value |
|---|---|
| Pair and chart | EURCAD, Daily |
| Direction | Short |
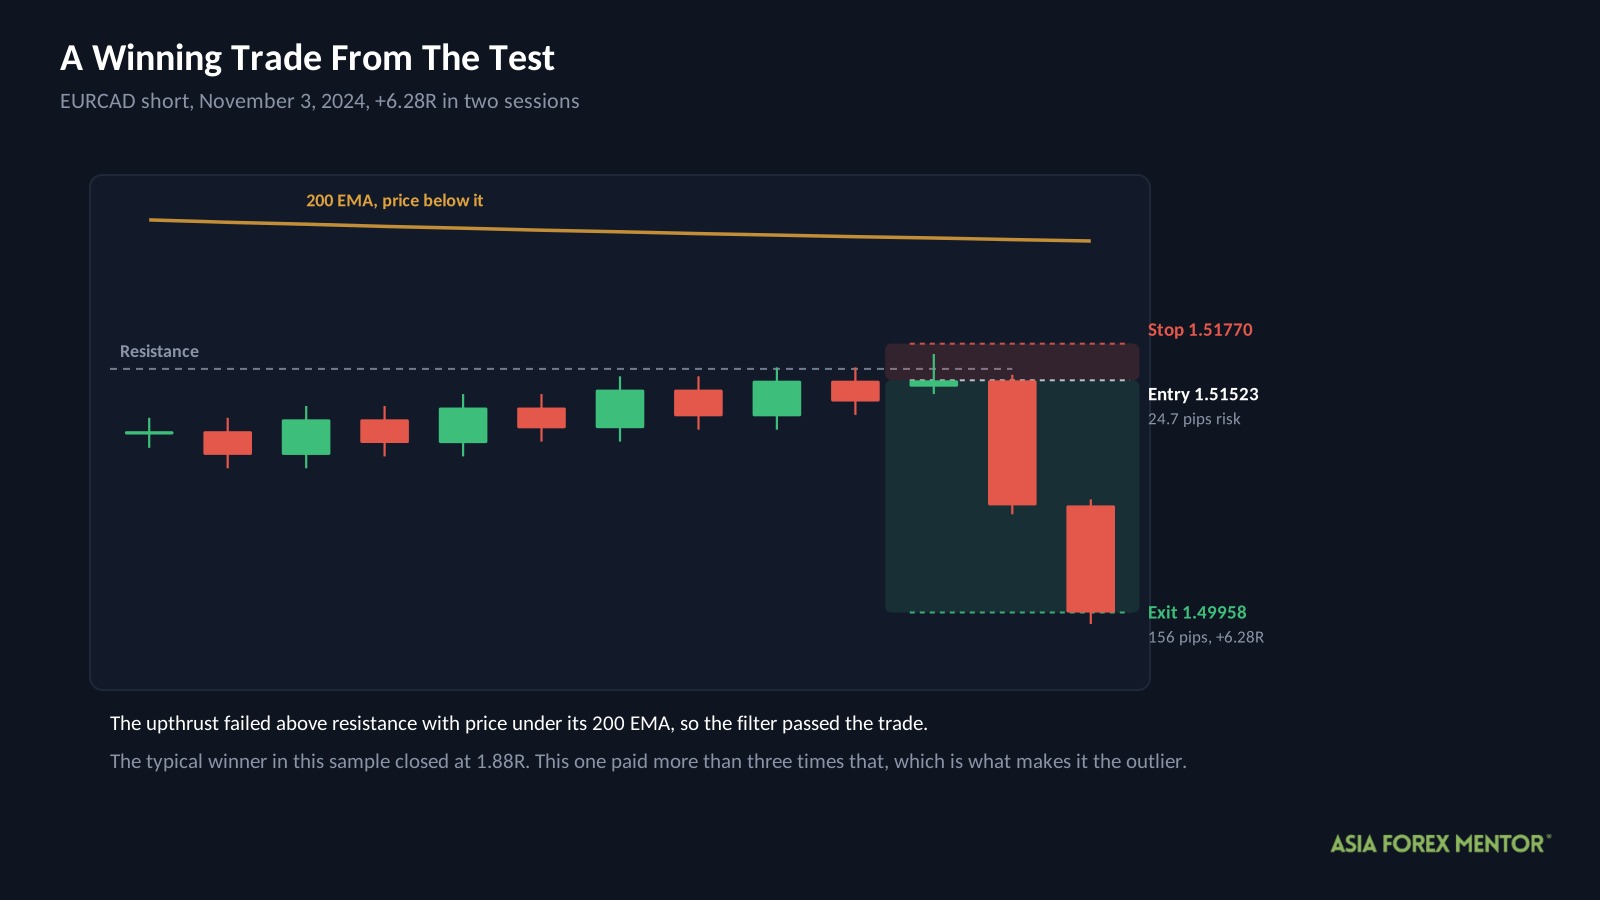
| Entry | November 3, 2024 at 1.51523 |
| Stop | 1.51770 |
| Exit | November 5, 2024 at 1.49958 |
| Result | +6.28R in 2 bars |
Price pushed above a resistance zone, failed to hold it, and closed back inside the range. EURCAD was below its 200 EMA, so the filter passed the trade as an upthrust in a downtrend.
The stop sat 24.7 pips above entry. Price then fell 156 pips in two sessions.
Set that against the filtered version’s average winner of 1.88R and this trade paid more than three times what a typical one did. Most winners here close far nearer to 1.88R, and roughly six trades in ten close at a loss. A single outcome like this one tells you what the setup can do when a market is already moving, not what to expect from it.
What Should You Take From This?
One habit transfers out of this test, and it is the one most likely to save you money.
Count the trades before you believe the result. Then work out the margin of error, which for a strategy like this is roughly 1.4 divided by the square root of your trade count.
Here that comes to 0.13R against a result of 0.17R. The uncertainty is almost as large as the finding.
This is the most common way traders fool themselves, and it does not feel like being fooled. It feels like evidence. Someone backtests an idea, gets 80 or 150 trades, sees a positive number, and treats it as settled. The arithmetic says a strategy with no edge whatsoever clears that bar about one time in five.
The rule of thumb worth carrying: under 200 trades, a positive result tells you almost nothing. Around 500, it starts to mean something. Below 50, the number is noise with a decimal point attached.
And notice which way this cuts. The textbook result here, minus 0.02R across 660 trades, is the finding you can actually rely on. The exciting number is the one built on too little data. That is usually how it goes.
Is Wyckoff Trading Worth Your Time?
Not yet, and the reason is sample size rather than performance.
- The textbook rules lost money across 660 trades, ending at $8,426 with a 42.1 percent worst fall and a win rate one point below break even.
- Adding a 200 EMA trend filter produced plus 0.17R per trade and a 10.1 percent drawdown, the first result in this series under the survivable ceiling.
- That filtered result rests on 120 trades with a margin of error of 0.13R, so it cannot be separated from zero.
The idea itself is sound and the textbook numbers support that. A setup that comes within one percentage point of break even across 660 trades, with no filtering and no optimization, is doing something real. Most of what gets taught as a reversal pattern does considerably worse.
What the test cannot tell you is whether the trend filter is the fix it appears to be. The direction of the result is encouraging and the mechanism is sensible, but 120 trades over eight years is a signal rate too thin to confirm it inside a trading lifetime.
Where that leaves it is as a setup worth studying rather than trading. If you want to take it further, the productive direction is finding a condition that keeps the trend alignment while producing more signals, perhaps a shorter trend measure or a looser range definition. The number to watch is the trade count alongside the expectancy, because an edge you cannot sample is not an edge you can use. Our guide to risk management in forex trading covers sizing for a strategy you are still testing.
Also Read: Price Action Trading
Frequently Asked Questions
Does Wyckoff Trading Work In Forex?
The textbook version lost money in our test, ending at $8,426 from $10,000 across 660 trades on Daily charts. It won 35 percent of trades against a 36 percent break-even requirement, which is the narrowest miss we have measured.
What Is A Wyckoff Spring?
A spring forms when price drops below the low of a trading range and snaps back inside within a candle or two. It signals that sellers pushed through support and found nothing to sustain the move, leaving them offside when price returns.
What Is A Wyckoff Upthrust?
An upthrust is the spring in reverse. Price spikes above the range high, buyers fail to follow it, and price closes back inside the range, trapping anyone who bought the breakout.
Does A Trend Filter Improve Wyckoff Trading?
It improved every figure in our test, lifting expectancy to plus 0.17R and cutting the worst drawdown to 10.1 percent. The filter also removed 82 percent of the signals, leaving 120 trades, which is too small a sample to confirm the improvement is real.
How Many Trades Do You Need To Trust A Backtest?
For a strategy of this type, roughly 500. At 120 trades the margin of error on expectancy is about 0.13R, which here is almost as large as the result itself. Under 200 trades a positive result is close to meaningless.
Why Did You Not Test Wyckoff Volume?
Spot forex has no central exchange and therefore no true volume figure, only the tick counts an individual broker records. This test covers the price patterns, the spring and the upthrust, rather than the volume reading that Wyckoff’s original method pairs with them.