
Learn To Trade Forex • Best Forex Trading Course • AsiaForexMentor

USD/JPY Outlook: Slips Below 142.00 Amid Weak Dollar

Written by

Ezekiel Chew

Updated on

September 12, 2024

i
Its a default text

USD/JPY Outlook: Slips Below 142.00 Amid Weak Dollar

Written by:

Ezekiel Chew

Last updated on:

September 12, 2024

The USD/JPY pair retreated from its recent high of 143.00, dropping by over 0.28% due to a mix of economic data from the United States (US) that increased expectations for the Federal Reserve’s first rate cut next week. As of now, the pair is trading at 141.96.

The pair remains under a downward trend, though Wednesday’s long tail suggests a possible short-term rebound and a test of key resistance levels. Despite this, bearish sentiment persists as indicated by the Relative Strength Index (RSI), which shows a flat slope, hinting at potential consolidation in the near term.

Key Levels to Watch for USD/JPY Movement
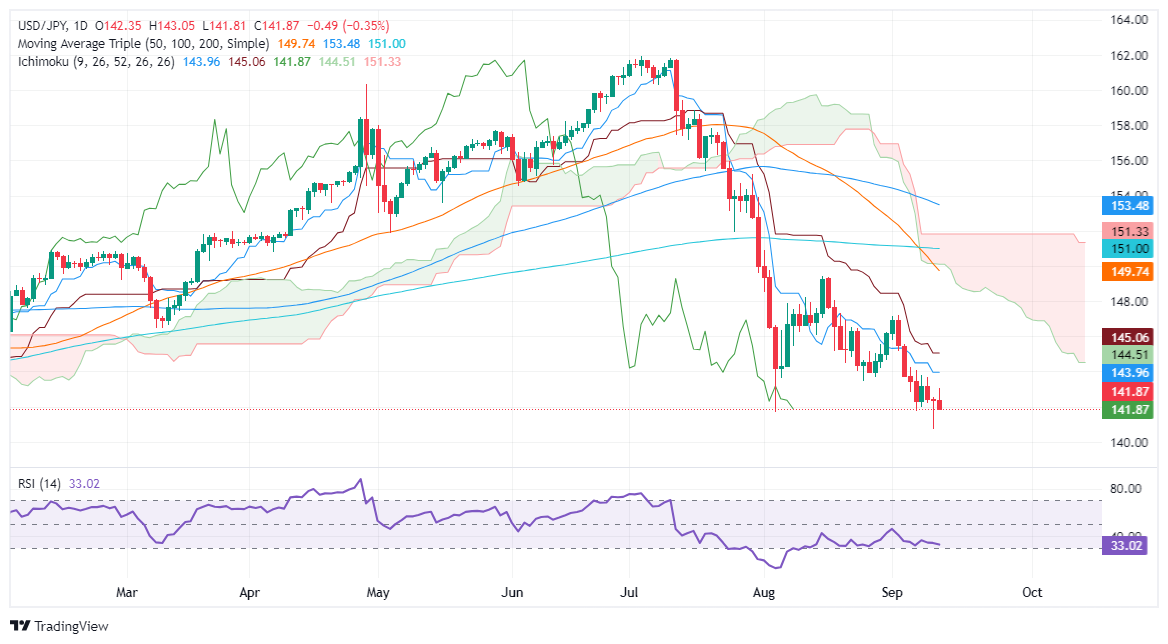
USD/JPY Daily Chart as of September 12th, 2024 (Source: FXStreet)

If USD/JPY closes below 142.00 on a daily basis, it may open the door for traders to push prices towards the September 11 low of 140.71. A breach of this level would expose the pair to further downside, targeting the December 28, 2023 cycle low of 140.25, with an eventual move toward 140.00.

On the upside, initial resistance is at the 142.00 mark. If surpassed, the pair could aim for the September 12 high of 143.04, followed by the Tenkan-Sen at 143.96 and finally the Senkou Span A at 144.50.


About Ezekiel Chew​

Ezekiel Chew, founder and head of training at Asia Forex Mentor, is a renowned forex expert, frequently invited to speak at major industry events. Known for his deep market insights, Ezekiel is one of the top traders committed to supporting the trading community. Making six figures per trade, he also trains traders working in banks, fund management, and prop trading firms.

How to Read Candlesticks (Most Traders Get This Wrong)

Most traders who spend months learning how to read candlesticks still lose on setups that looked textbook. The pattern was never the problem. Reading it without context was. ABOUT THIS GUIDE This guide covers three specific candlestick signals used in professional price action trading, the Fibonacci golden zone context tool,

Read More

What Profit Factor Tells You Before Going Live

Profit factor is calculated by dividing a strategy’s total gross profit by its total gross loss, and most experienced traders reject any system that reads below 1.5 before risking real capital. Most traders see any positive number and call it a green light. That is where the costly mistake starts.

Read More

6 Forex Trading Scams Every Beginner Should Know

The most effective forex trading scams do not announce themselves as threats. They arrive as opportunities, come through referrals and social media, and are often indistinguishable from legitimate services until the first withdrawal request is made. ABOUT THIS GUIDE This guide covers the six most common forex trading scams, the

Read More

How to Use Fibonacci Retracement Step by Step in 2026

Most traders learn how to use Fibonacci retracement and immediately draw it wrong. This tool comes from a mathematical sequence first documented in 1202, and institutional traders use it daily to plan entries at precise price levels. The majority of retail traders miss the one placement rule that makes every

Read More

Free Margin in Forex What the MT4 Panel Shows

Free margin in forex is the one figure on the MT4 or MT5 account panel that determines whether another position can open right now, and it is consistently the last number most traders learn to read. ABOUT THIS GUIDE This guide explains what free margin is and how it connects

Read More

Scalping Trading Strategy The Pros Actually Use

The scalping trading strategy most retail traders use is not actually scalping. They are gambling on 1-minute candles with no defined edge, no position-sizing rules, and no plan for when the losses come. ABOUT THIS GUIDE This guide covers what scalping is, how professional scalpers build a repeatable edge, and

Read More

AFM Trading Summit Live

Date: Coming Soon

Join us at the AFM Trading Summit Live and learn from top industry experts through live trading sessions, market insights, and actionable strategies.

USD/JPY Outlook: Slips Below 142.00 Amid Weak Dollar

4.0
Overall Trust Index

Written by:

Updated:

September 12, 2024
The USD/JPY pair retreated from its recent high of 143.00, dropping by over 0.28% due to a mix of economic data from the United States (US) that increased expectations for the Federal Reserve’s first rate cut next week. As of now, the pair is trading at 141.96. The pair remains under a downward trend, though Wednesday's long tail suggests a possible short-term rebound and a test of key resistance levels. Despite this, bearish sentiment persists as indicated by the Relative Strength Index (RSI), which shows a flat slope, hinting at potential consolidation in the near term. Key Levels to Watch for USD/JPY Movement
USD/JPY Daily Chart as of September 12th, 2024 (Source: FXStreet)
If USD/JPY closes below 142.00 on a daily basis, it may open the door for traders to push prices towards the September 11 low of 140.71. A breach of this level would expose the pair to further downside, targeting the December 28, 2023 cycle low of 140.25, with an eventual move toward 140.00. On the upside, initial resistance is at the 142.00 mark. If surpassed, the pair could aim for the September 12 high of 143.04, followed by the Tenkan-Sen at 143.96 and finally the Senkou Span A at 144.50.

ezekiel chew asiaforexmentor

About Ezekiel Chew

Ezekiel Chew, founder and head of training at Asia Forex Mentor, is a renowned forex expert, frequently invited to speak at major industry events. Known for his deep market insights, Ezekiel is one of the top traders committed to supporting the trading community. Making six figures per trade, he also trains traders working in banks, fund management, and prop trading firms.

RELATED ARTICLES

USD/JPY Outlook: Slips Below 142.00 Amid Weak Dollar

4.0
Overall Trust Index

Written by:

Updated:

September 12, 2024
The USD/JPY pair retreated from its recent high of 143.00, dropping by over 0.28% due to a mix of economic data from the United States (US) that increased expectations for the Federal Reserve’s first rate cut next week. As of now, the pair is trading at 141.96. The pair remains under a downward trend, though Wednesday's long tail suggests a possible short-term rebound and a test of key resistance levels. Despite this, bearish sentiment persists as indicated by the Relative Strength Index (RSI), which shows a flat slope, hinting at potential consolidation in the near term. Key Levels to Watch for USD/JPY Movement
USD/JPY Daily Chart as of September 12th, 2024 (Source: FXStreet)
If USD/JPY closes below 142.00 on a daily basis, it may open the door for traders to push prices towards the September 11 low of 140.71. A breach of this level would expose the pair to further downside, targeting the December 28, 2023 cycle low of 140.25, with an eventual move toward 140.00. On the upside, initial resistance is at the 142.00 mark. If surpassed, the pair could aim for the September 12 high of 143.04, followed by the Tenkan-Sen at 143.96 and finally the Senkou Span A at 144.50.

ezekiel chew asiaforexmentor

About Ezekiel Chew

Ezekiel Chew, founder and head of training at Asia Forex Mentor, is a renowned forex expert, frequently invited to speak at major industry events. Known for his deep market insights, Ezekiel is one of the top traders committed to supporting the trading community. Making six figures per trade, he also trains traders working in banks, fund management, and prop trading firms.

RELATED ARTICLES

Join the Live Event
Get Your Free Ticket Now

I consent to receiving emails and/or text message reminders for this event.

REGISTER FOR THE MASTERCLASS!