Hey, what's up, traders! It’s Ezekiel Chew here, and today we’re going to talk about volume profile, one of the most powerful trading strategies that can make or break your success in the markets.
Let me hit you with this: Most traders lose not because their strategy is broken, but because they are blind to where the real money actually moves. Every candle you see is surface-level noise, while the real story lies underneath, in where the big players actually traded.
Every candle is just the surface. The real story is hidden underneath, in where the big players actually traded.
When you understand how volume builds at each price level, you unlock something 99% of traders never see: the invisible footprints left behind by institutions, market makers, and the traders who actually move the market.
This is why the Volume Profile Strategy is one of the most powerful tools in my trading. It shows you where the real battles took place, the zones where buyers and sellers fought the hardest, and where price is likely to react again.
📌 In this guide, I’ll walk you through the exact four steps I personally use:
- ✅ Understanding the core of the Volume Profile
- ✅ Mastering Anchored Volume Profile with precision
- ✅ Interpreting Session Volume Profile for clean intraday reactions
- ✅ Combining multiple confirmations to build sniper-quality entries
When you understand this approach, you will never look at a chart the same way again.
📺 Watch the full breakdown in this video:
What Is Volume Profile And Why Most Traders Misread Price Action
Volume Profile can look intimidating at first, but it’s actually simple when you understand what it shows.
Instead of seeing the market as just moving prices, imagine it as layers of activity stacked across different price levels. You aren’t just asking “Where did price go?”, you’re asking:
How much business was done at each exact price?
That one shift changes everything.
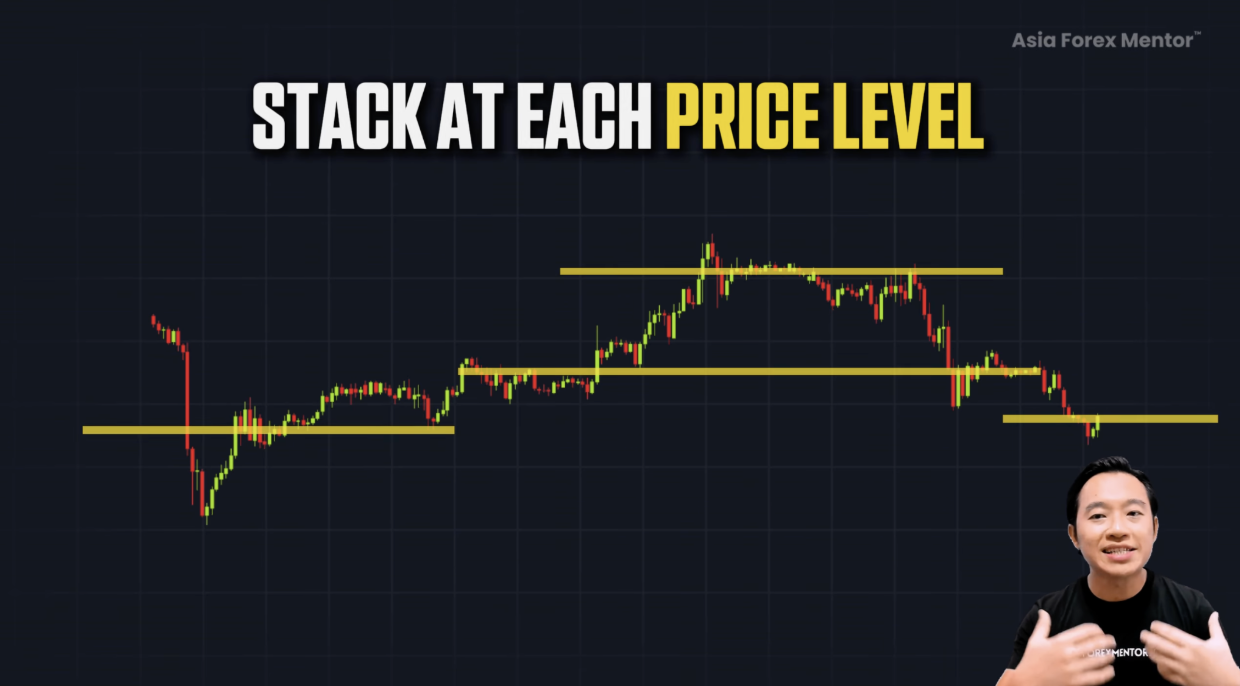
Step 1 – Core Components of Volume Profile
Unlike normal volume bars at the bottom of your chart, Volume Profile stacks volume vertically along the price axis.
This reveals:
- where buyers and sellers were most active
- where big traders defended their positions
- which areas are “dead zones” with little interest
- where future reactions are most likely

High Volume Nodes (HVNs)
These are thick clusters on the profile, levels where heavy trading occurred.
A thick cluster shows where buyers and sellers fought the hardest. These areas become magnets, or walls, in future price action.
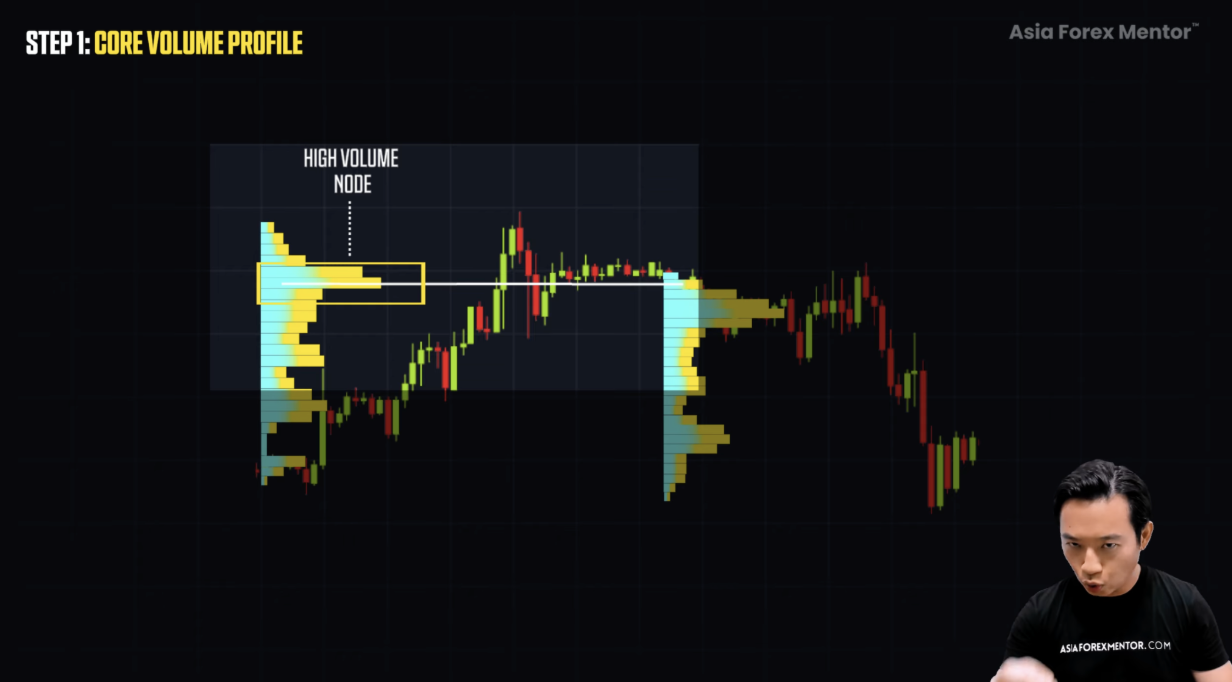
When price returns to an HVN, the probability of a reaction is extremely high. These zones act as strong memory points in the market.
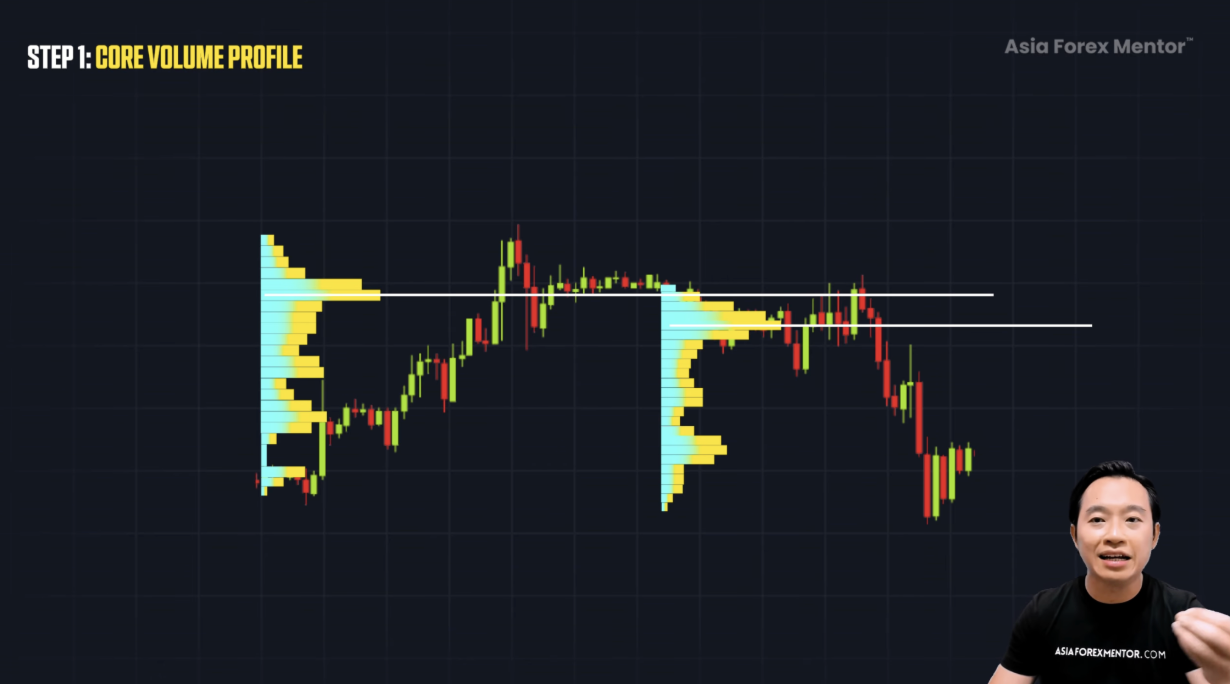
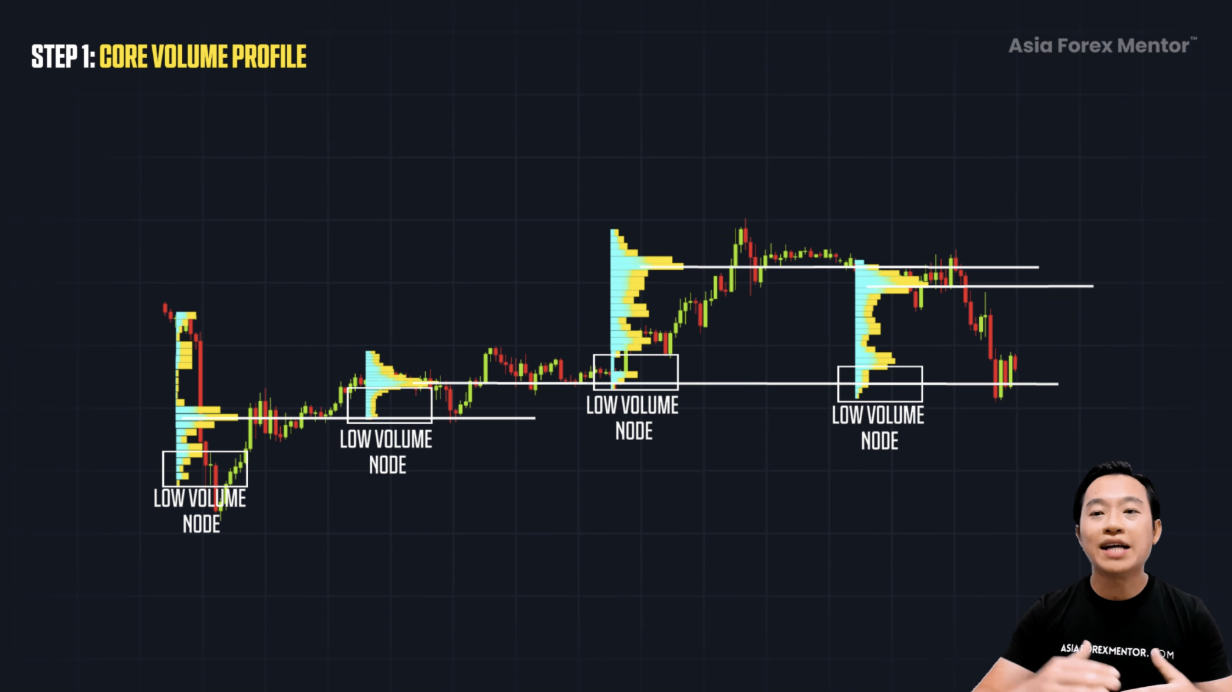
Low Volume Nodes (LVNs)
These are thin, empty areas on the profile.
Price tends to move quickly through LVNs because there is no real support or resistance in these zones.
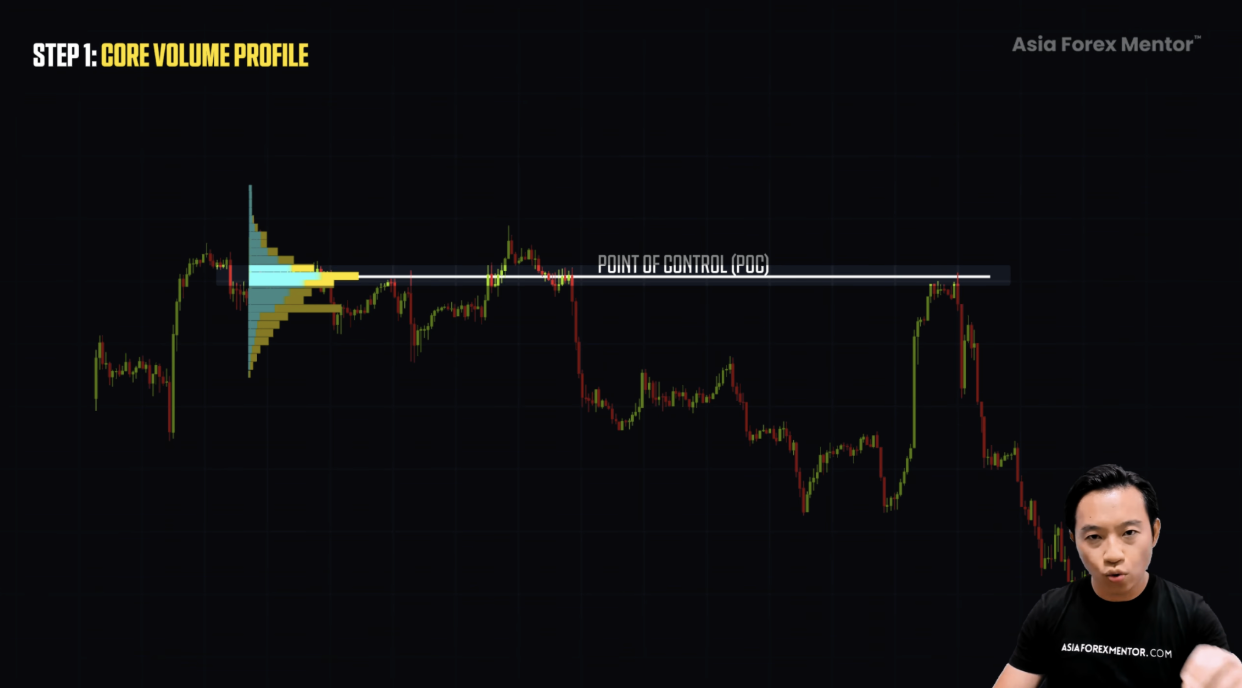
Value Area & Point of Control (POC)
The Value Area represents roughly 70% of the trading activity that occurred. It’s like the market’s “neighborhood.”
Inside that neighborhood sits the Point of Control (POC), the single price level with the highest traded volume.
The POC is the market’s favorite price, the level that holds the strongest conviction.
Once you understand:
- the value high
- the value low
- and the POC
you begin reading the market in a completely different way.
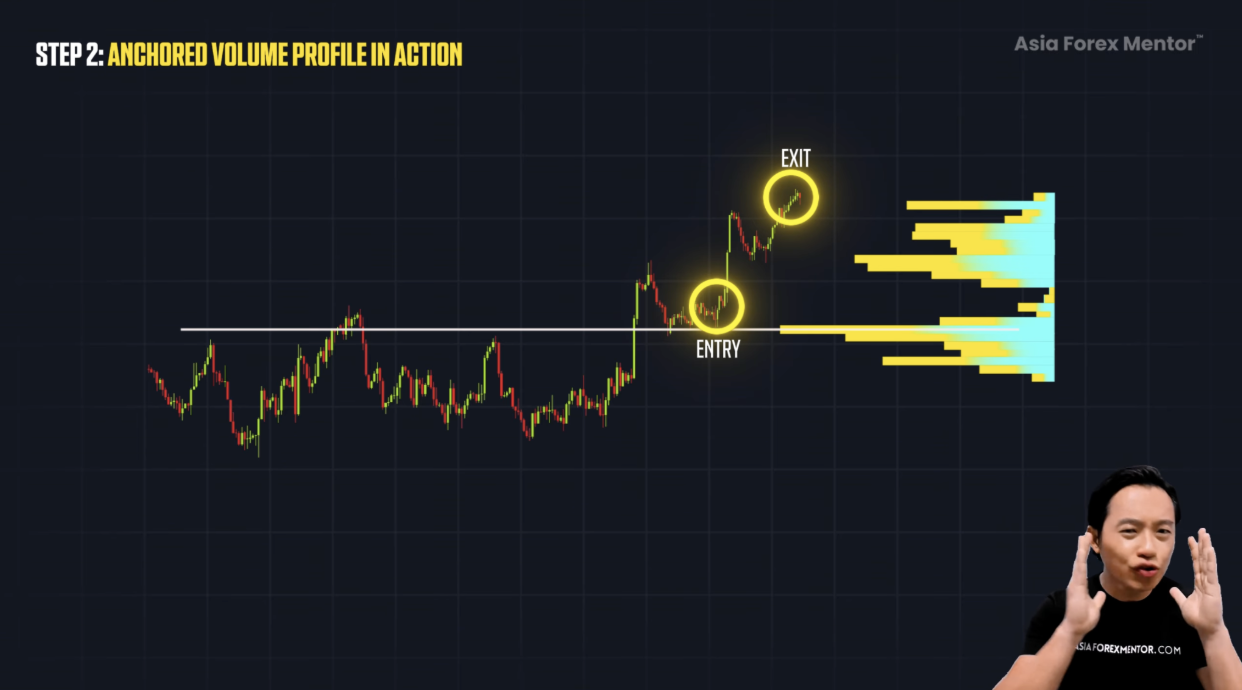
Step 2 — Anchored Volume Profile (The Precision Tool)
Every powerful market move begins somewhere. The Anchored Volume Profile allows you to isolate that move and analyze exactly how volume accumulated during it.
Anchoring gives you precision. You isolate a move and see its true strength instead of getting distracted by noise around it.
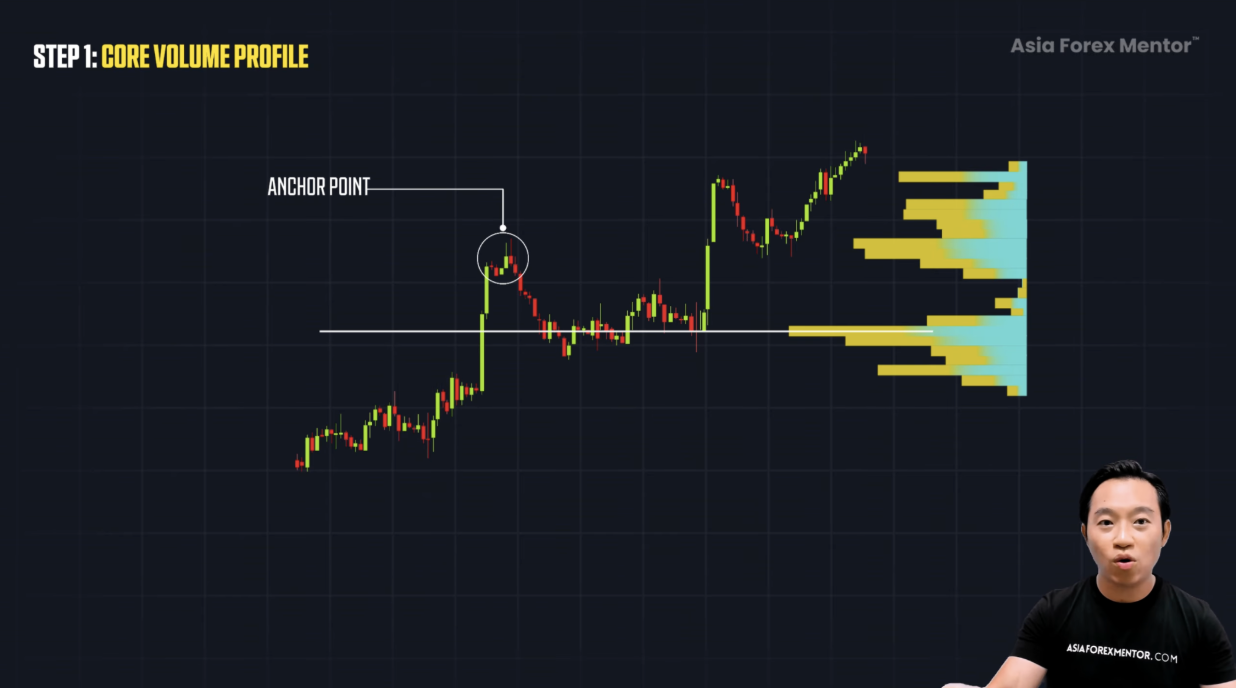
How Anchoring Works
You anchor the Volume Profile at the start of a move, such as:
- a breakout
- a reversal
- a strong swing
- a major impulse
Anchoring shows you:
- where heavy volume stepped in
- where congestion happened
- which levels traders defended
- which zones have the strongest memory
When price returns to these thick areas later, the market is essentially remembering where buyers and sellers had strong conviction. This is where institutions placed their bets.
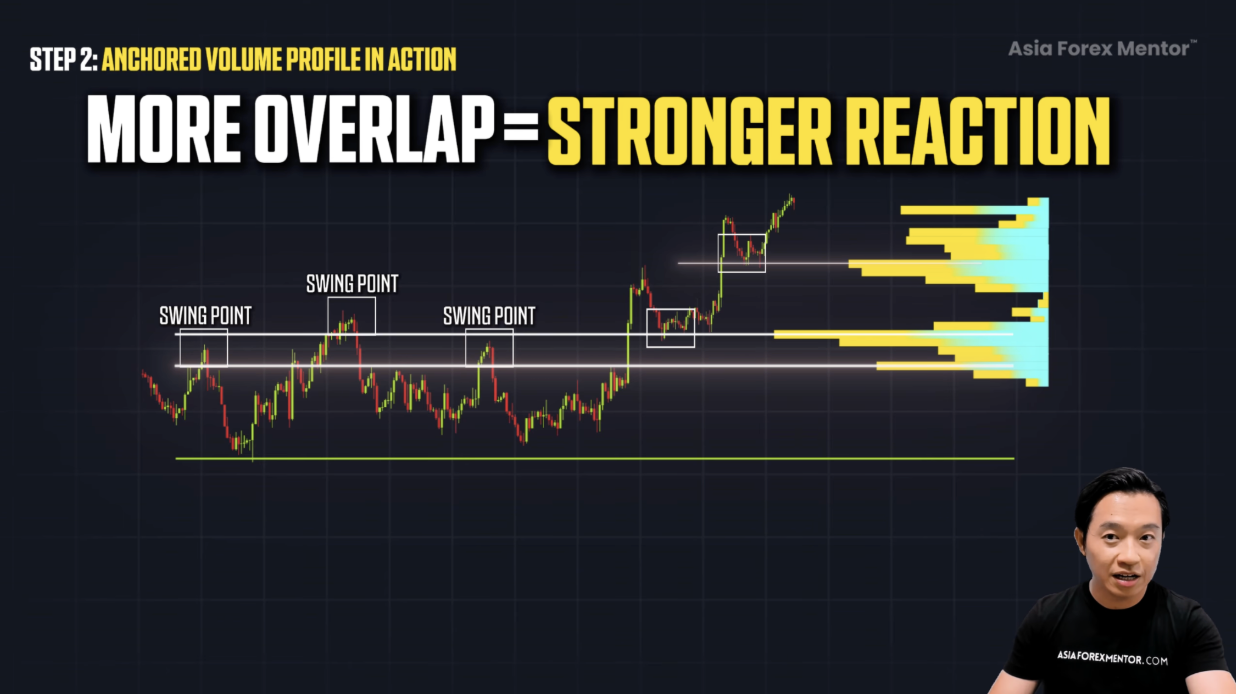
Creating Quality Zones With Confluence
Anchored Volume Profile becomes incredibly powerful when combined with:
- swing points
- support and resistance
- trend structure
When these overlap with high-volume areas, you form a quality zone, a zone built on market memory and structure, not luck.
A quality zone is strong enough to attract price toward it and strong enough to push price away from it. This is why these zones make some of the best entries and exits you will ever find.
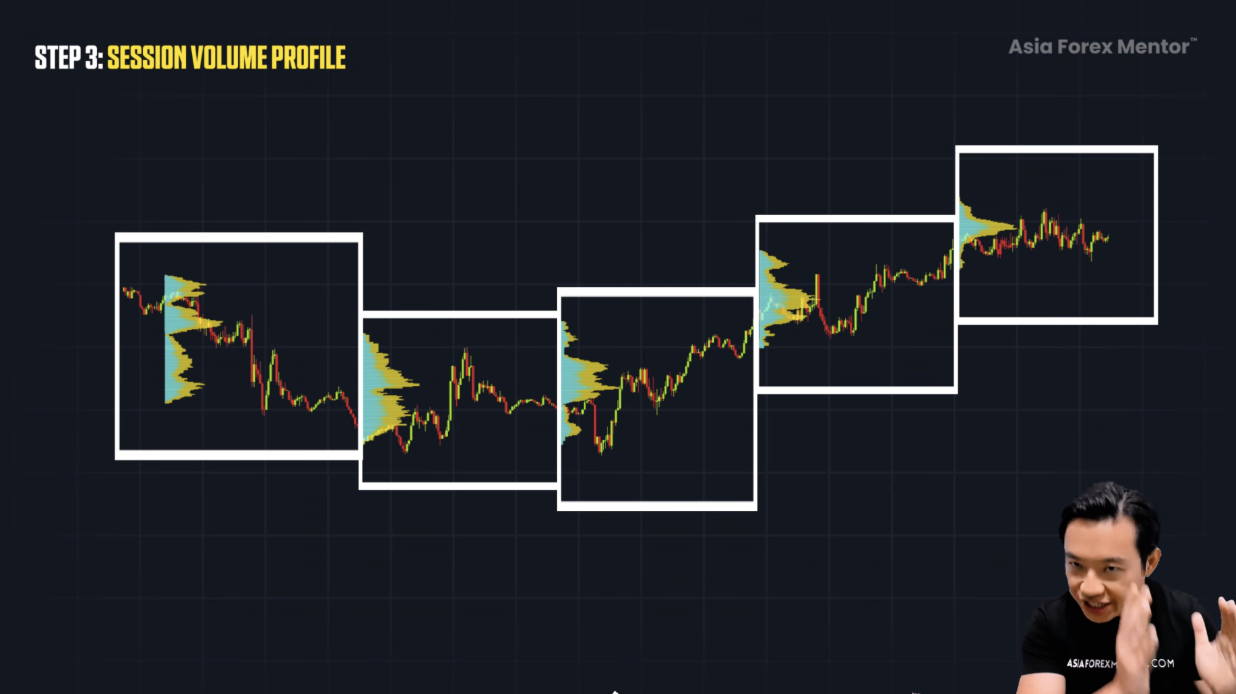
Step 3 — Session Volume Profile (The Intraday Blueprint)
If you trade lower timeframes, precision is everything. The Session Volume Profile gives you a daily blueprint of the market.
Each session represents a new battlefield.
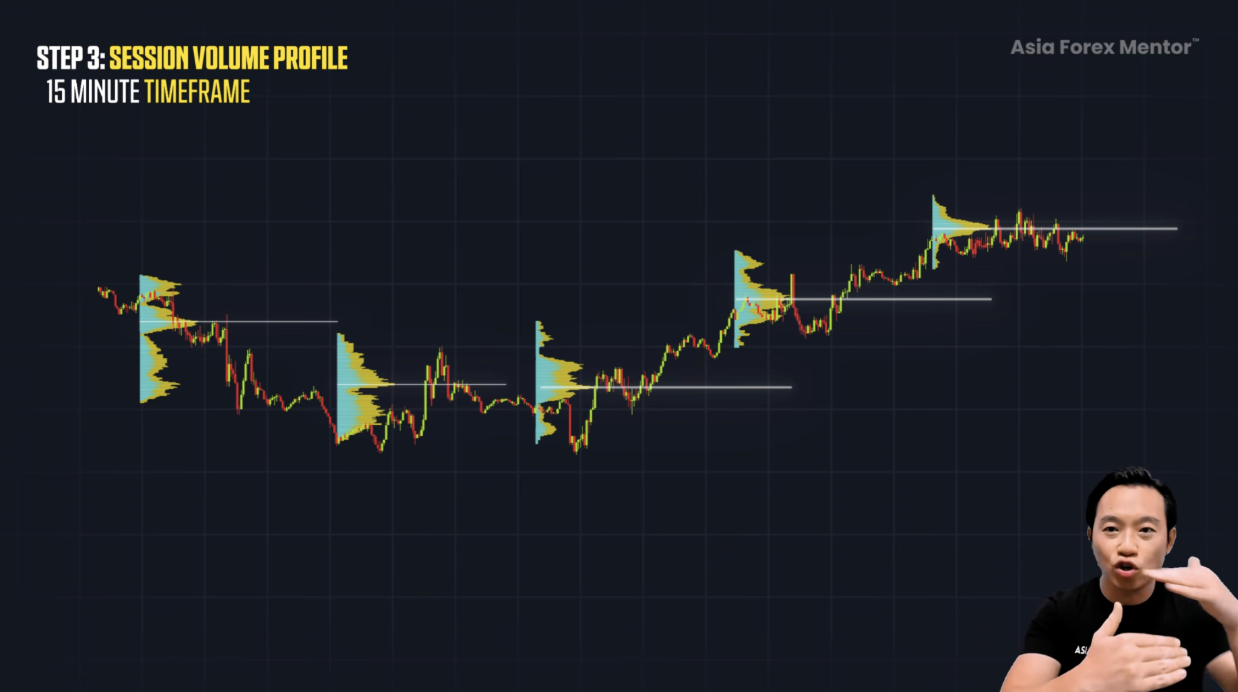
What the Session Profile Shows You
Each day has:
- its own Point of Control
- its own high-volume zones
- its own LVNs
- its own value area
This lets you see:
- where heavy trading occurred today
- where big players defended levels
- where clean reactions may form tomorrow
When the next session starts, the entire profile resets, giving you a clean, updated map.
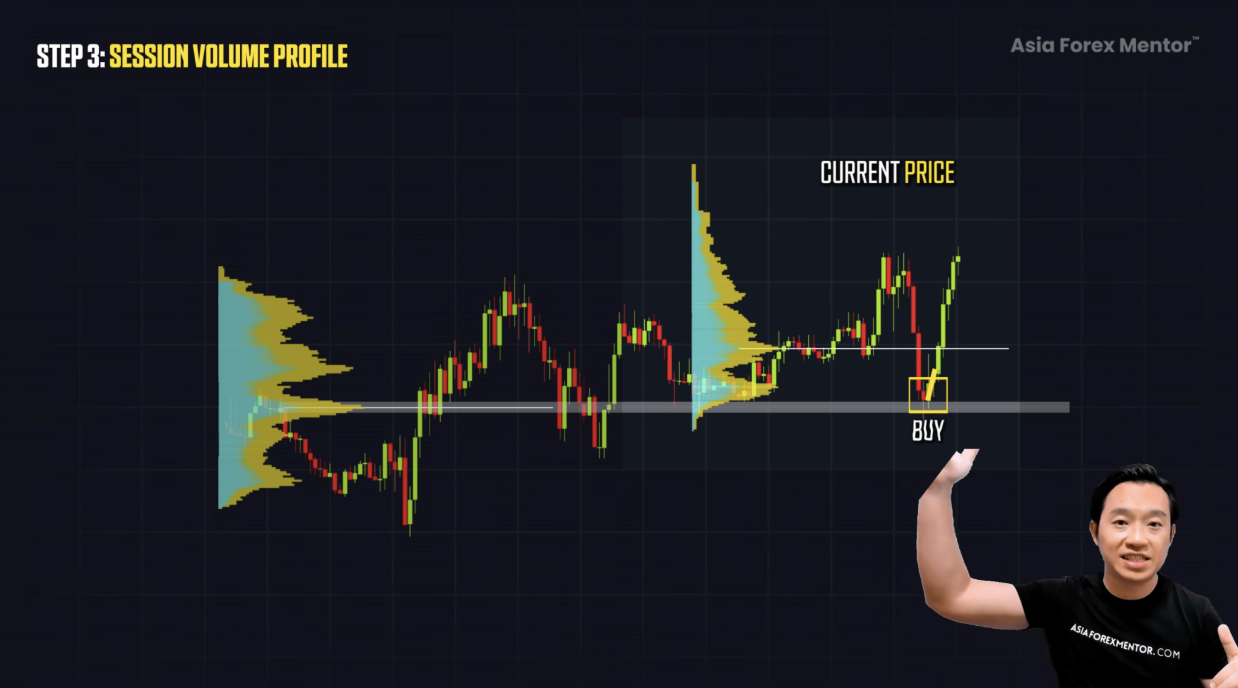
Why You Should Only Use the Previous Session’s POC
Most traders make the mistake of using today’s POC to make decisions.
But the current day's POC is unstable. It constantly shifts as new volume comes in. A POC you saw earlier can completely relocate later in the session, which means relying on it can easily produce misleading or fake trading signals.
This is why I only use yesterday’s POC.
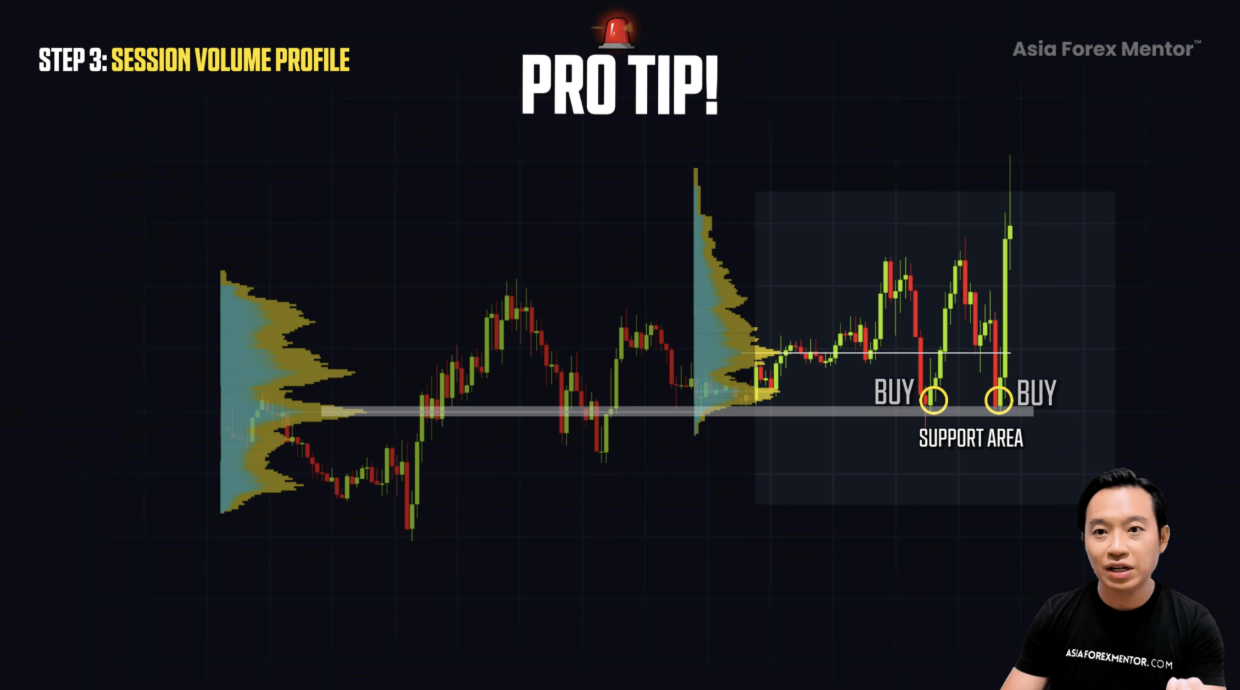
When price returns to the previous session’s POC, reactions are often very clean:
- long wicks
- dojis
- engulfing candles
- strong color changes
Whether it's a bounce or a reversal, this zone has extremely high probability.
Why You Should Only Use the Previous Session’s POC
Most traders make the mistake of using today’s POC to make decisions.
But the current day's POC is unstable. It constantly shifts as new volume comes in. A POC you saw earlier can completely relocate later in the session, which means relying on it can easily produce misleading or fake trading signals.
This is why I only use yesterday’s POC.
When price returns to the previous session’s POC, reactions are often very clean:
- long wicks
- dojis
- engulfing candles
- strong color changes
Whether it's a bounce or a reversal, this zone has extremely high probability.
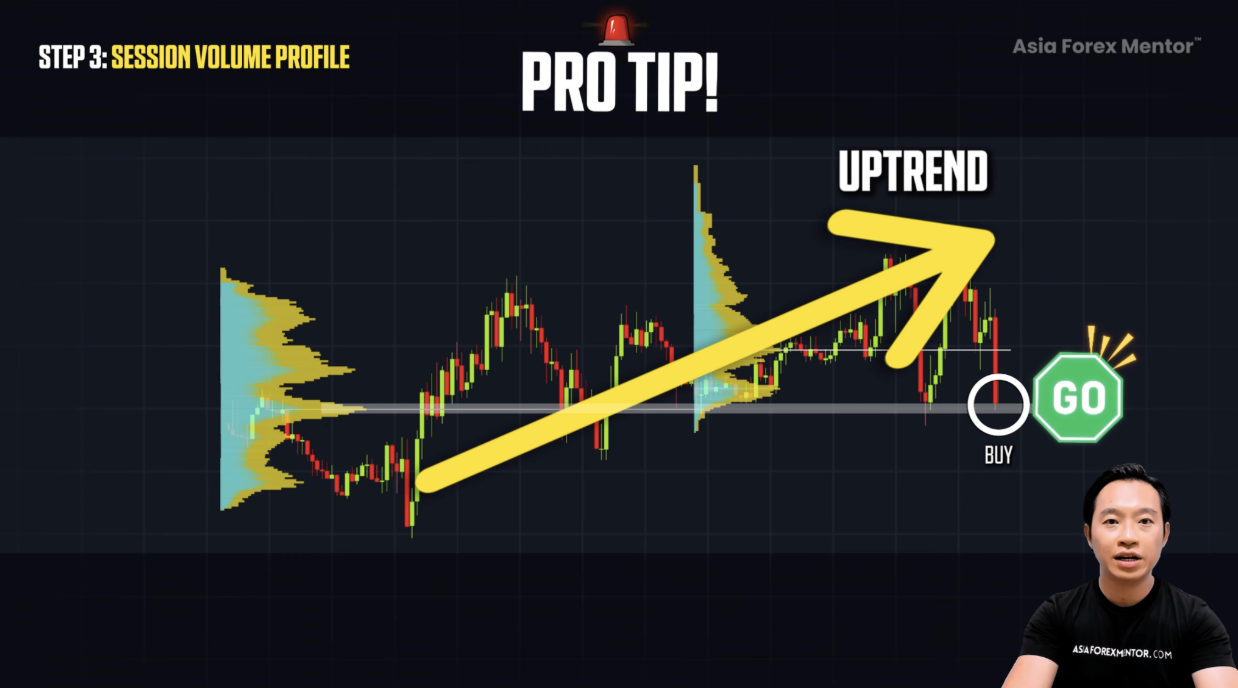
For example, if a short trade rejects a previous resistance area, or like I said earlier, a long trade bounces off a support area. That is grounded now with not just randomness, but solid foundation, solid backing for it to push its way upwards.
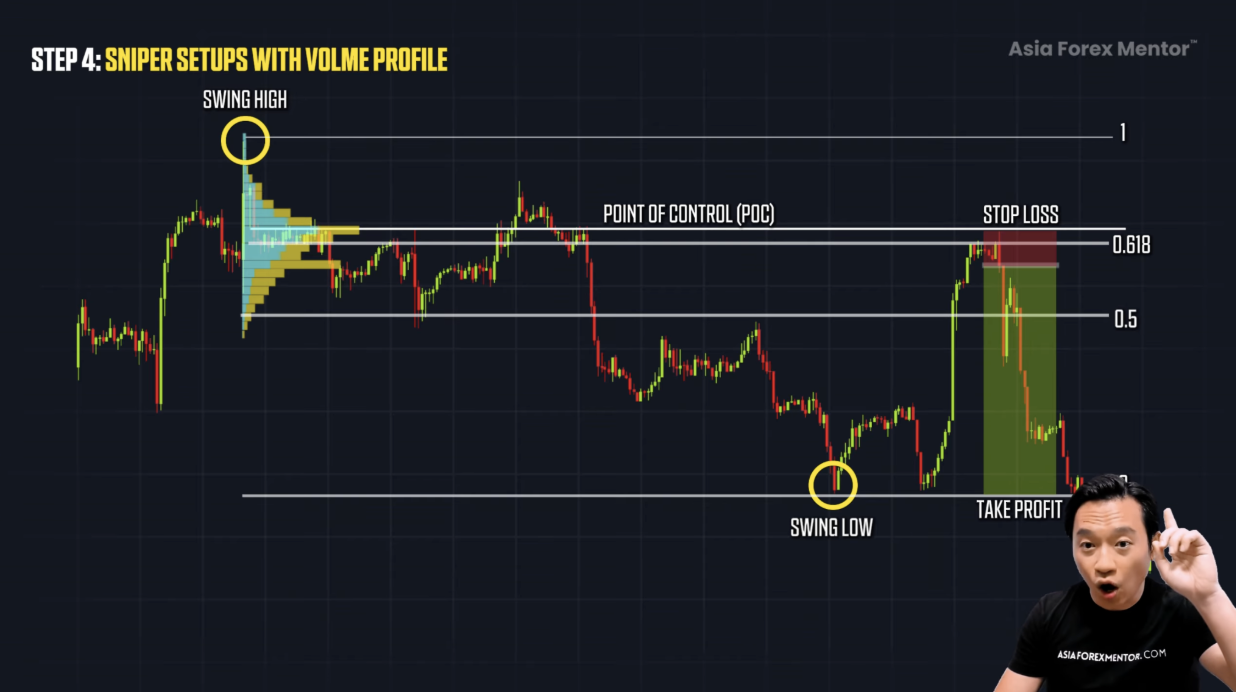
Step 4 — Calling Sniper Entries With Confluence
Now that you know how to mark your high-volume zones, the next step is turning those levels into actual trading setups.
Confluence is the key.
As we know, it's never wise to just rely on one signal alone. So this is where we can add our Fibonacci retracement.
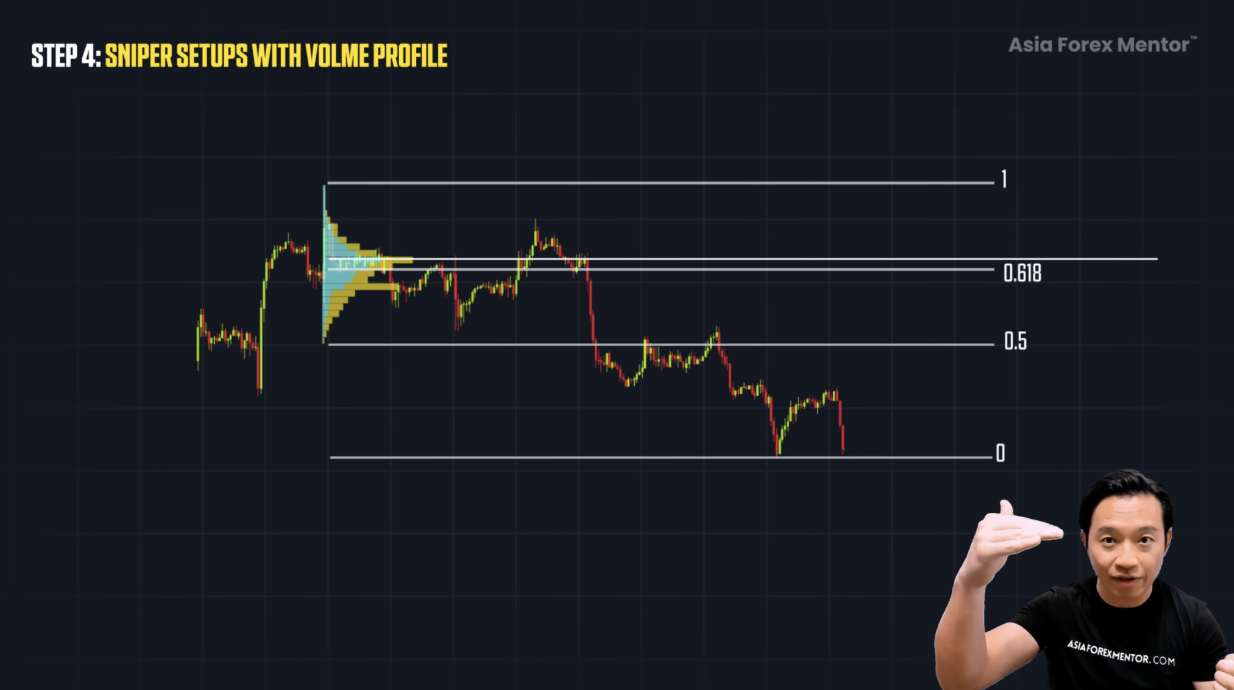
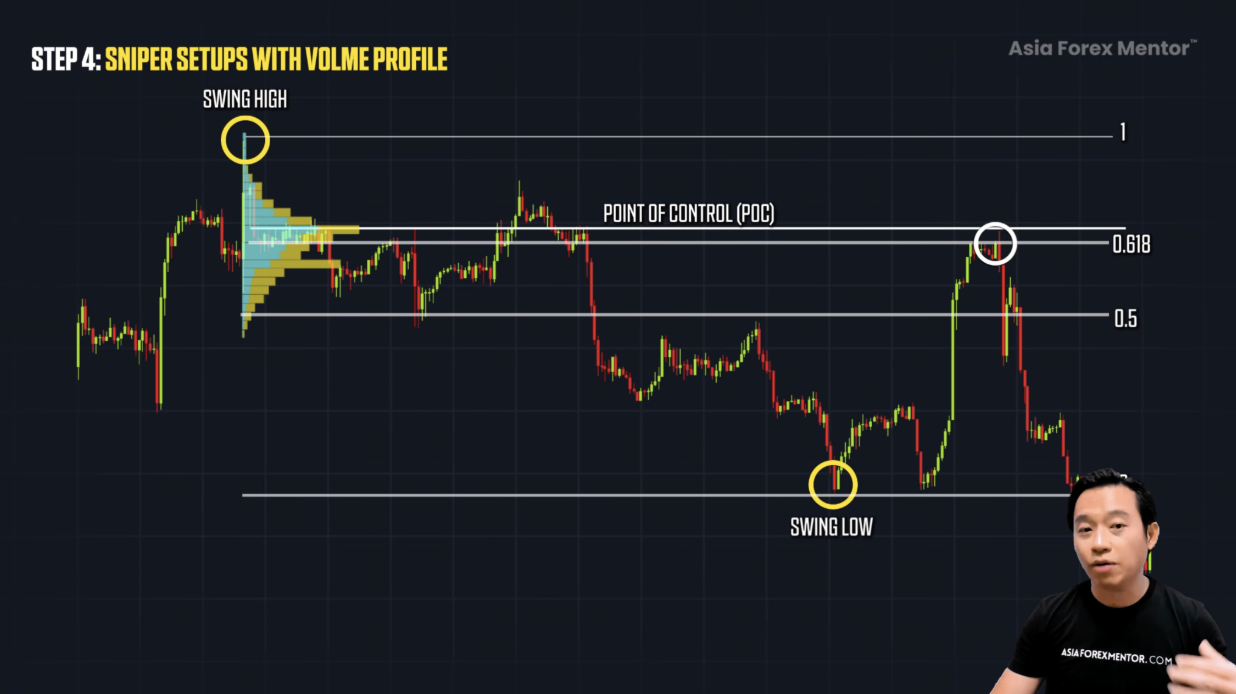
A solid setup starts with spotting the swing high and swing low. These levels show where the market turned, and they guide everything that comes next. Once they’re marked, pull out your Fibonacci retracement. The focus is simple: find the key zones where price is most likely to react, especially the 61.8 percent and 50 percent areas.
The setup becomes even stronger when these Fib zones overlap with the Point of Control. That overlap tells you the market has a reason to pause there. But don’t enter just because the price taps the level. A touch means nothing. You wait for a reaction.
The reaction comes through your confirmation candle. A bearish engulfing signals the sell. A bullish engulfing signals the buy. That’s the moment momentum shifts in your favor. Your stop goes just beyond the wick or the engulfing candle’s high or low. Keep it tight, keep it logical.
For profit, target the next structure, a previous high, or a low-volume gap where price can move quickly.
When your entries reach this level of precision, your risk-to-reward becomes sharp and controlled. That’s when consistency starts to show up.
Why Volume Profile Works So Well
Volume Profile isn’t just another indicator. It shows where real transactions happened, where the traders who actually move the market made their decisions. Once you see where the battles took place, where volume stacked up, and where the market showed conviction, everything starts to make sense. You even spot the zones where traders defended their positions with strength.
Volume Profile Strategy Summary
- Volume Profile shows where real money traded
- HVNs are strong reaction zones
- LVNs create fast movement zones
- POC = highest conviction price
- Anchored Volume Profile isolates specific moves
- Session Profile resets daily
- Use yesterday’s POC, not today’s
- Combine volume, structure, trend, and Fibonacci
- Wait for candlestick confirmation before entering
- Sniper setups come from multiple confluences
FAQ’s
What is Volume Profile in the simplest possible way?
Volume Profile shows where most traders bought and sold at each price level.
It tells me which prices are strong (lots of trading) and which prices are weak (very little trading). This makes it easier to spot support, resistance, and places where price will react.
What is the Point of Control (POC) and why does it matter?
The POC is the price level with the highest traded volume. It acts like a “magnet” where price often reacts, pauses, or reverses. For beginners, this is the easiest and most reliable place to start analyzing market reactions.
What are High Volume Nodes (HVNs) and Low Volume Nodes (LVNs)?
High Volume Nodes are price levels where a lot of trading happened, which makes those levels strong and stable. Low Volume Nodes are the opposite, very little trading occurred at those prices, so the market tends to move through them quickly. The simple rule is this: price usually slows down or bounces at HVNs, while it travels fast and clean through LVNs


