👋 Hey, what’s up, traders! It’s Ezekiel Chew here, and today we’re going to dive deep into the Piercing Line Pattern, one of the most under-the-radar candlestick patterns that can quietly signal a major shift in market direction.
Let me ask you this:
👉 Have you ever bought during a downtrend, hoping it would reverse, only to watch the price keep falling?
It sucks, and it happens because most traders don’t know what a real reversal looks like.
That’s where the Piercing Line Pattern comes in.
✅ It’s your signal that sellers are losing steam and buyers are stepping up.
✅ It gives you a low-risk, high-reward opportunity to enter the market at the right time — without guessing or chasing.
🔍 In this guide, you’ll discover:
1️⃣ What the Piercing Line Pattern is and how it works
2️⃣ How to identify it clearly on your chart
3️⃣ How to confirm its strength using volume and support zones
4️⃣ Real-life trading examples to visualize how it plays out
5️⃣ Entry and exit strategies to trade this pattern with confidence
If you’re tired of entering too late, or getting faked out by weak reversals, then this pattern could be a real game-changer for you.
📺 Watch the full breakdown in this video:
What Is the Piercing Line Pattern?
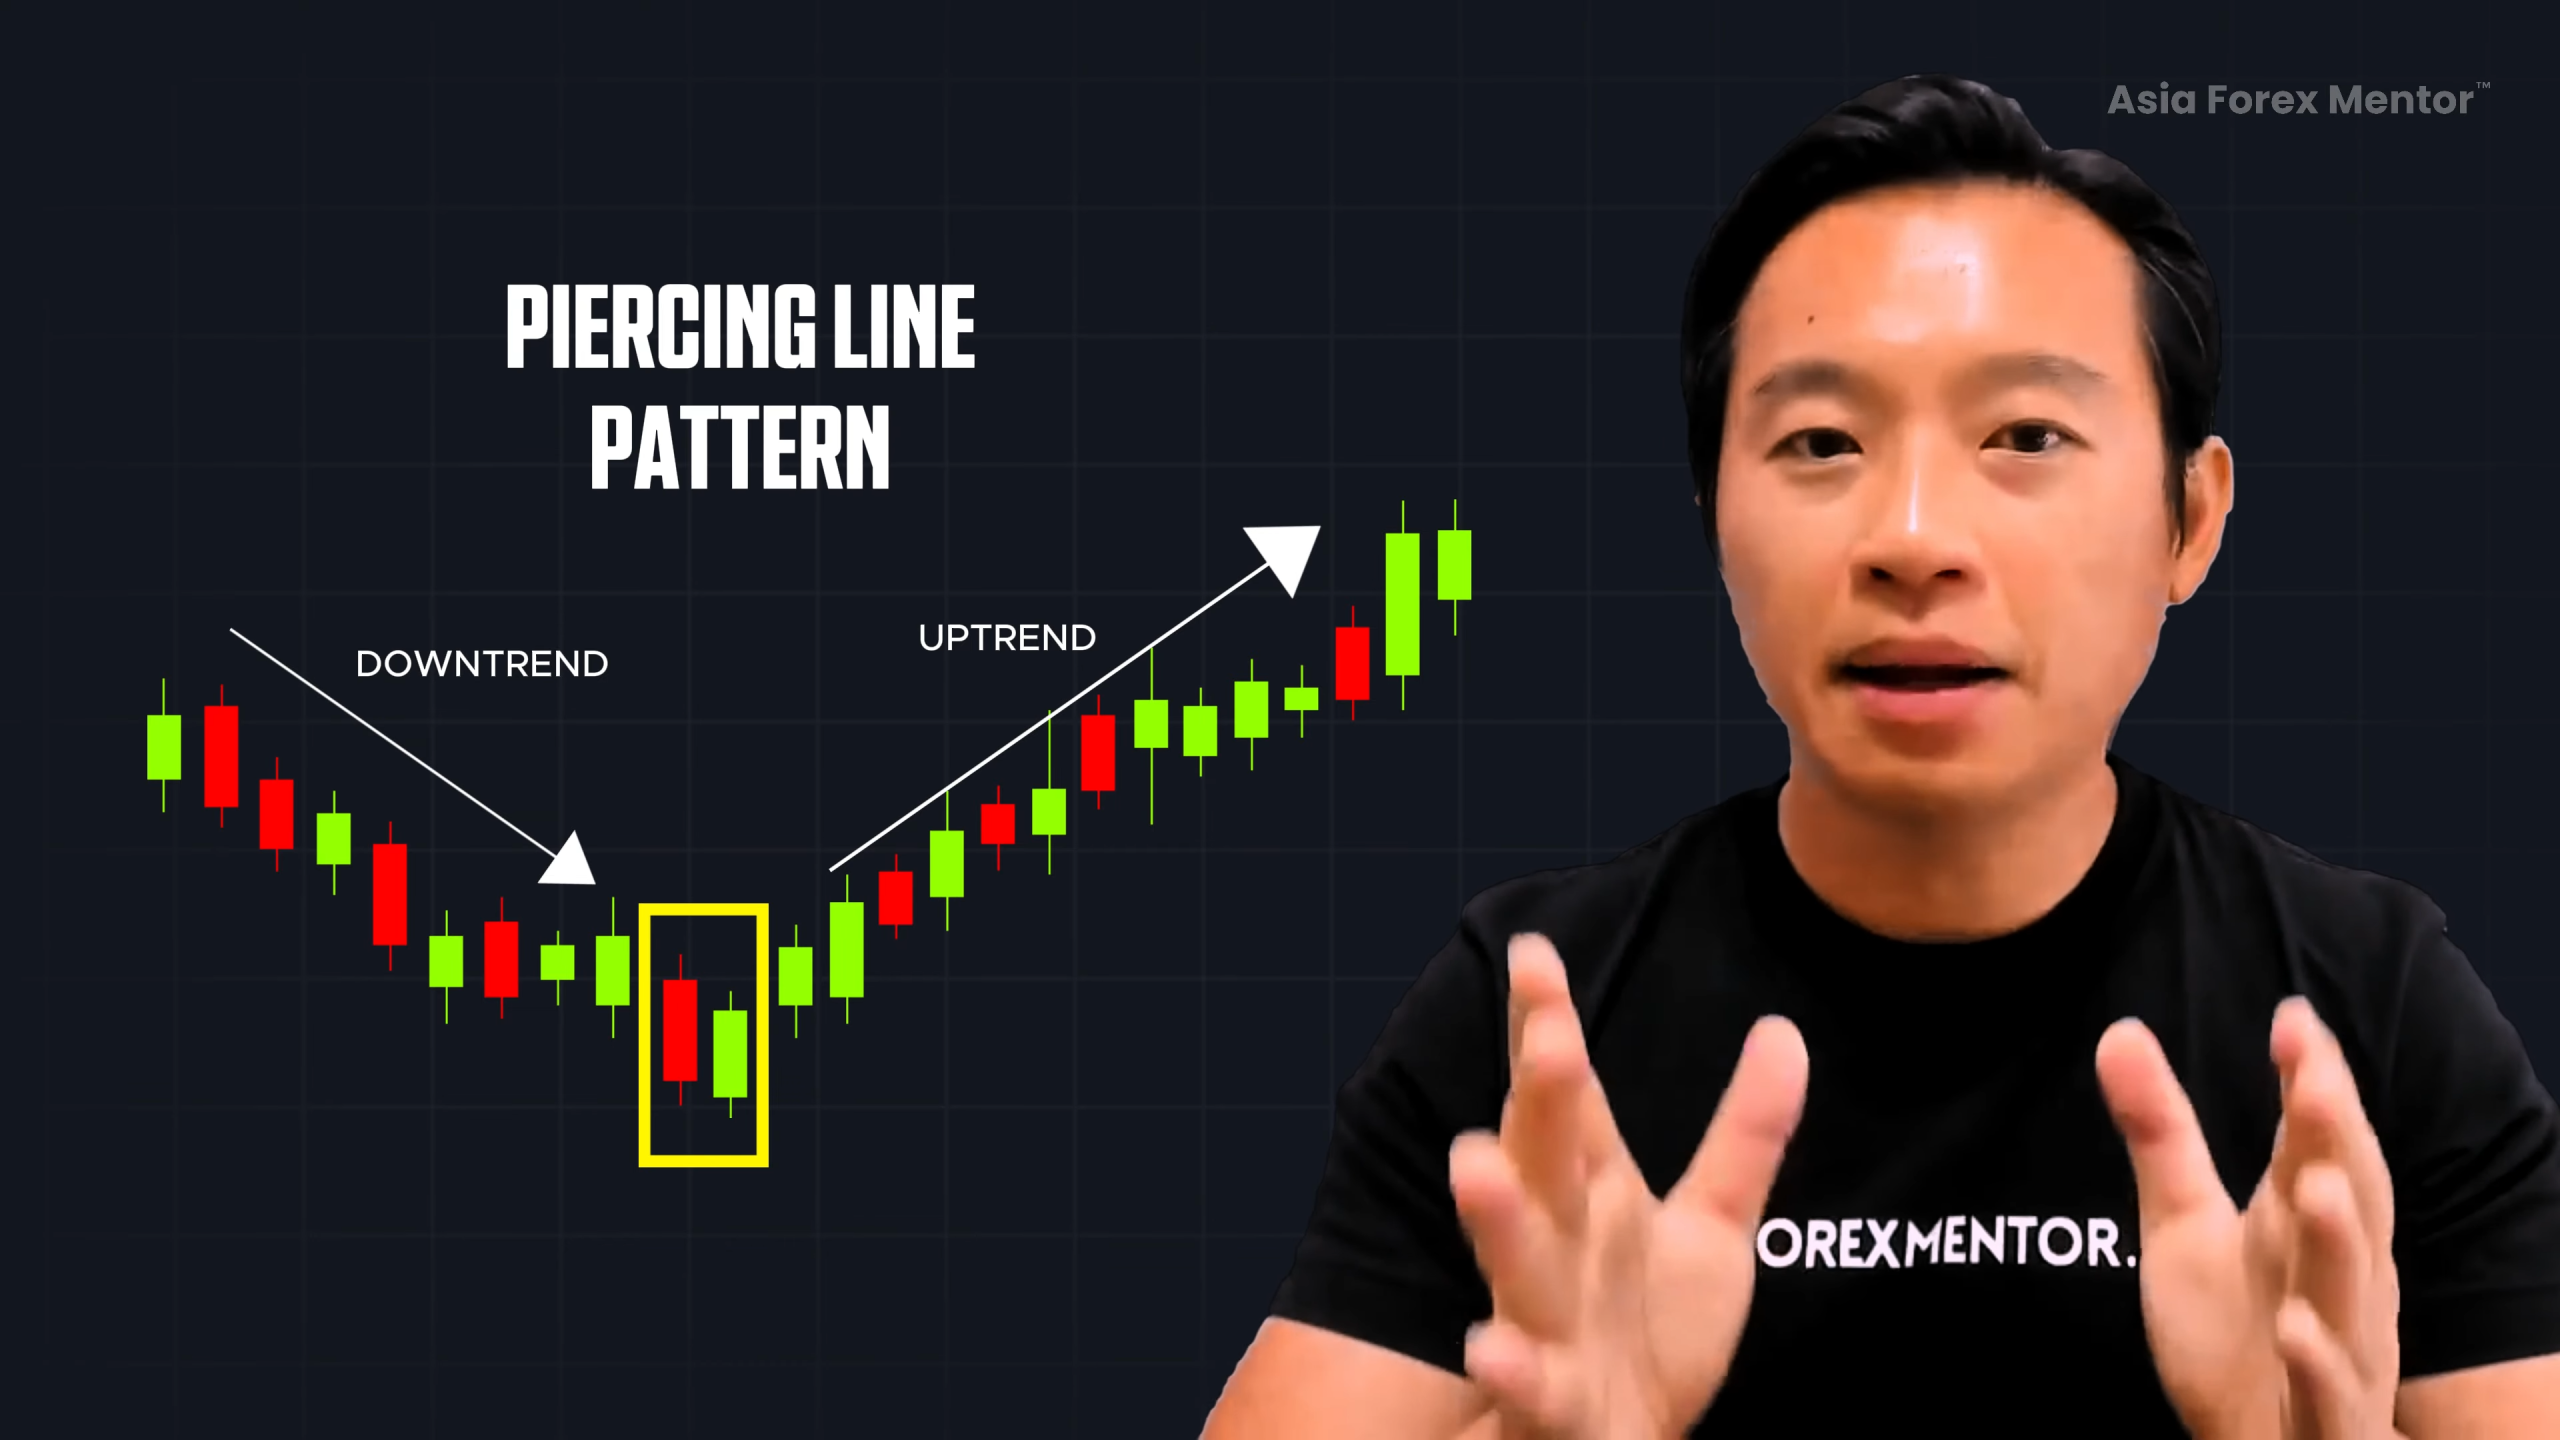
📊 A powerful two-candle formation
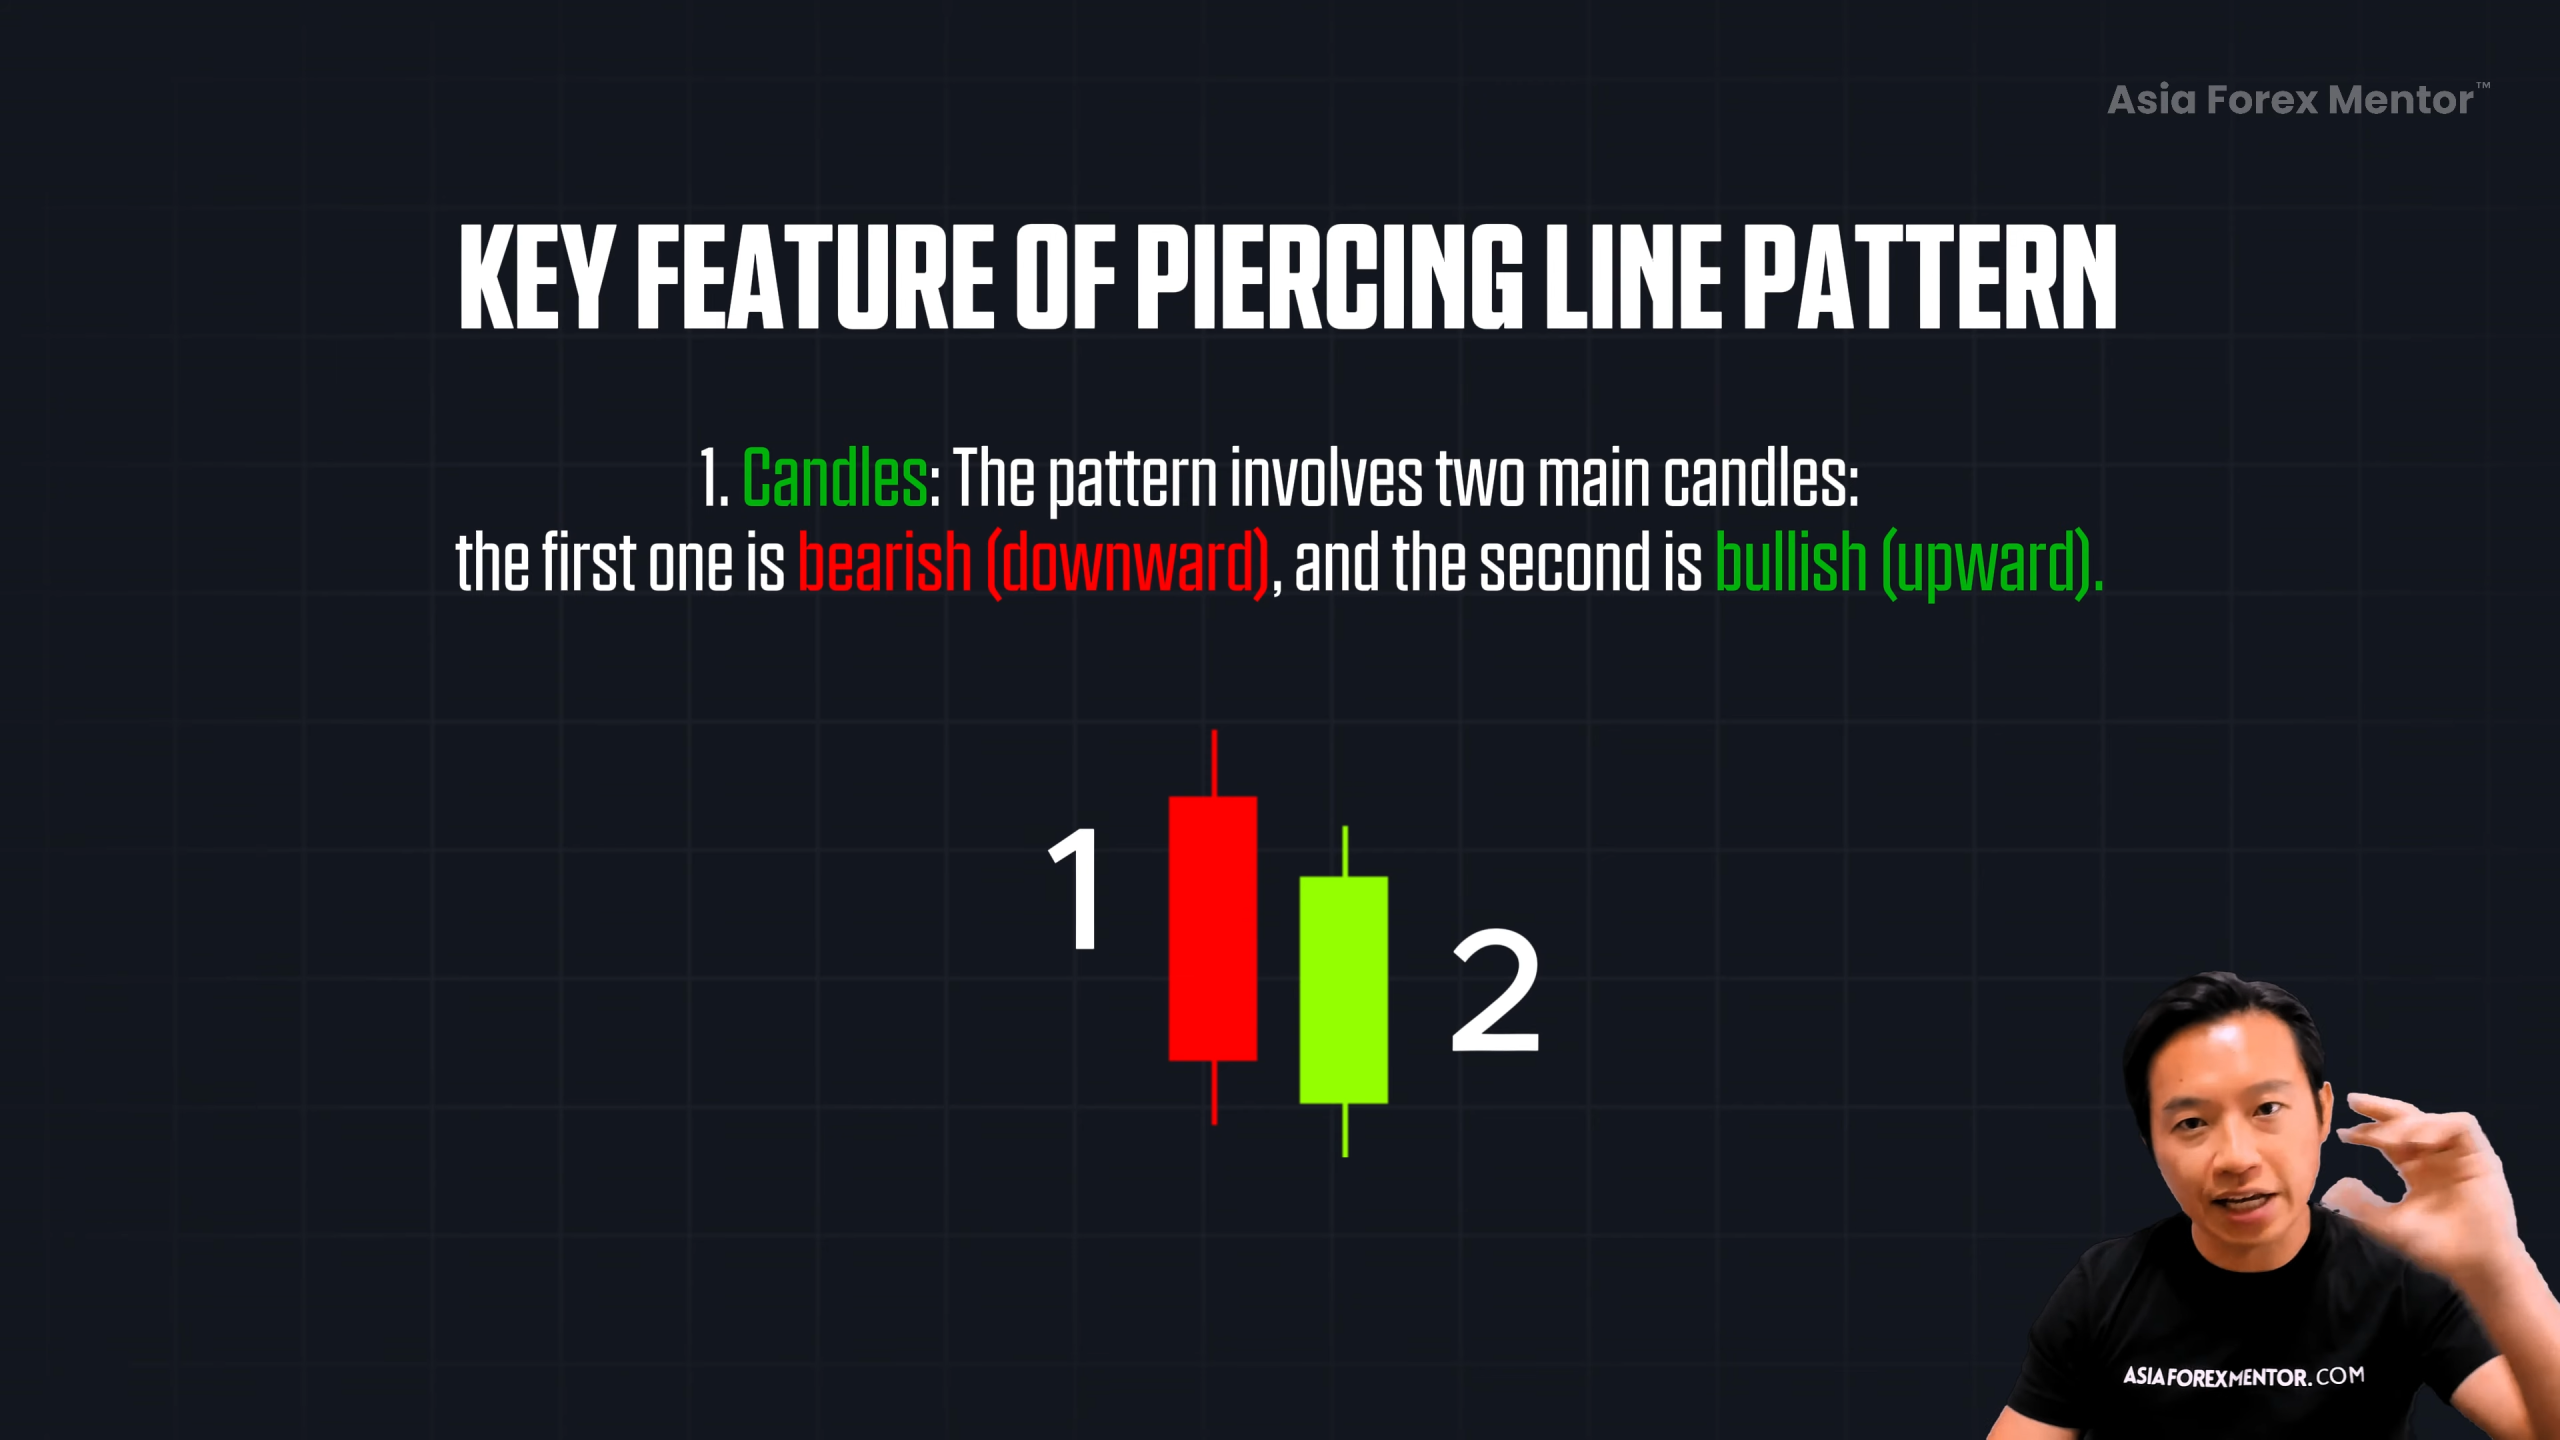
The Piercing Line is a bullish candlestick pattern made up of two candles:
-
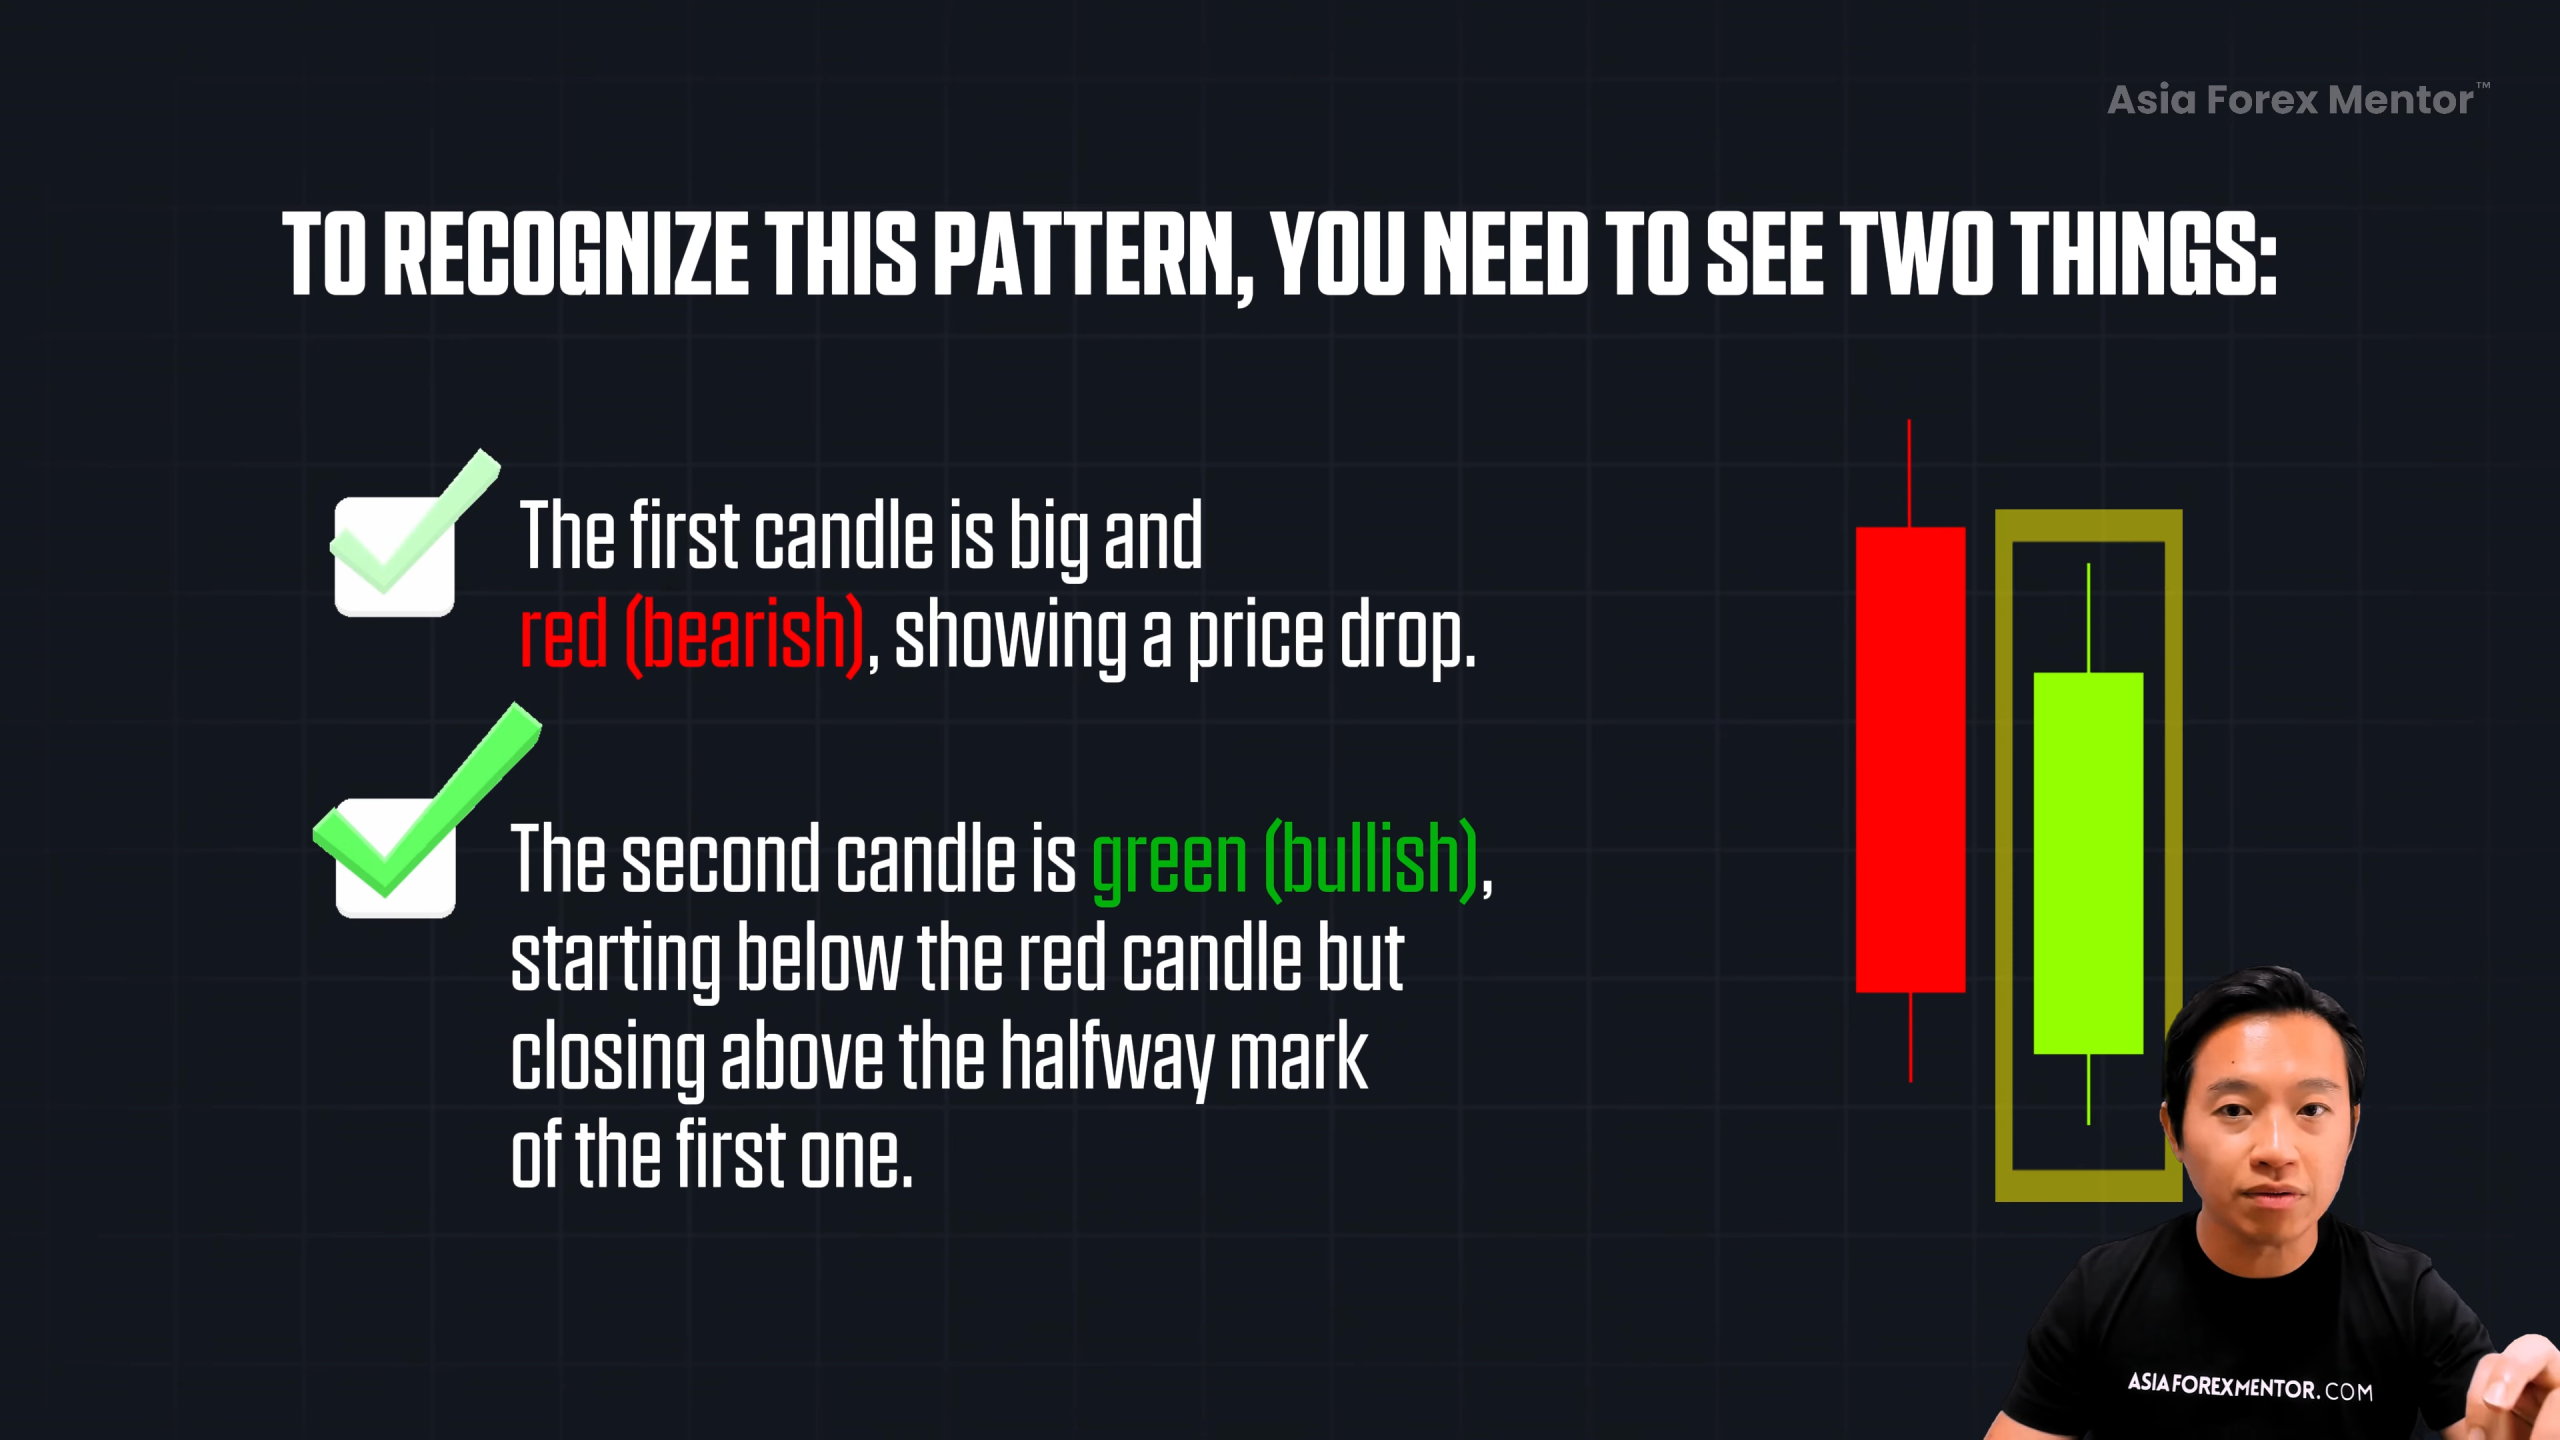
🔴 Candle 1: A strong bearish candle showing seller momentum
-
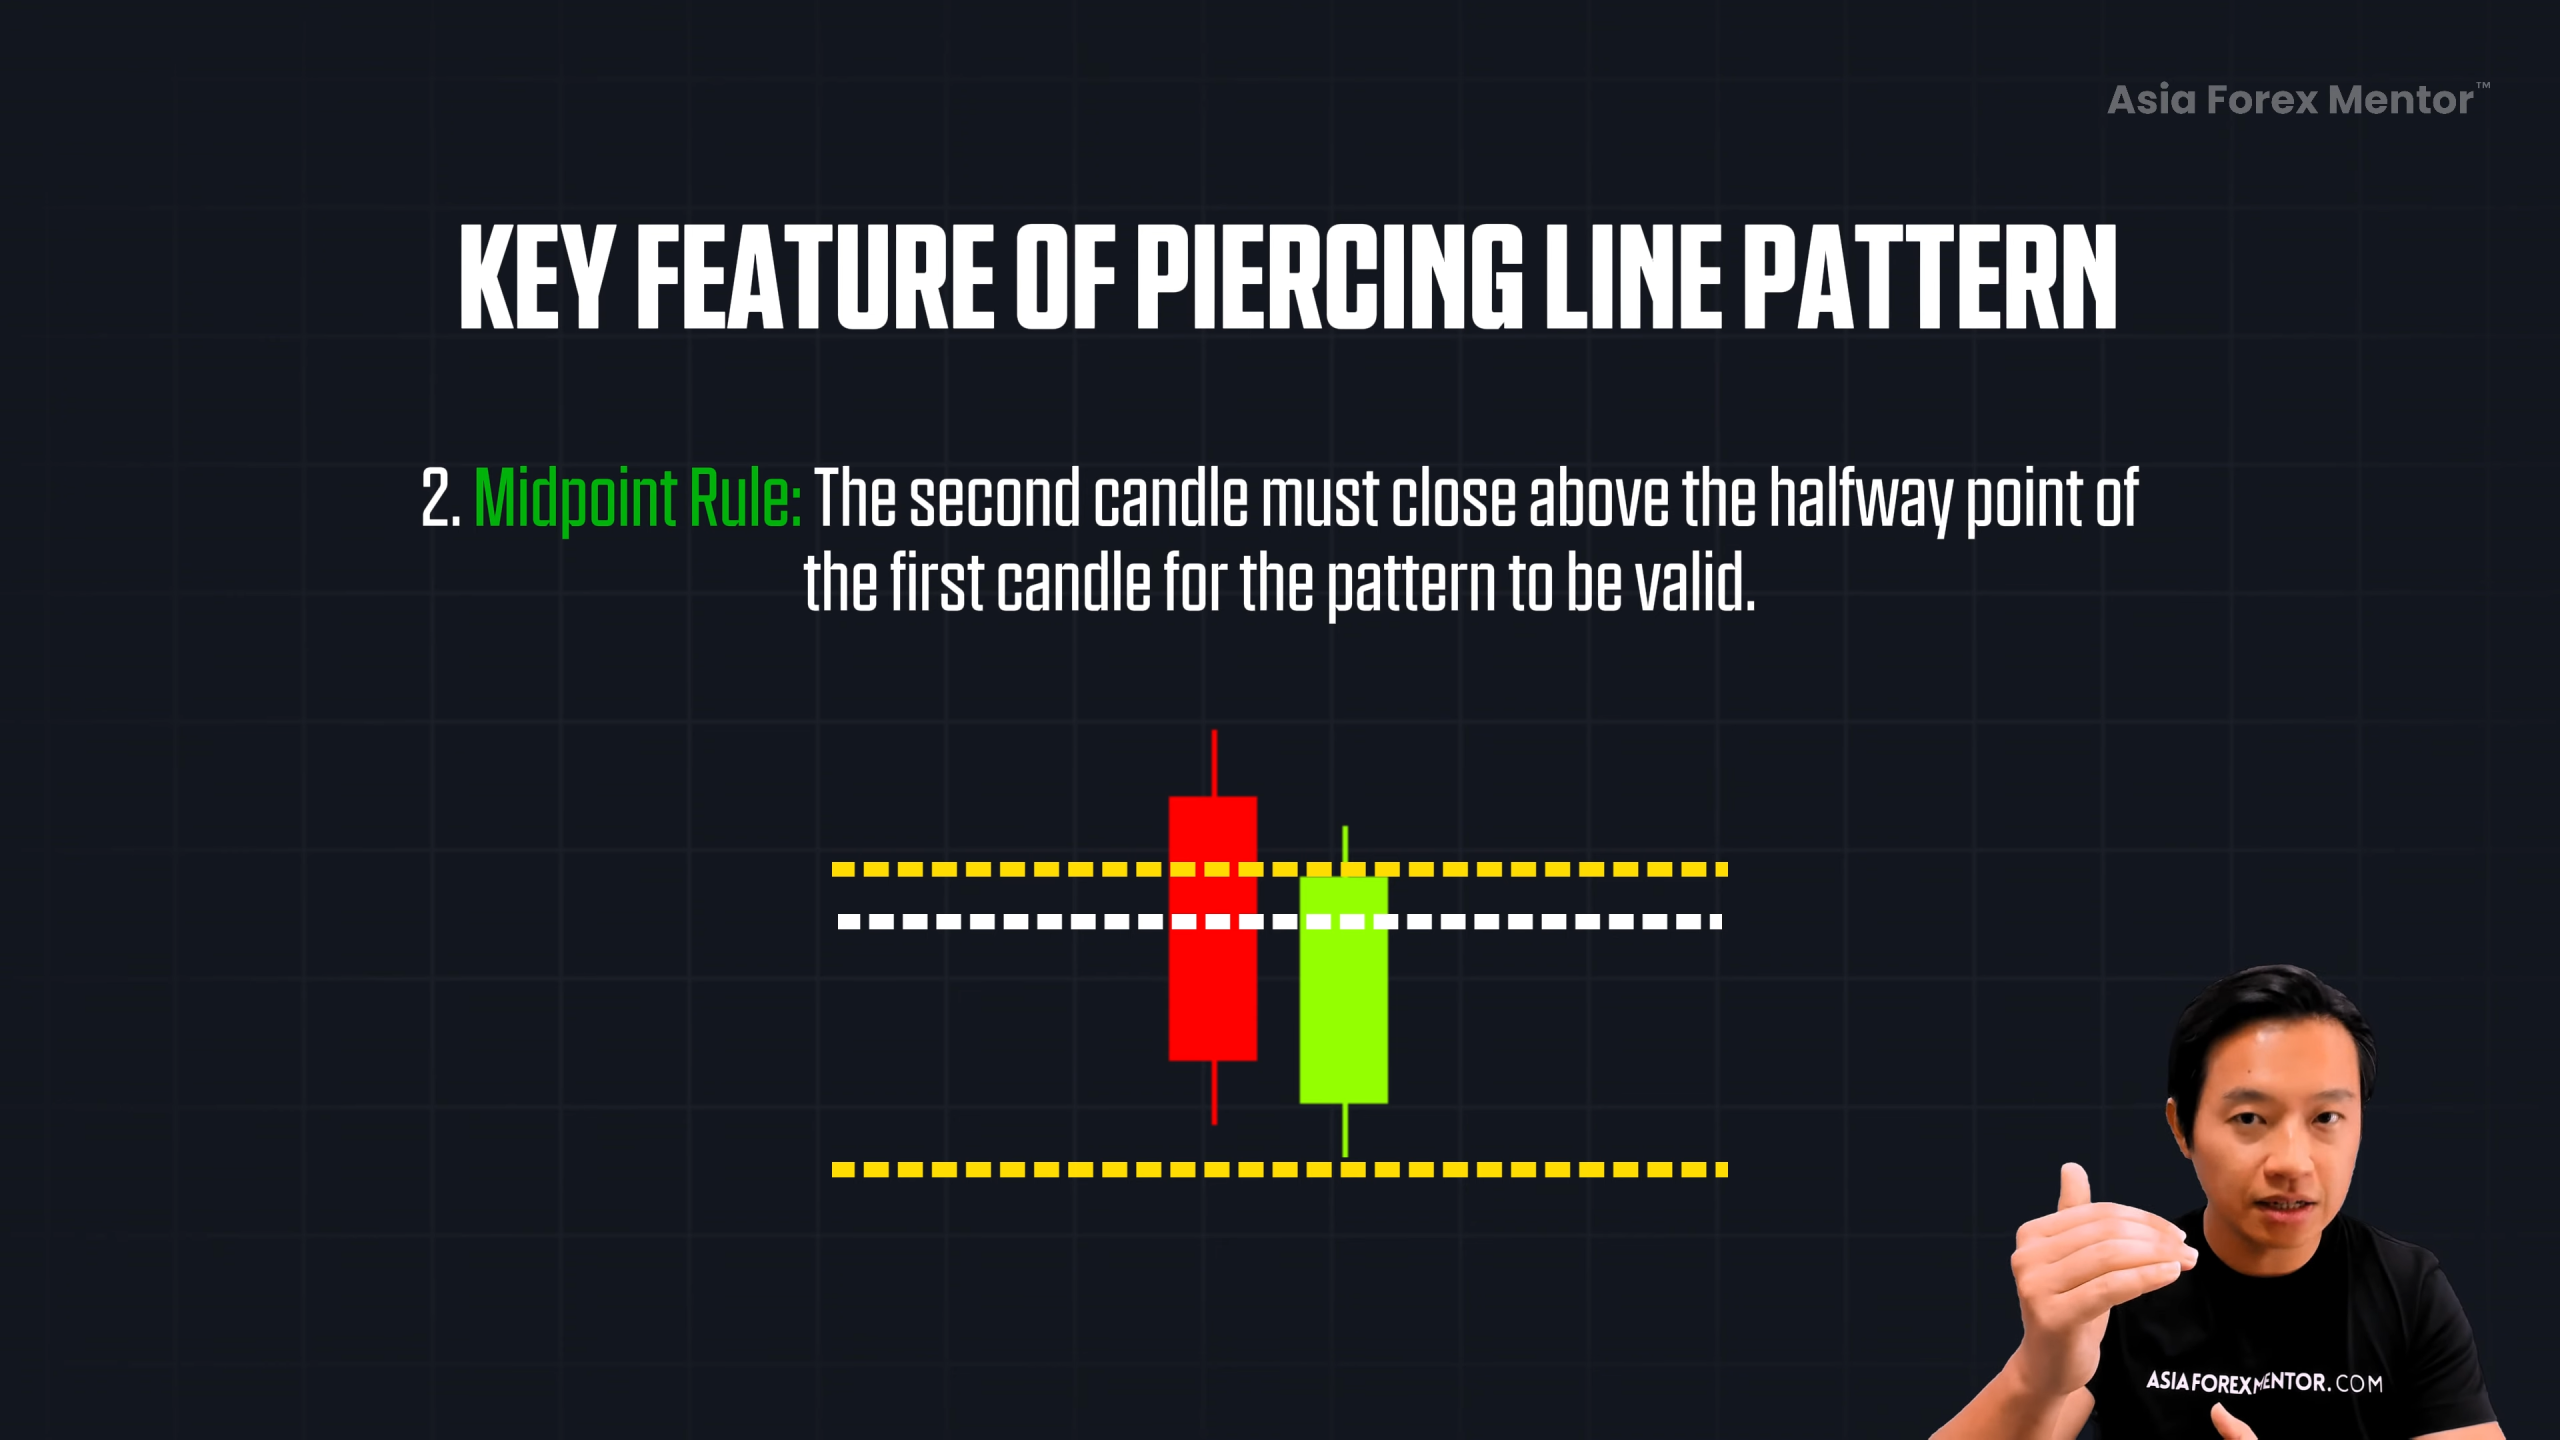
🟢 Candle 2: A bullish candle that opens below the red candle’s low and closes above its midpoint
This simple but significant move shows that buyers are fighting back, and it may be a sign that the downtrend is losing strength.
How the Piercing Line Pattern Works
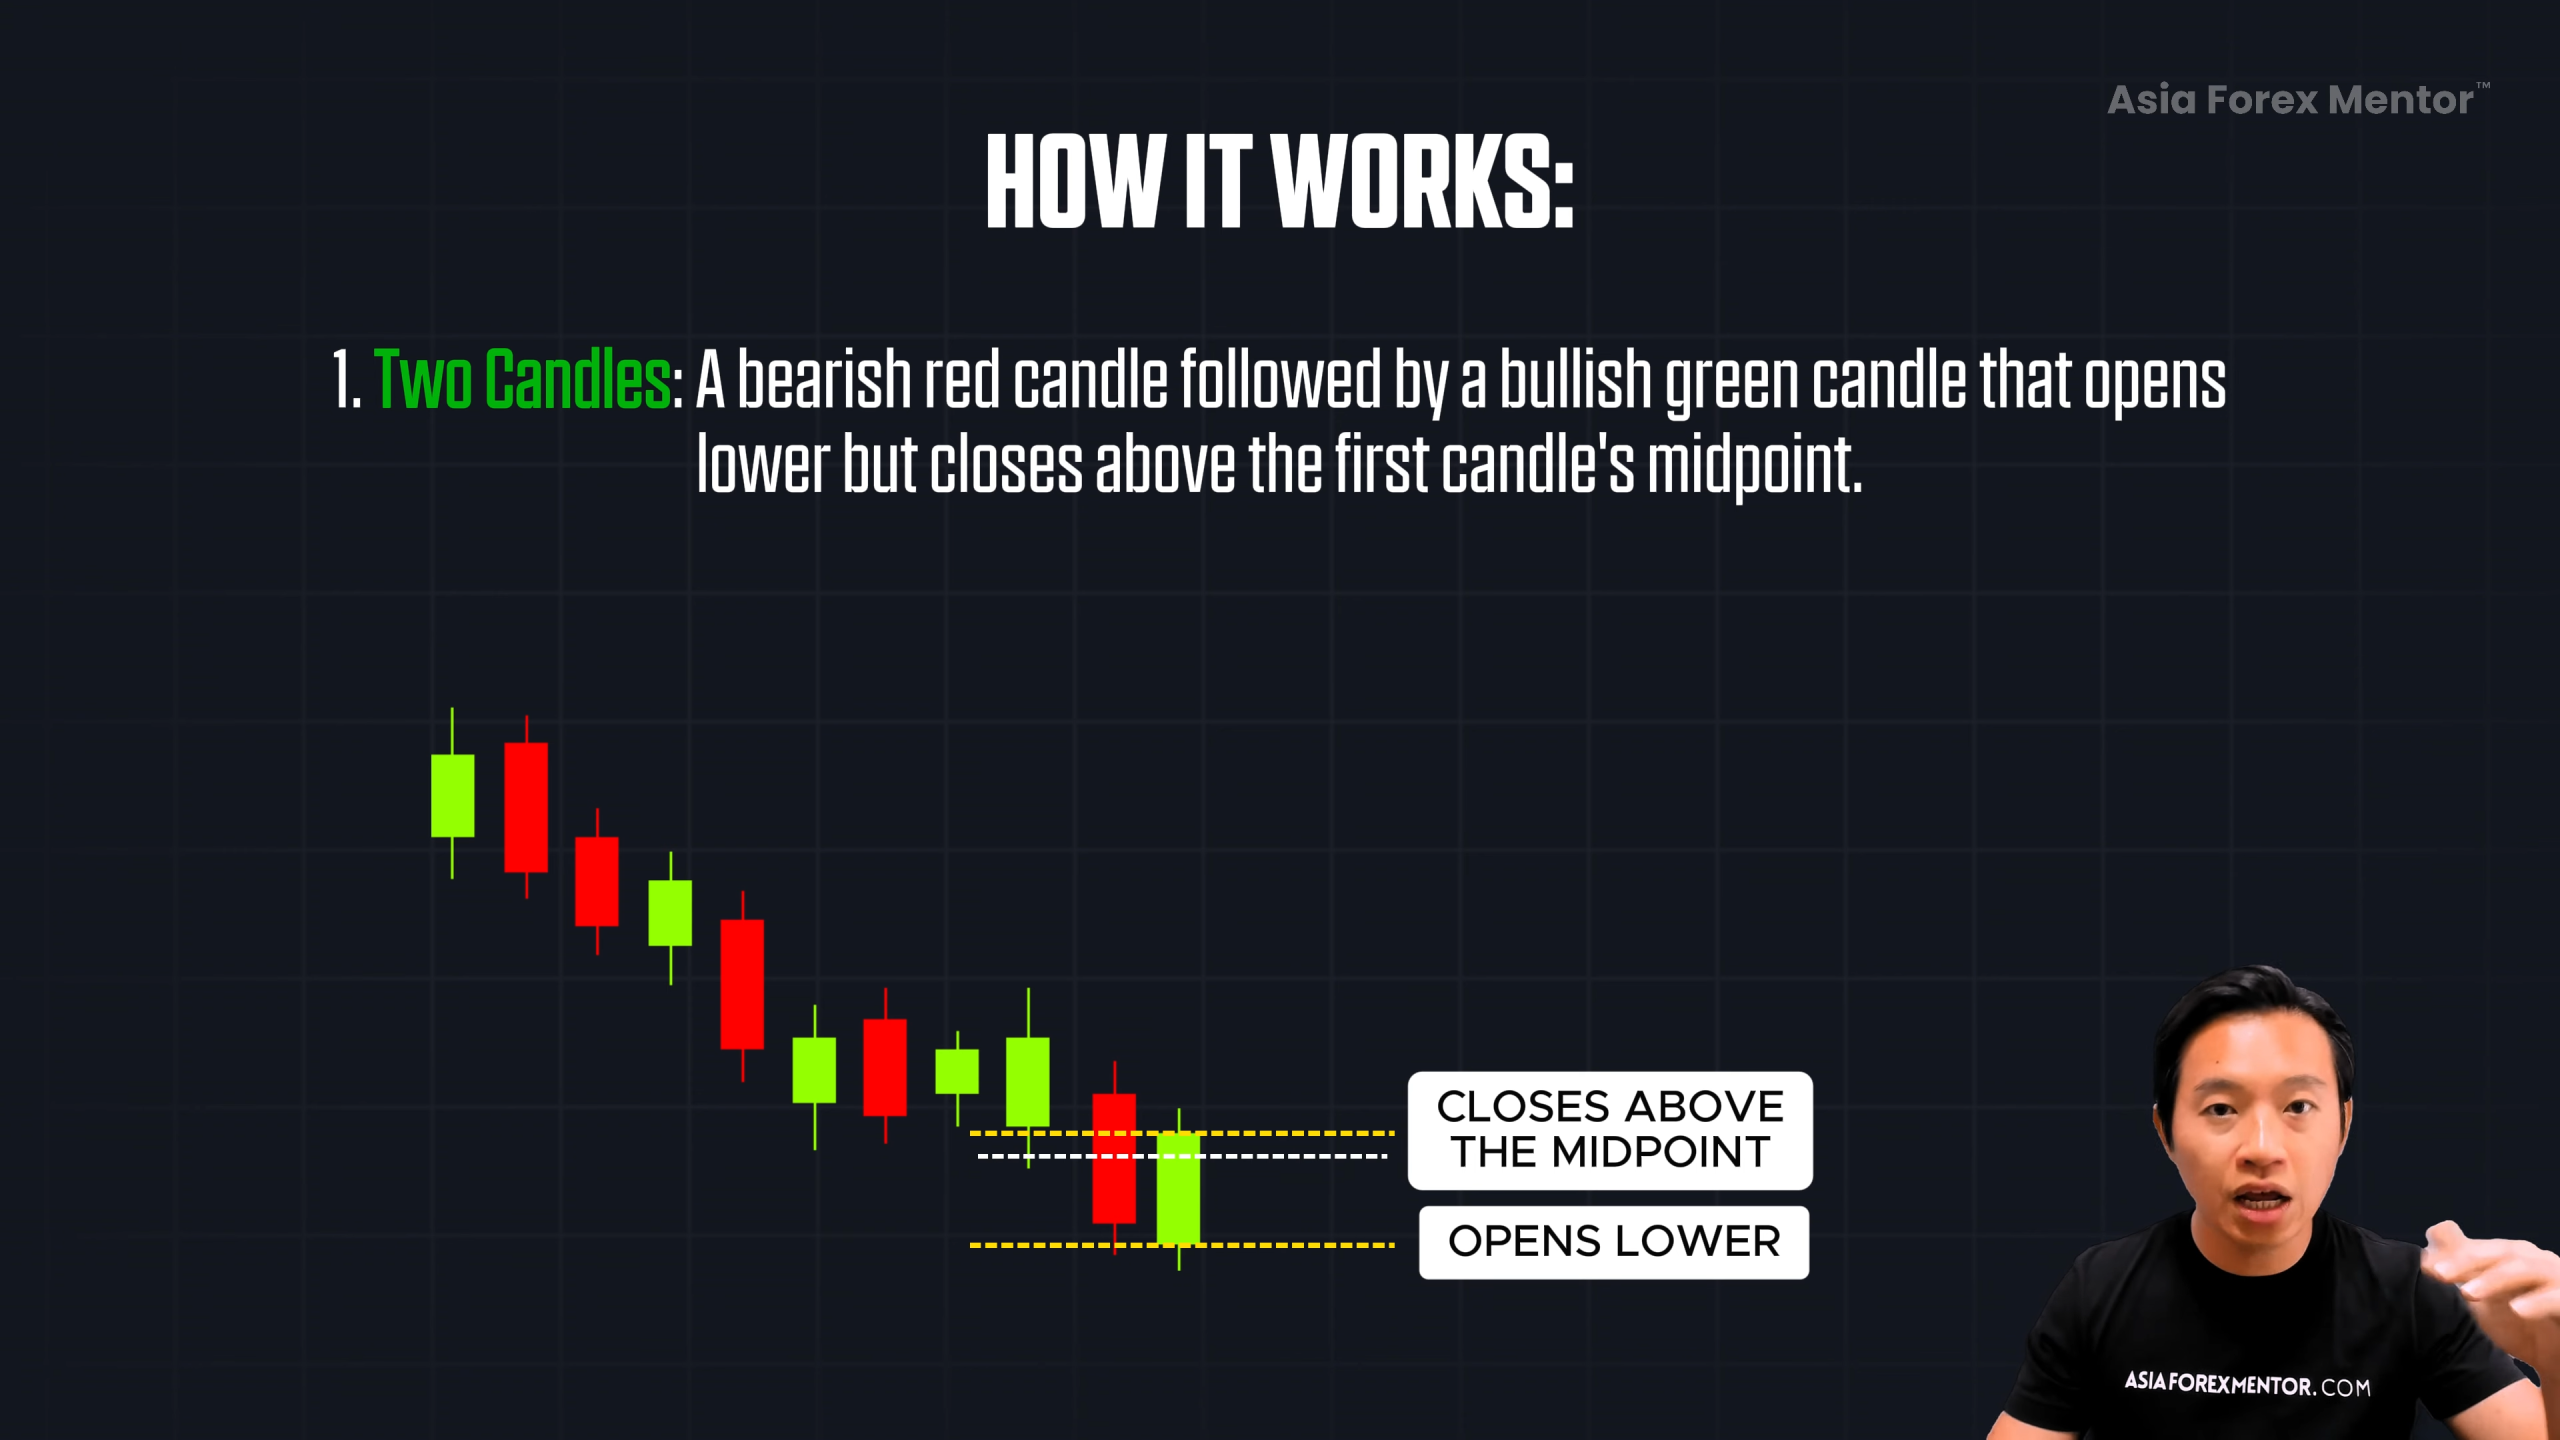
⚙️ Structure and confirmation
Here’s what you’re looking for:
-
🔻 A bearish red candle — solid downward move
-
🔼 A bullish green candle that:
-
Opens below the previous candle’s low
-
Closes above the midpoint of that red candle
-
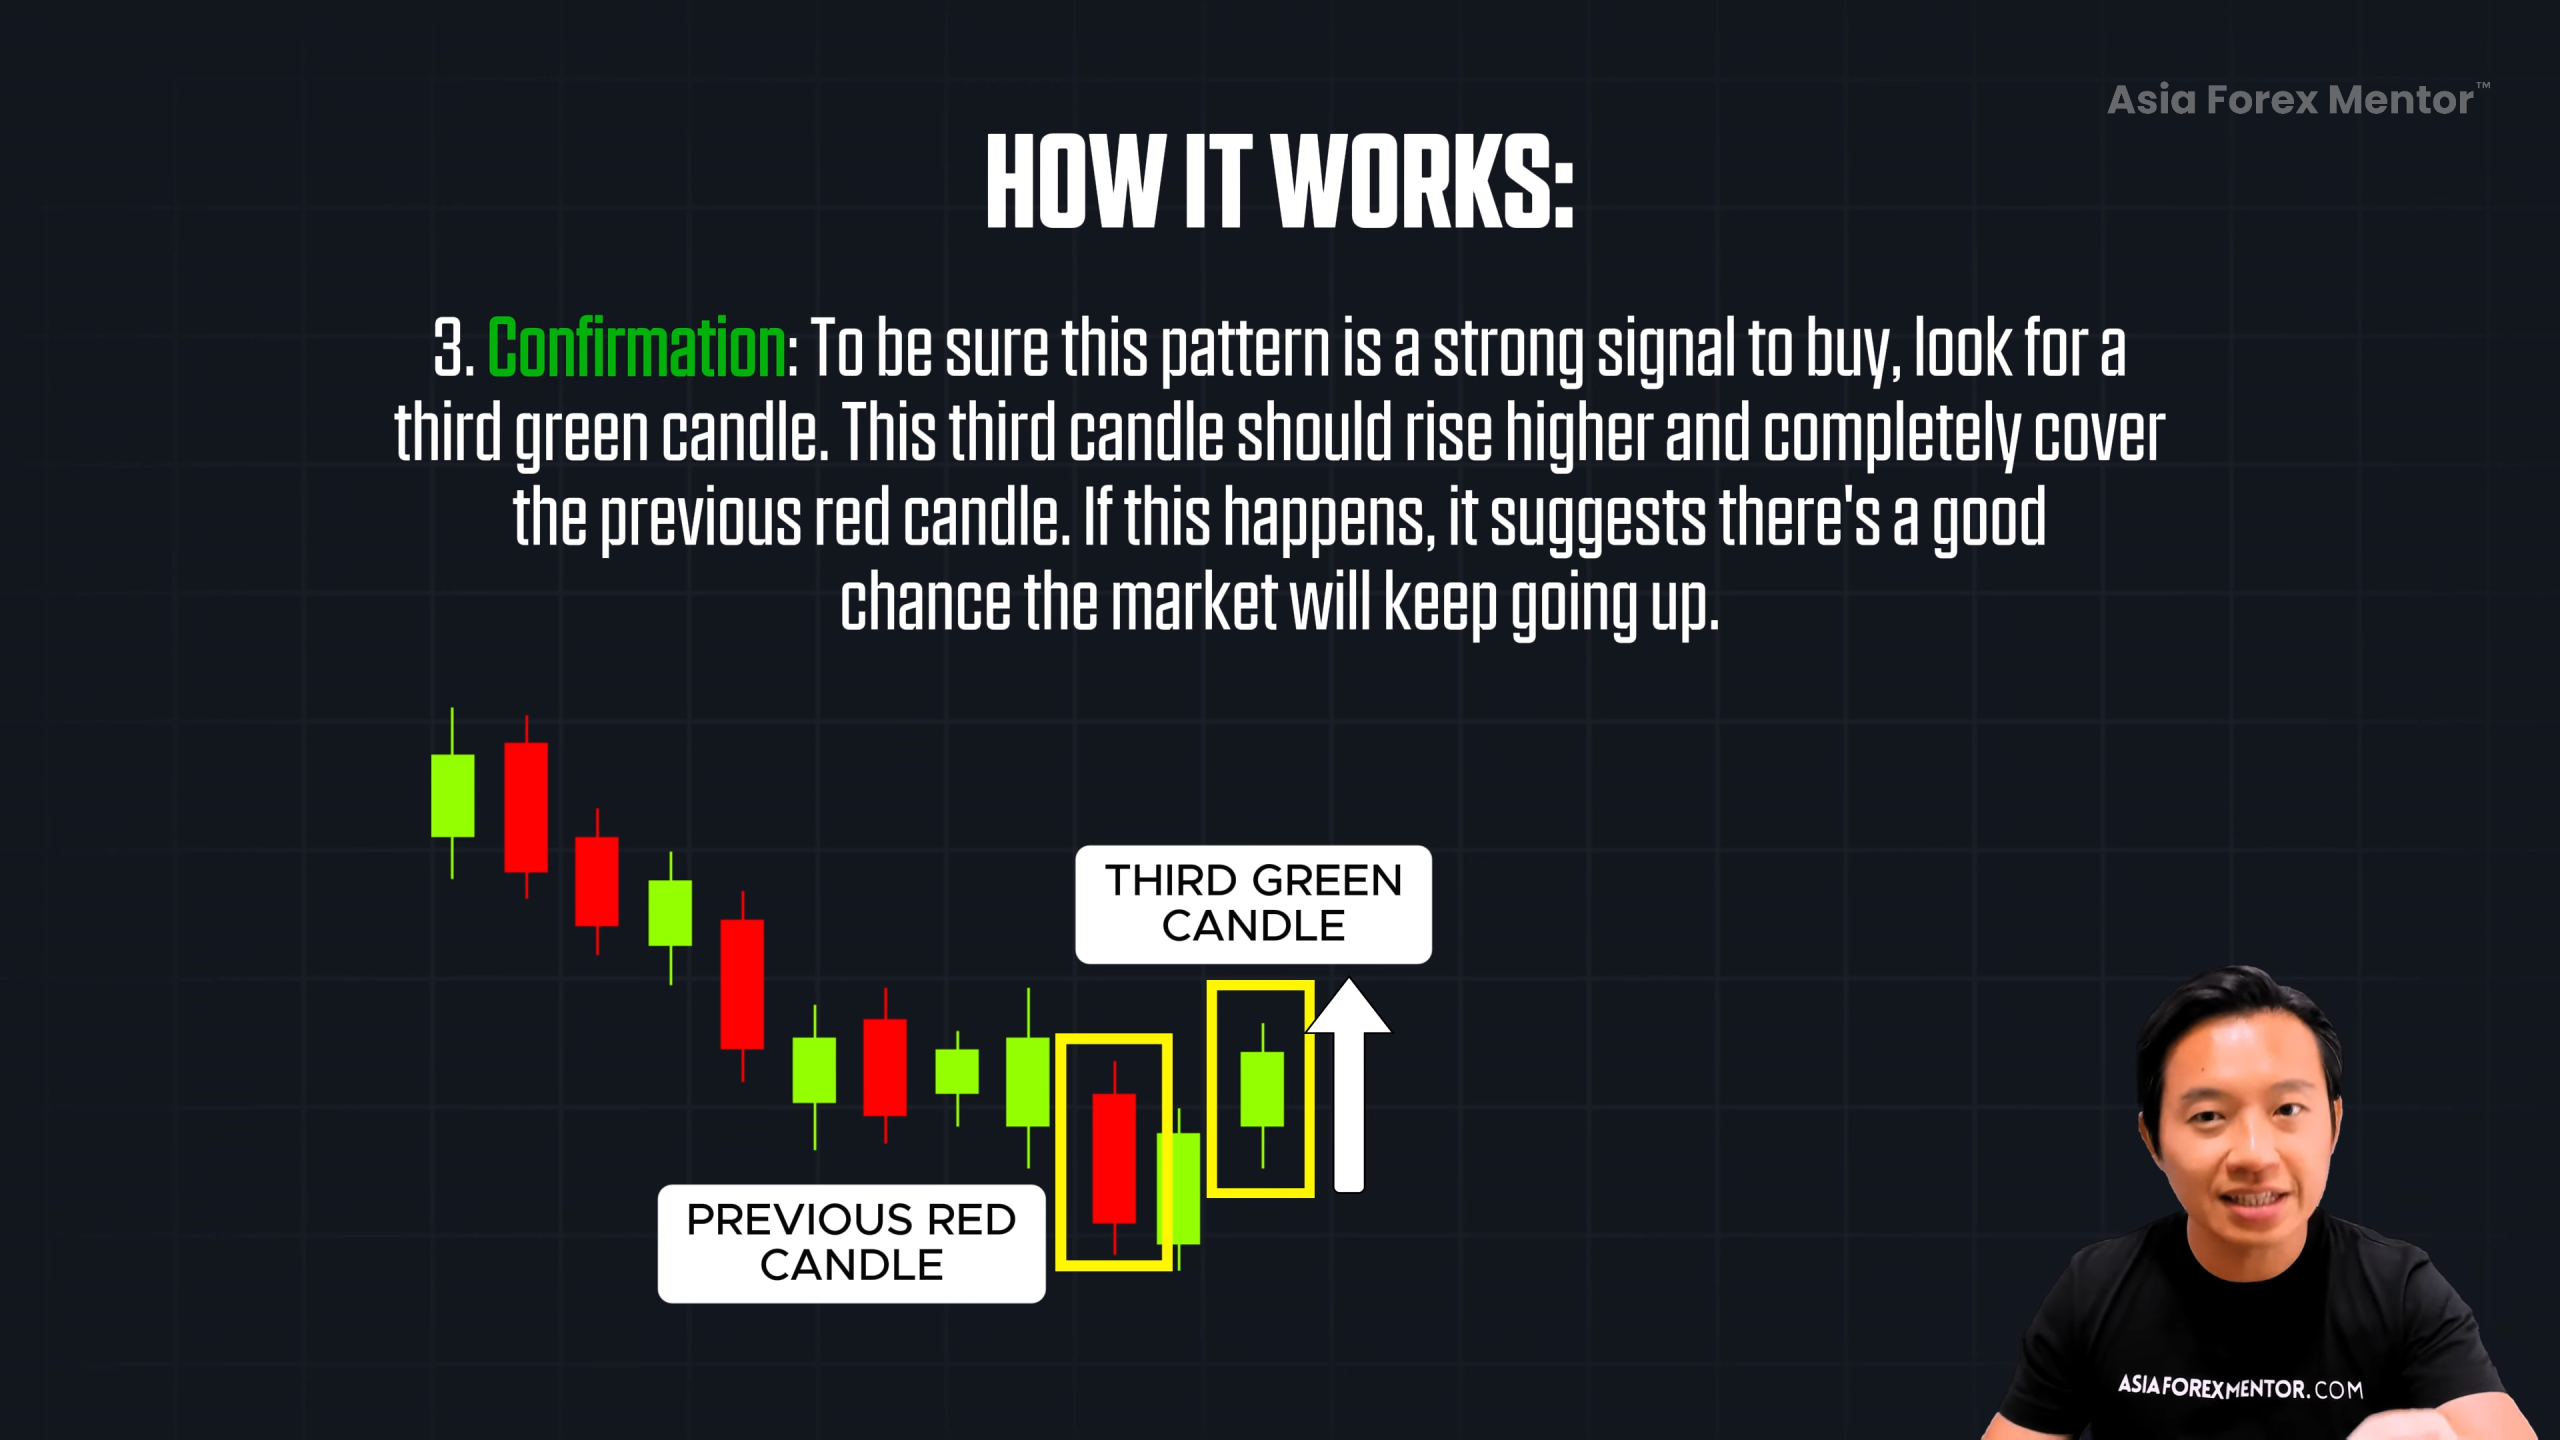
For extra confirmation:
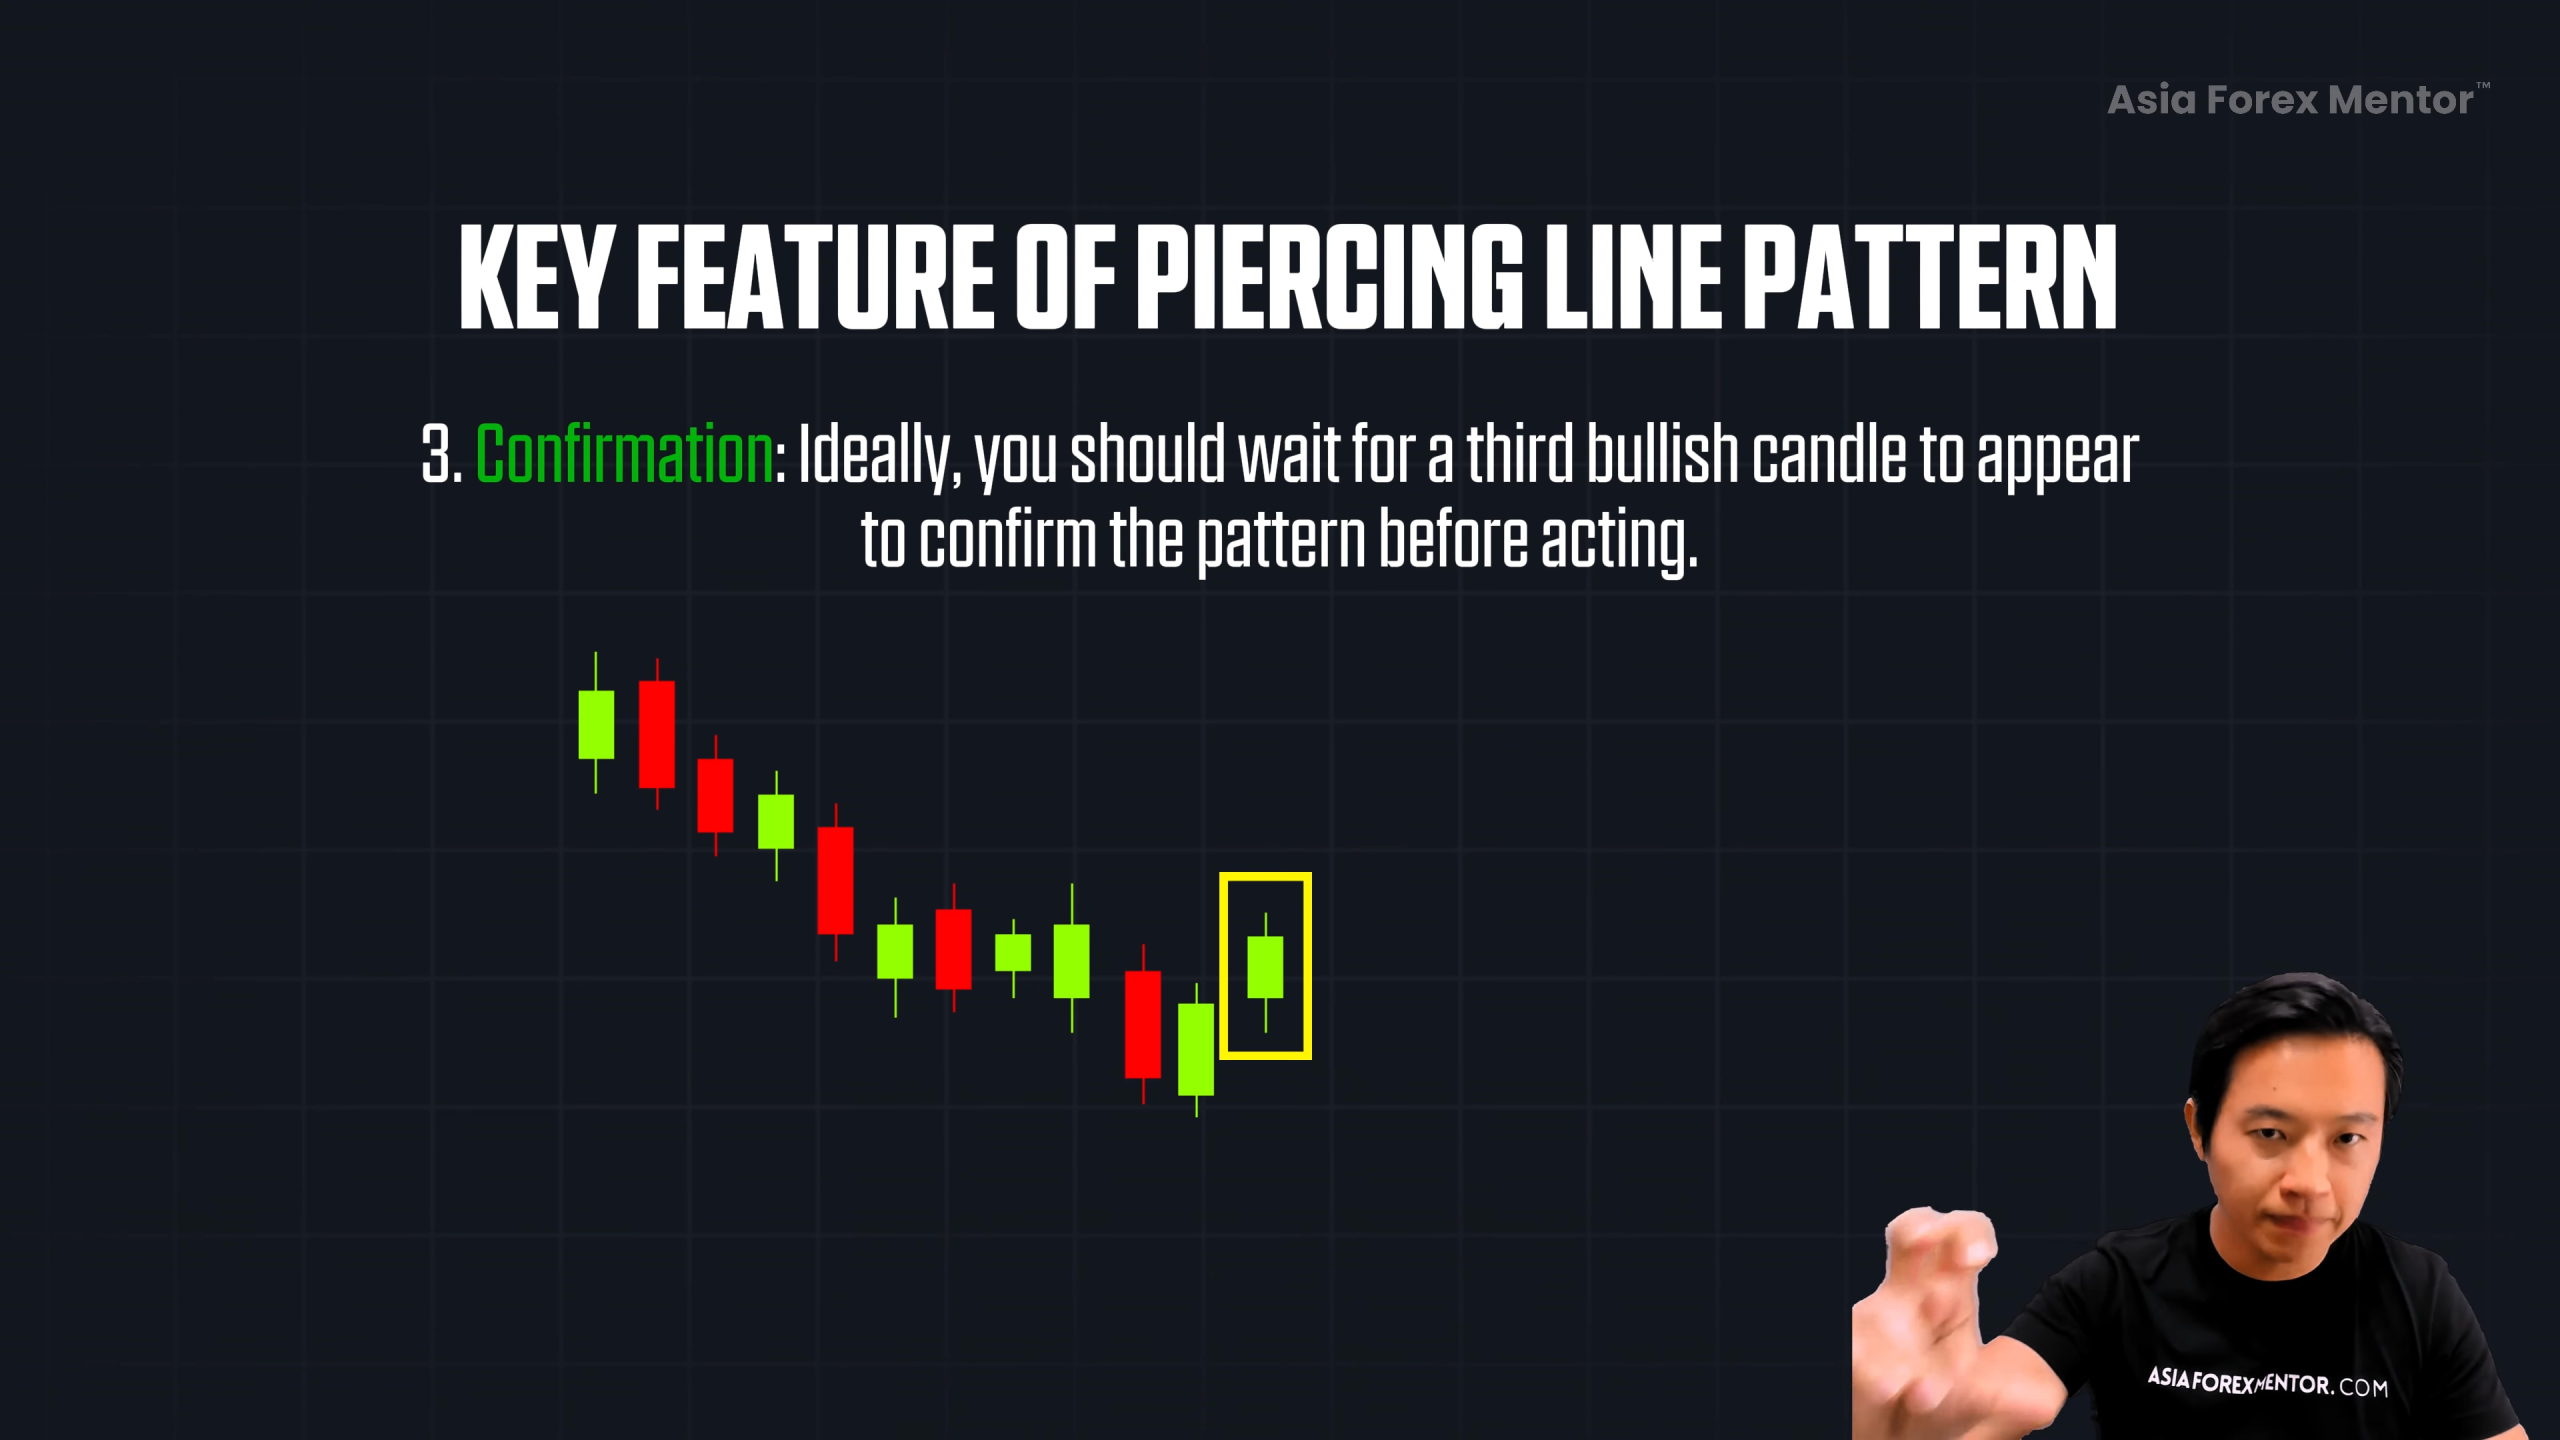
✅ Look for a third green candle that rises higher and completely engulfs the red candle
💡 This third candle strengthens the case for a bullish reversal.
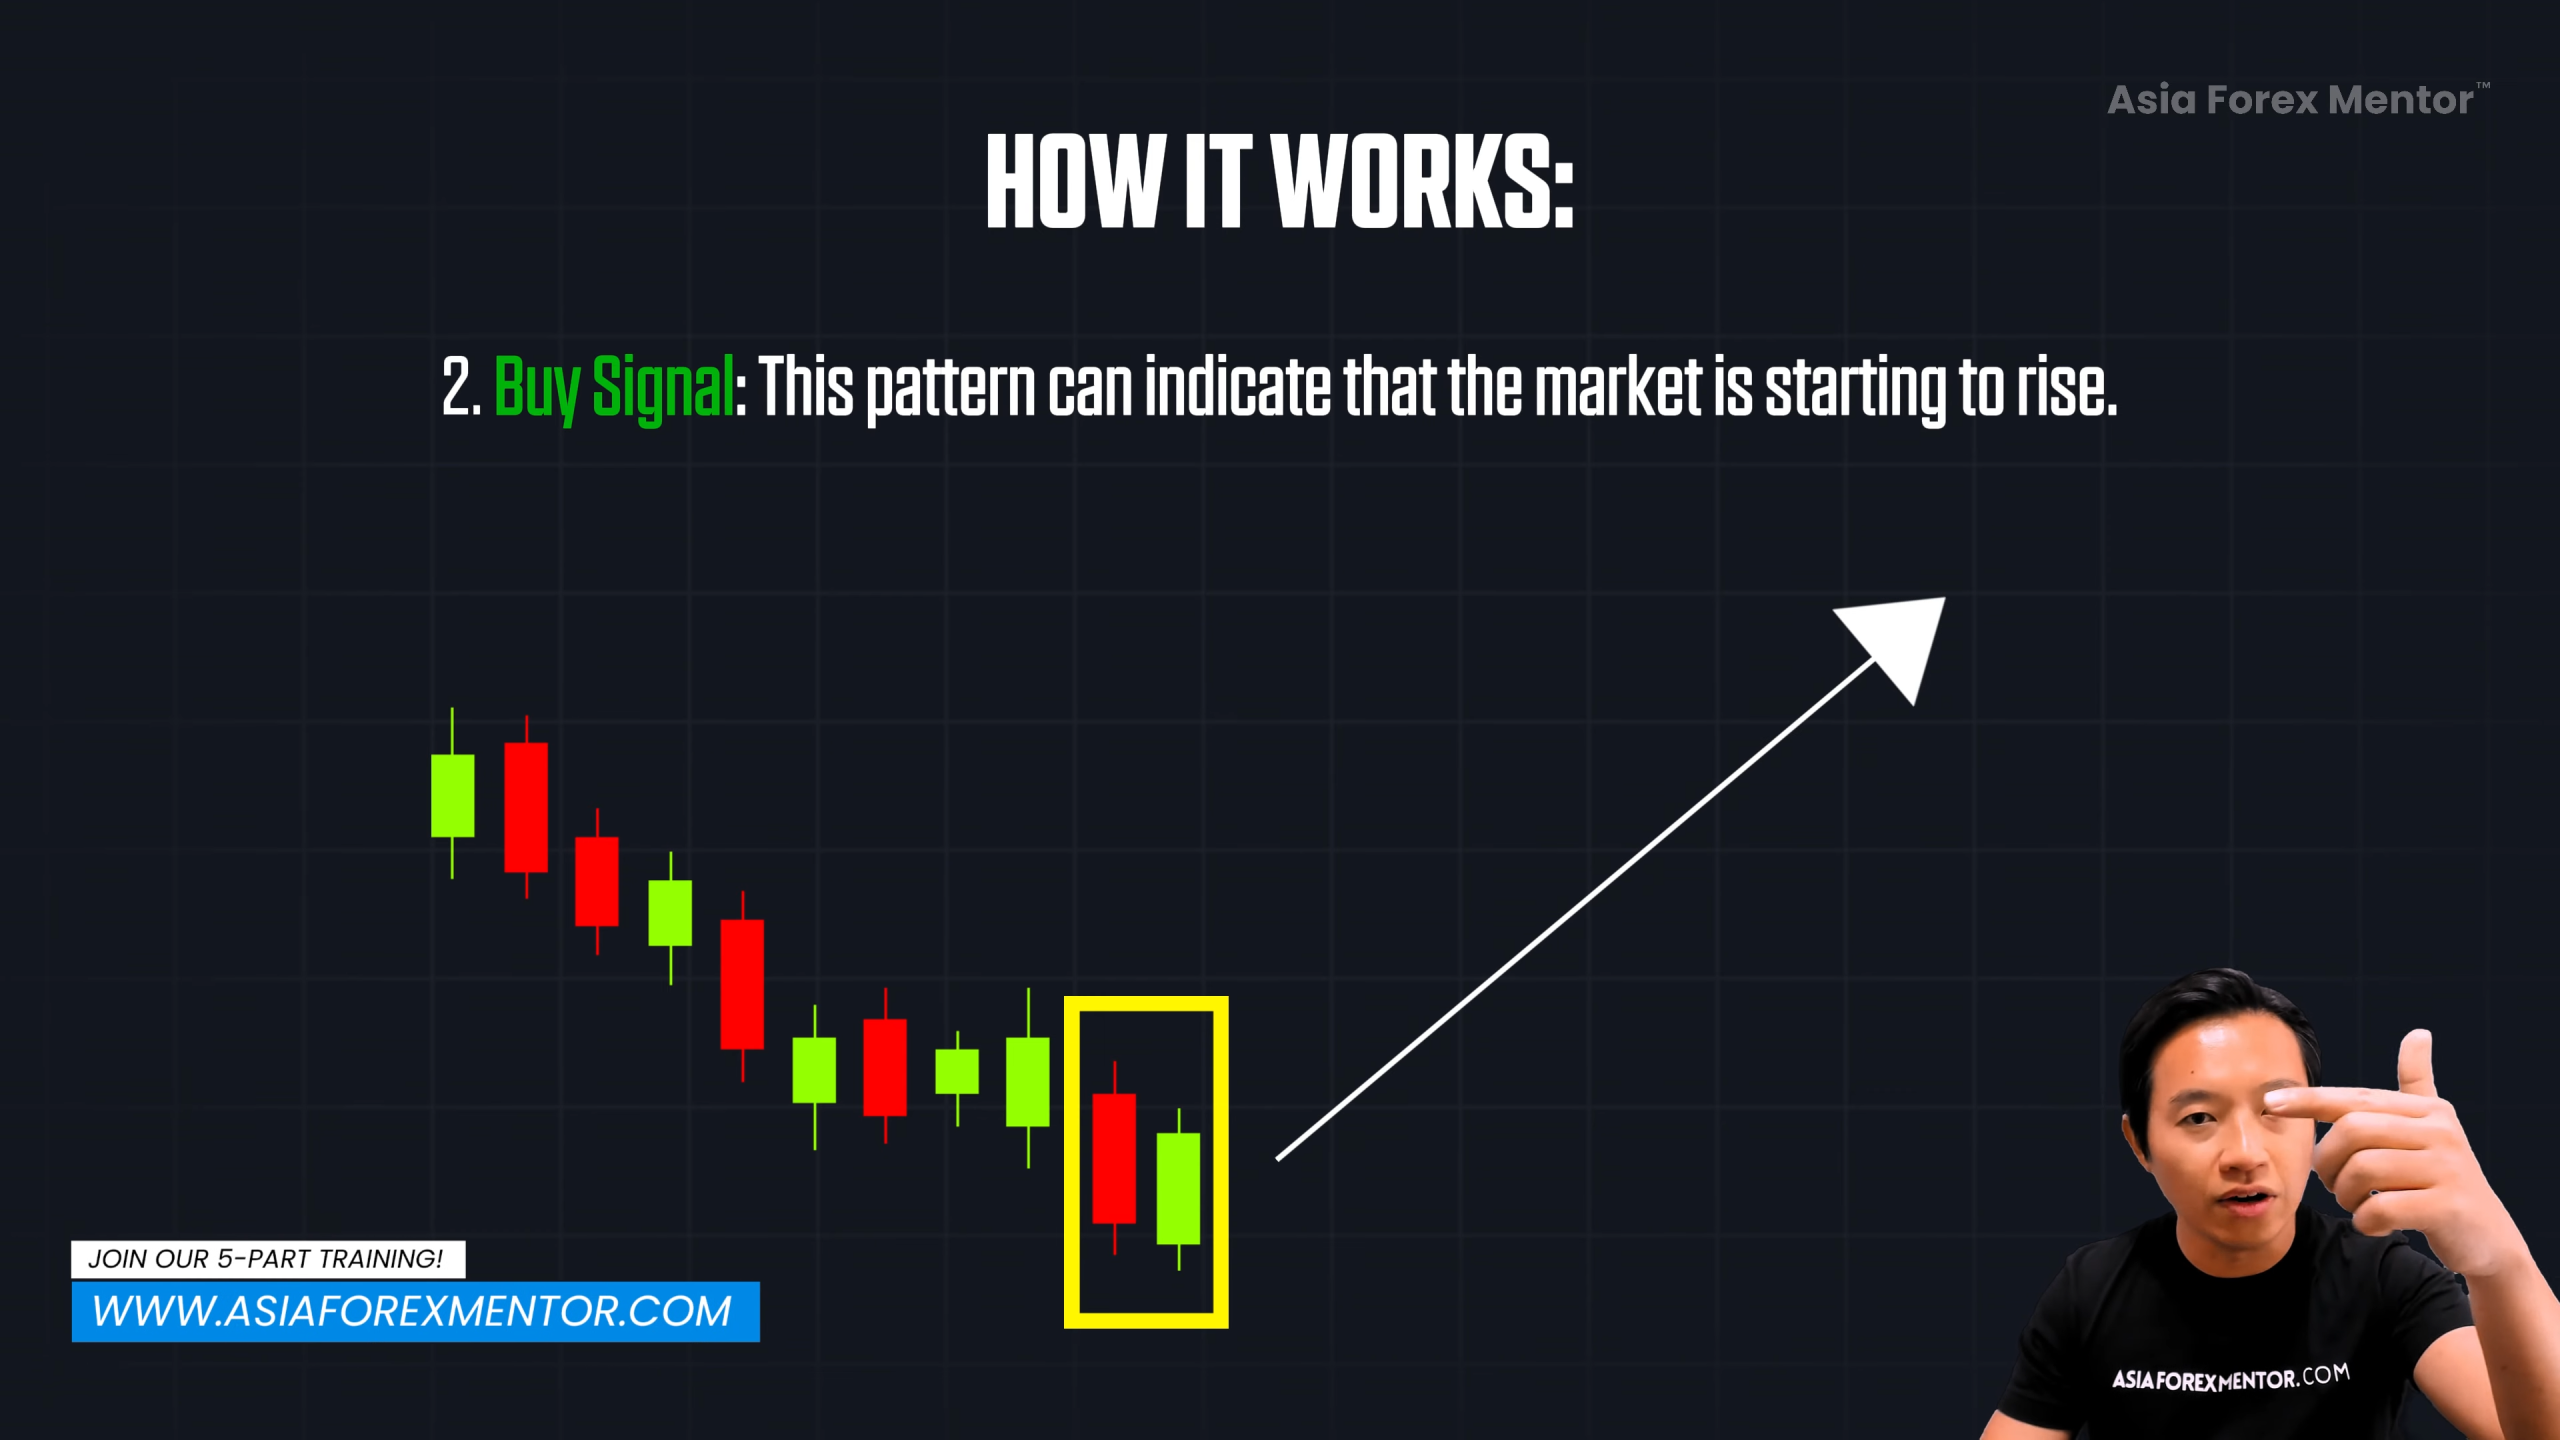
What This Pattern Means in Market Psychology
So what’s really going on behind the candles?
-
First, sellers dominate — they push price lower (red candle)
-
Then, buyers respond — they step in, push price back up, and close strongly above the red candle’s midpoint
That’s the power of this pattern. It tells a story: The market might be reversing from a downtrend to an uptrend.
But remember: it’s a signal, not a guarantee. That’s why we need confirmation and context.
Who Should Use It — and When
If you’re new to trading — or just looking for a clear pattern to spot buying opportunities — this is a great one to learn.
Here’s the key though:
⚠️ Don’t use it in a sideways market.
You want to spot the Piercing Line Pattern after a clear price drop. That’s when it becomes a potential reversal signal.
How to Recognize the Pattern in Real Time
Here’s how you spot it on your chart:
-
🔻 A big red candle — strong selling
-
🔼 A green candle that:
-
Opens below the red candle’s low
-
Closes above its midpoint
-
Even better?
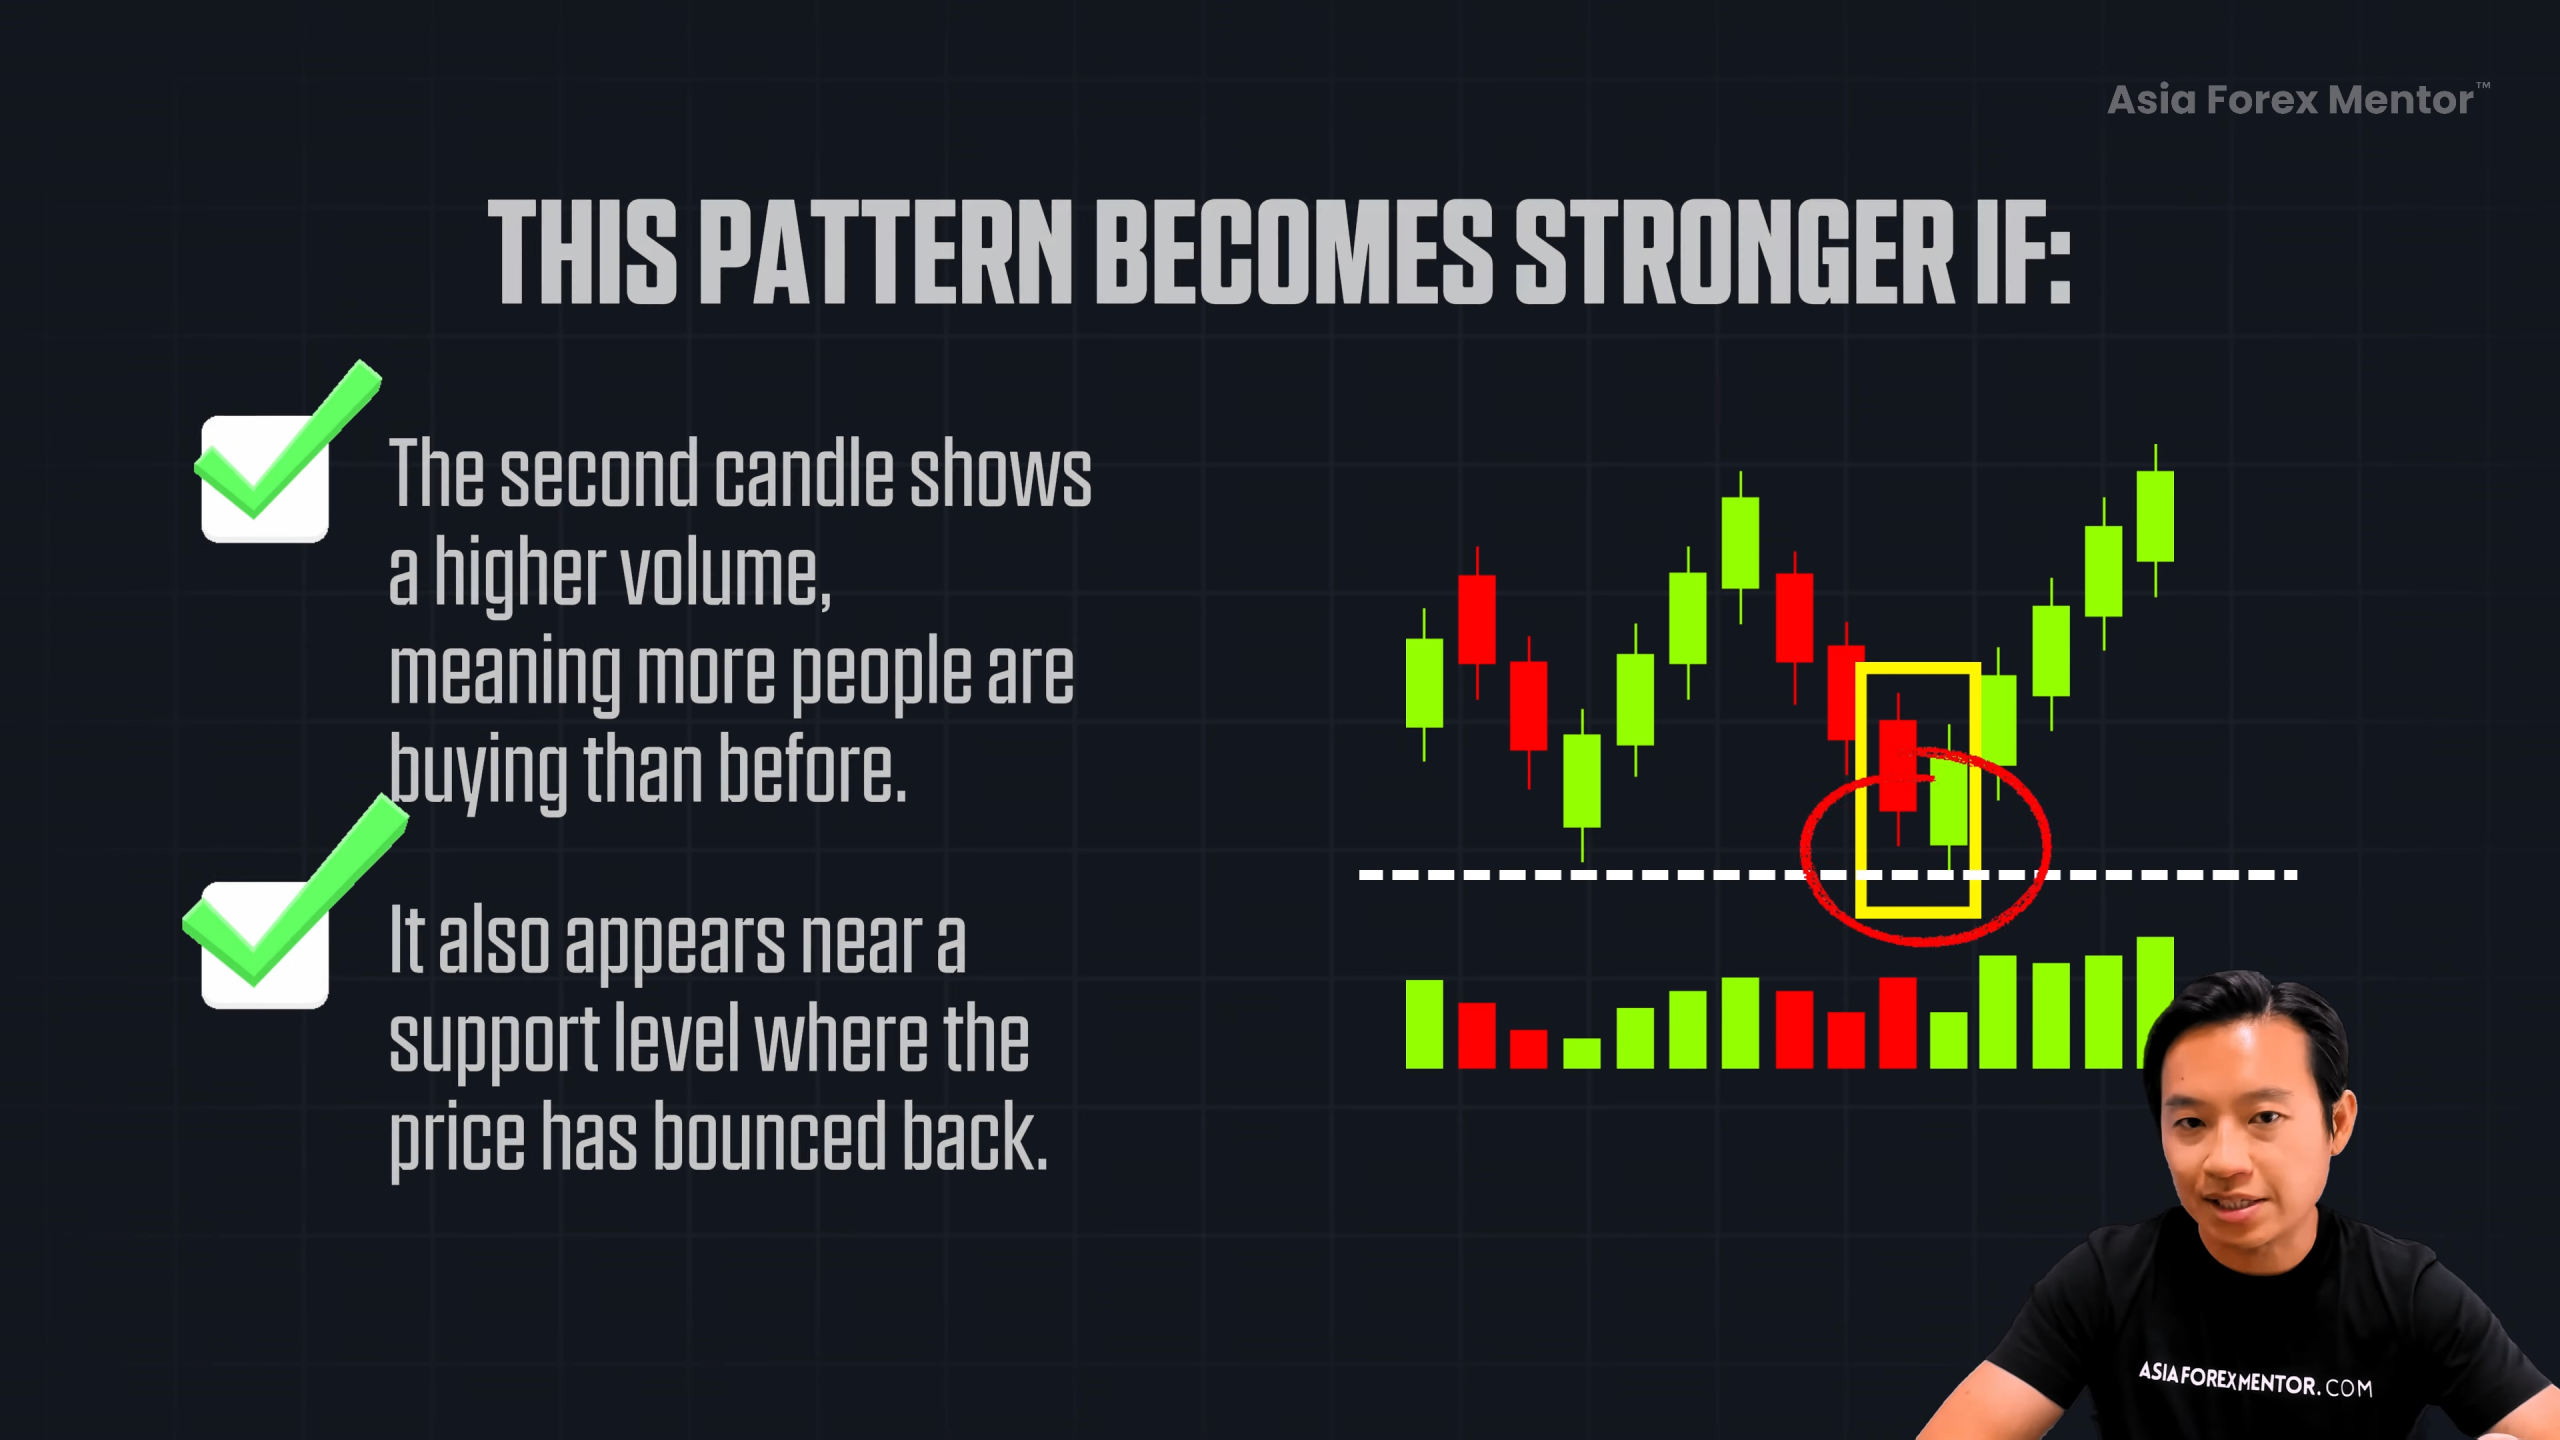
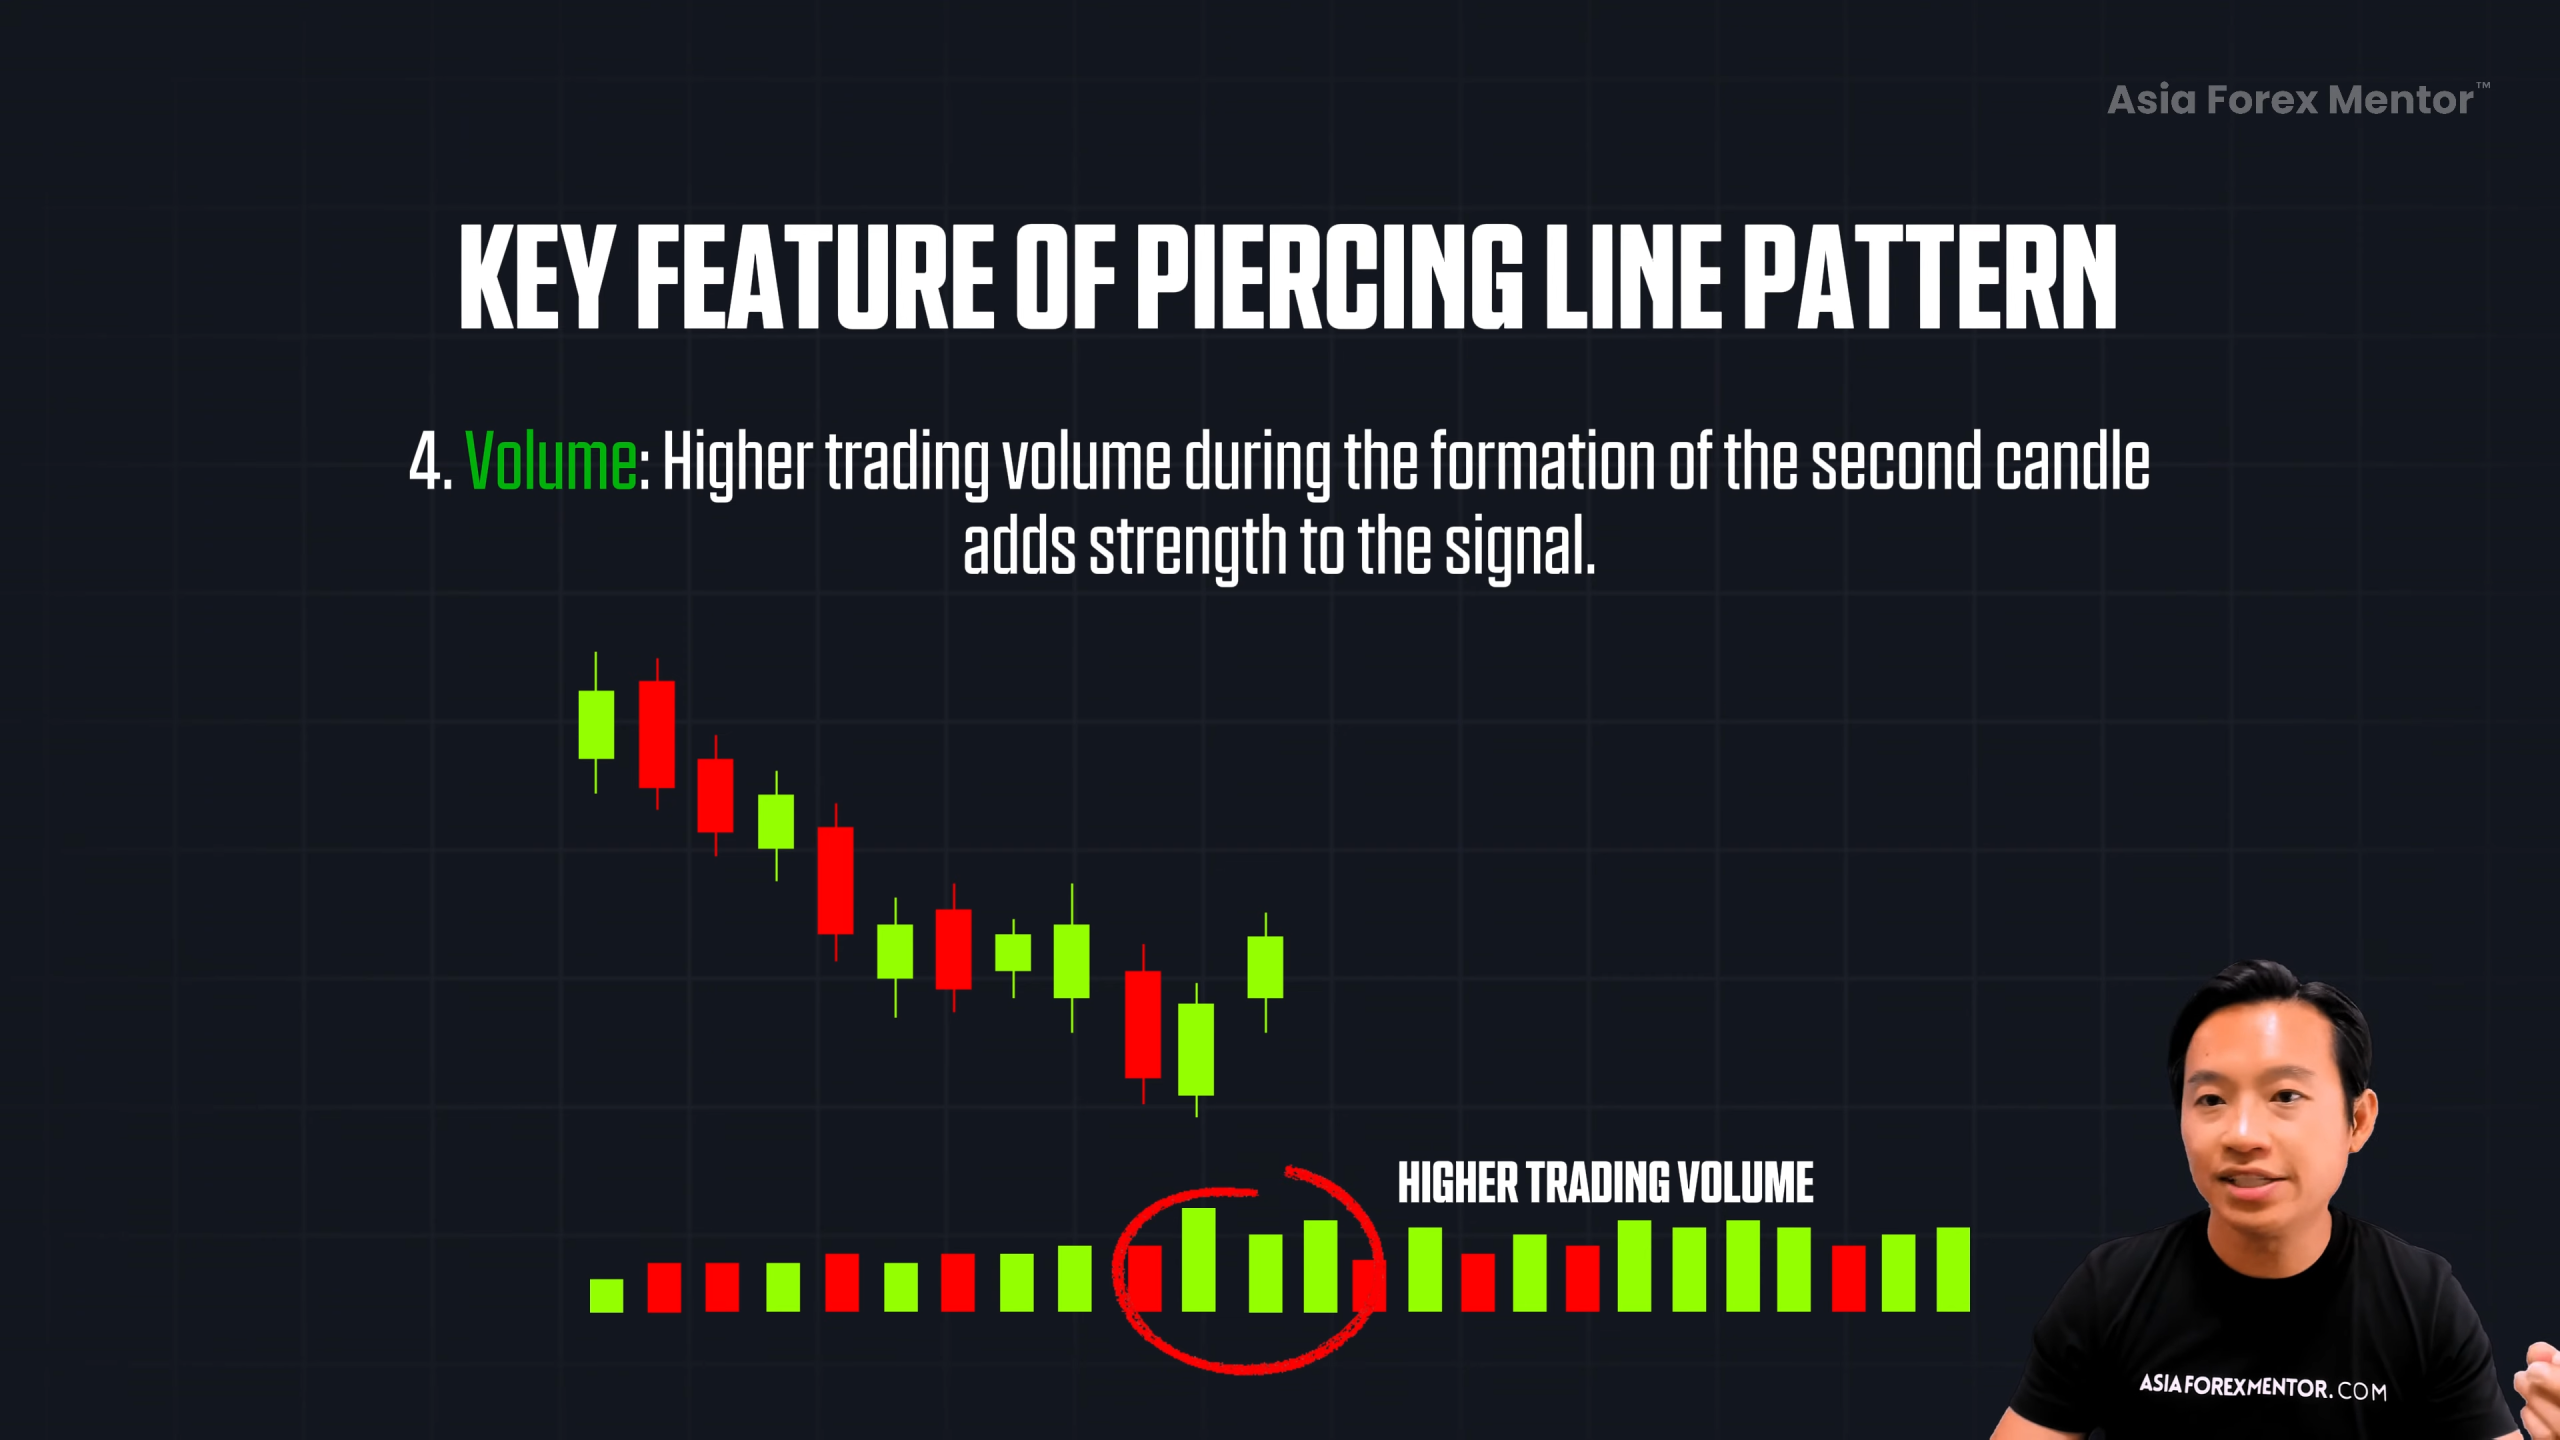
📈 If the green candle forms with higher volume, it shows serious buying interest.
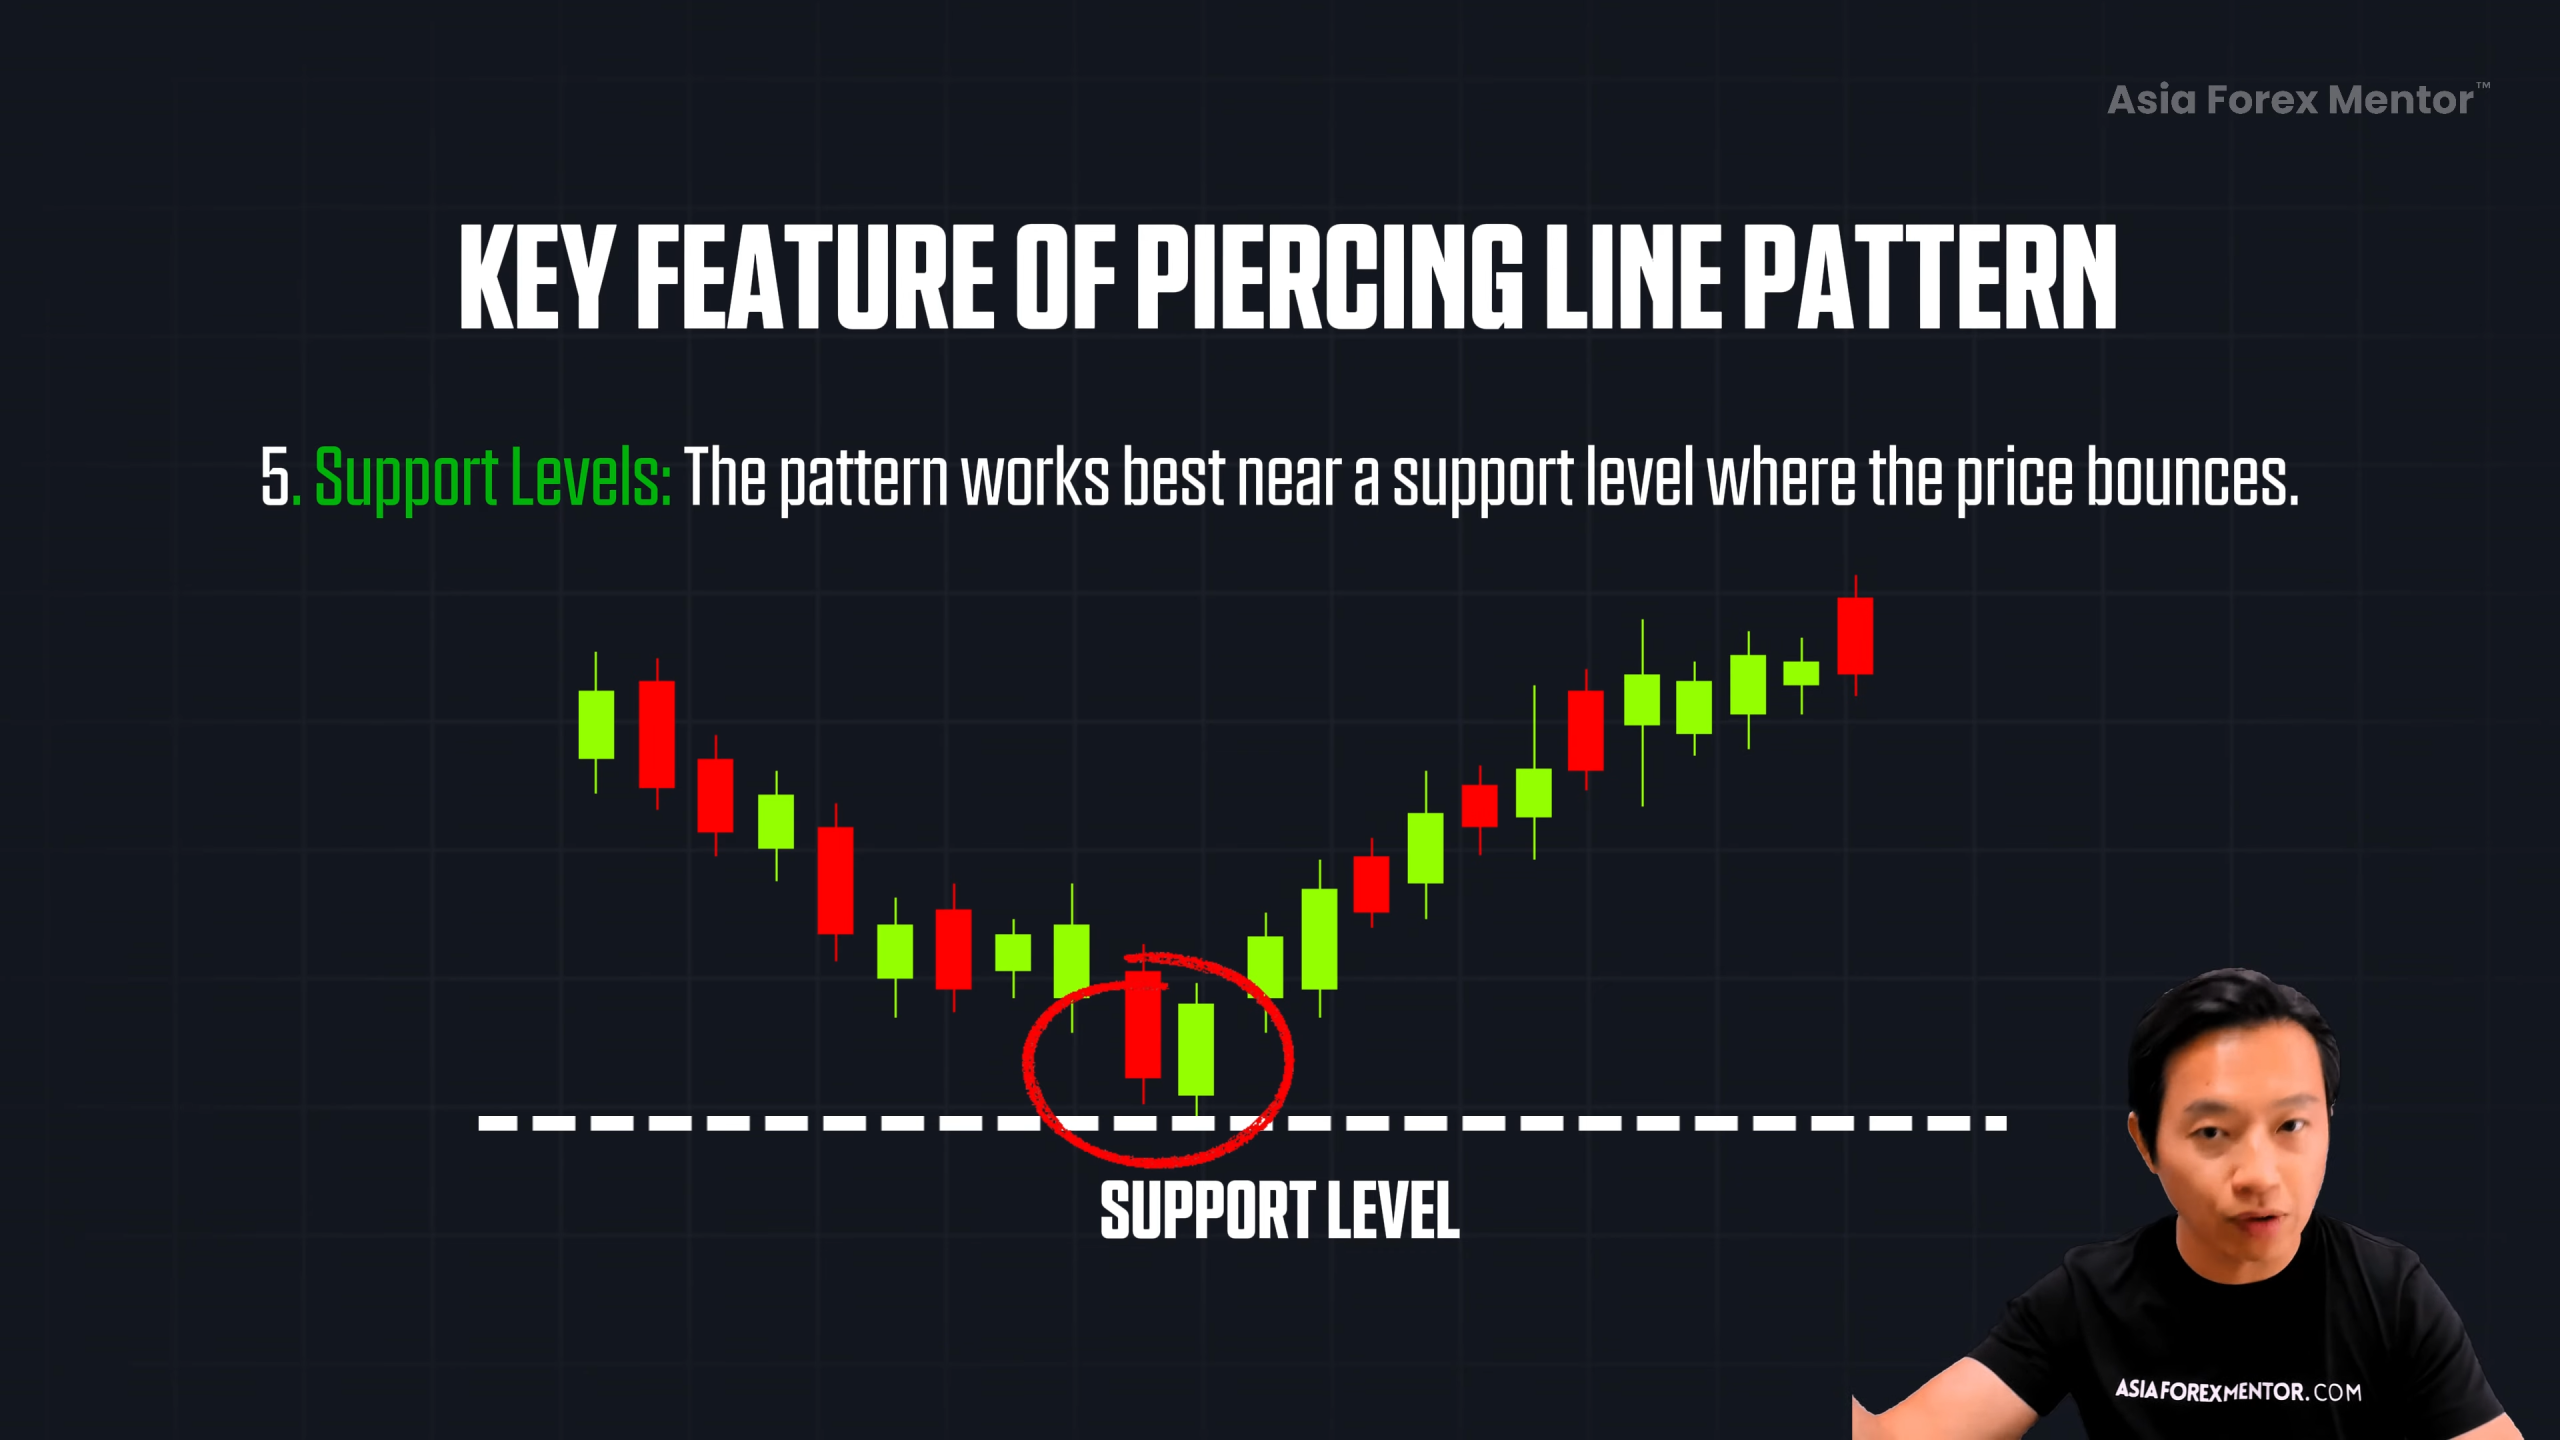
And if this happens at a support level — boom, now you’ve got a high-probability reversal.
What Strengthens the Signal?
Here are the 3 must-have confirmations that boost the pattern’s accuracy:
✅ 1. Volume
-
If the second (green) candle forms with more volume than the first, that’s bullish strength.
-
It means buyers are stepping in aggressively.
✅ 2. Support
-
The pattern works best at a support level, such as:
-
Horizontal zones
-
Moving averages
-
Trendlines
-
Bollinger Bands
-
📍 If price bounced from here before, it might do it again.
✅ 3. Market Conditions
-
Always check the higher time frame trend.
-
Example: You see the Piercing Line on the 1H chart.
-
But the daily trend is bullish.
-
This could be a retracement ending, and the uptrend is ready to resume.
-
Now you’re trading with the trend, not against it. 🔥
Key Features of the Piercing Line Pattern
Here’s a summary of the essential rules:
-
🔴 First candle: Bearish
-
🟢 Second candle: Bullish, must close above the midpoint of the red candle
-
✅ Look for a third bullish candle for confirmation
-
🔊 Higher volume = stronger signal
-
📍 Pattern works best at support
🧠 Closing price matters more than wicks. That’s where the real battle ends.
How to Trade the Piercing Line Pattern
Here’s how to enter, set stops, and manage the trade:
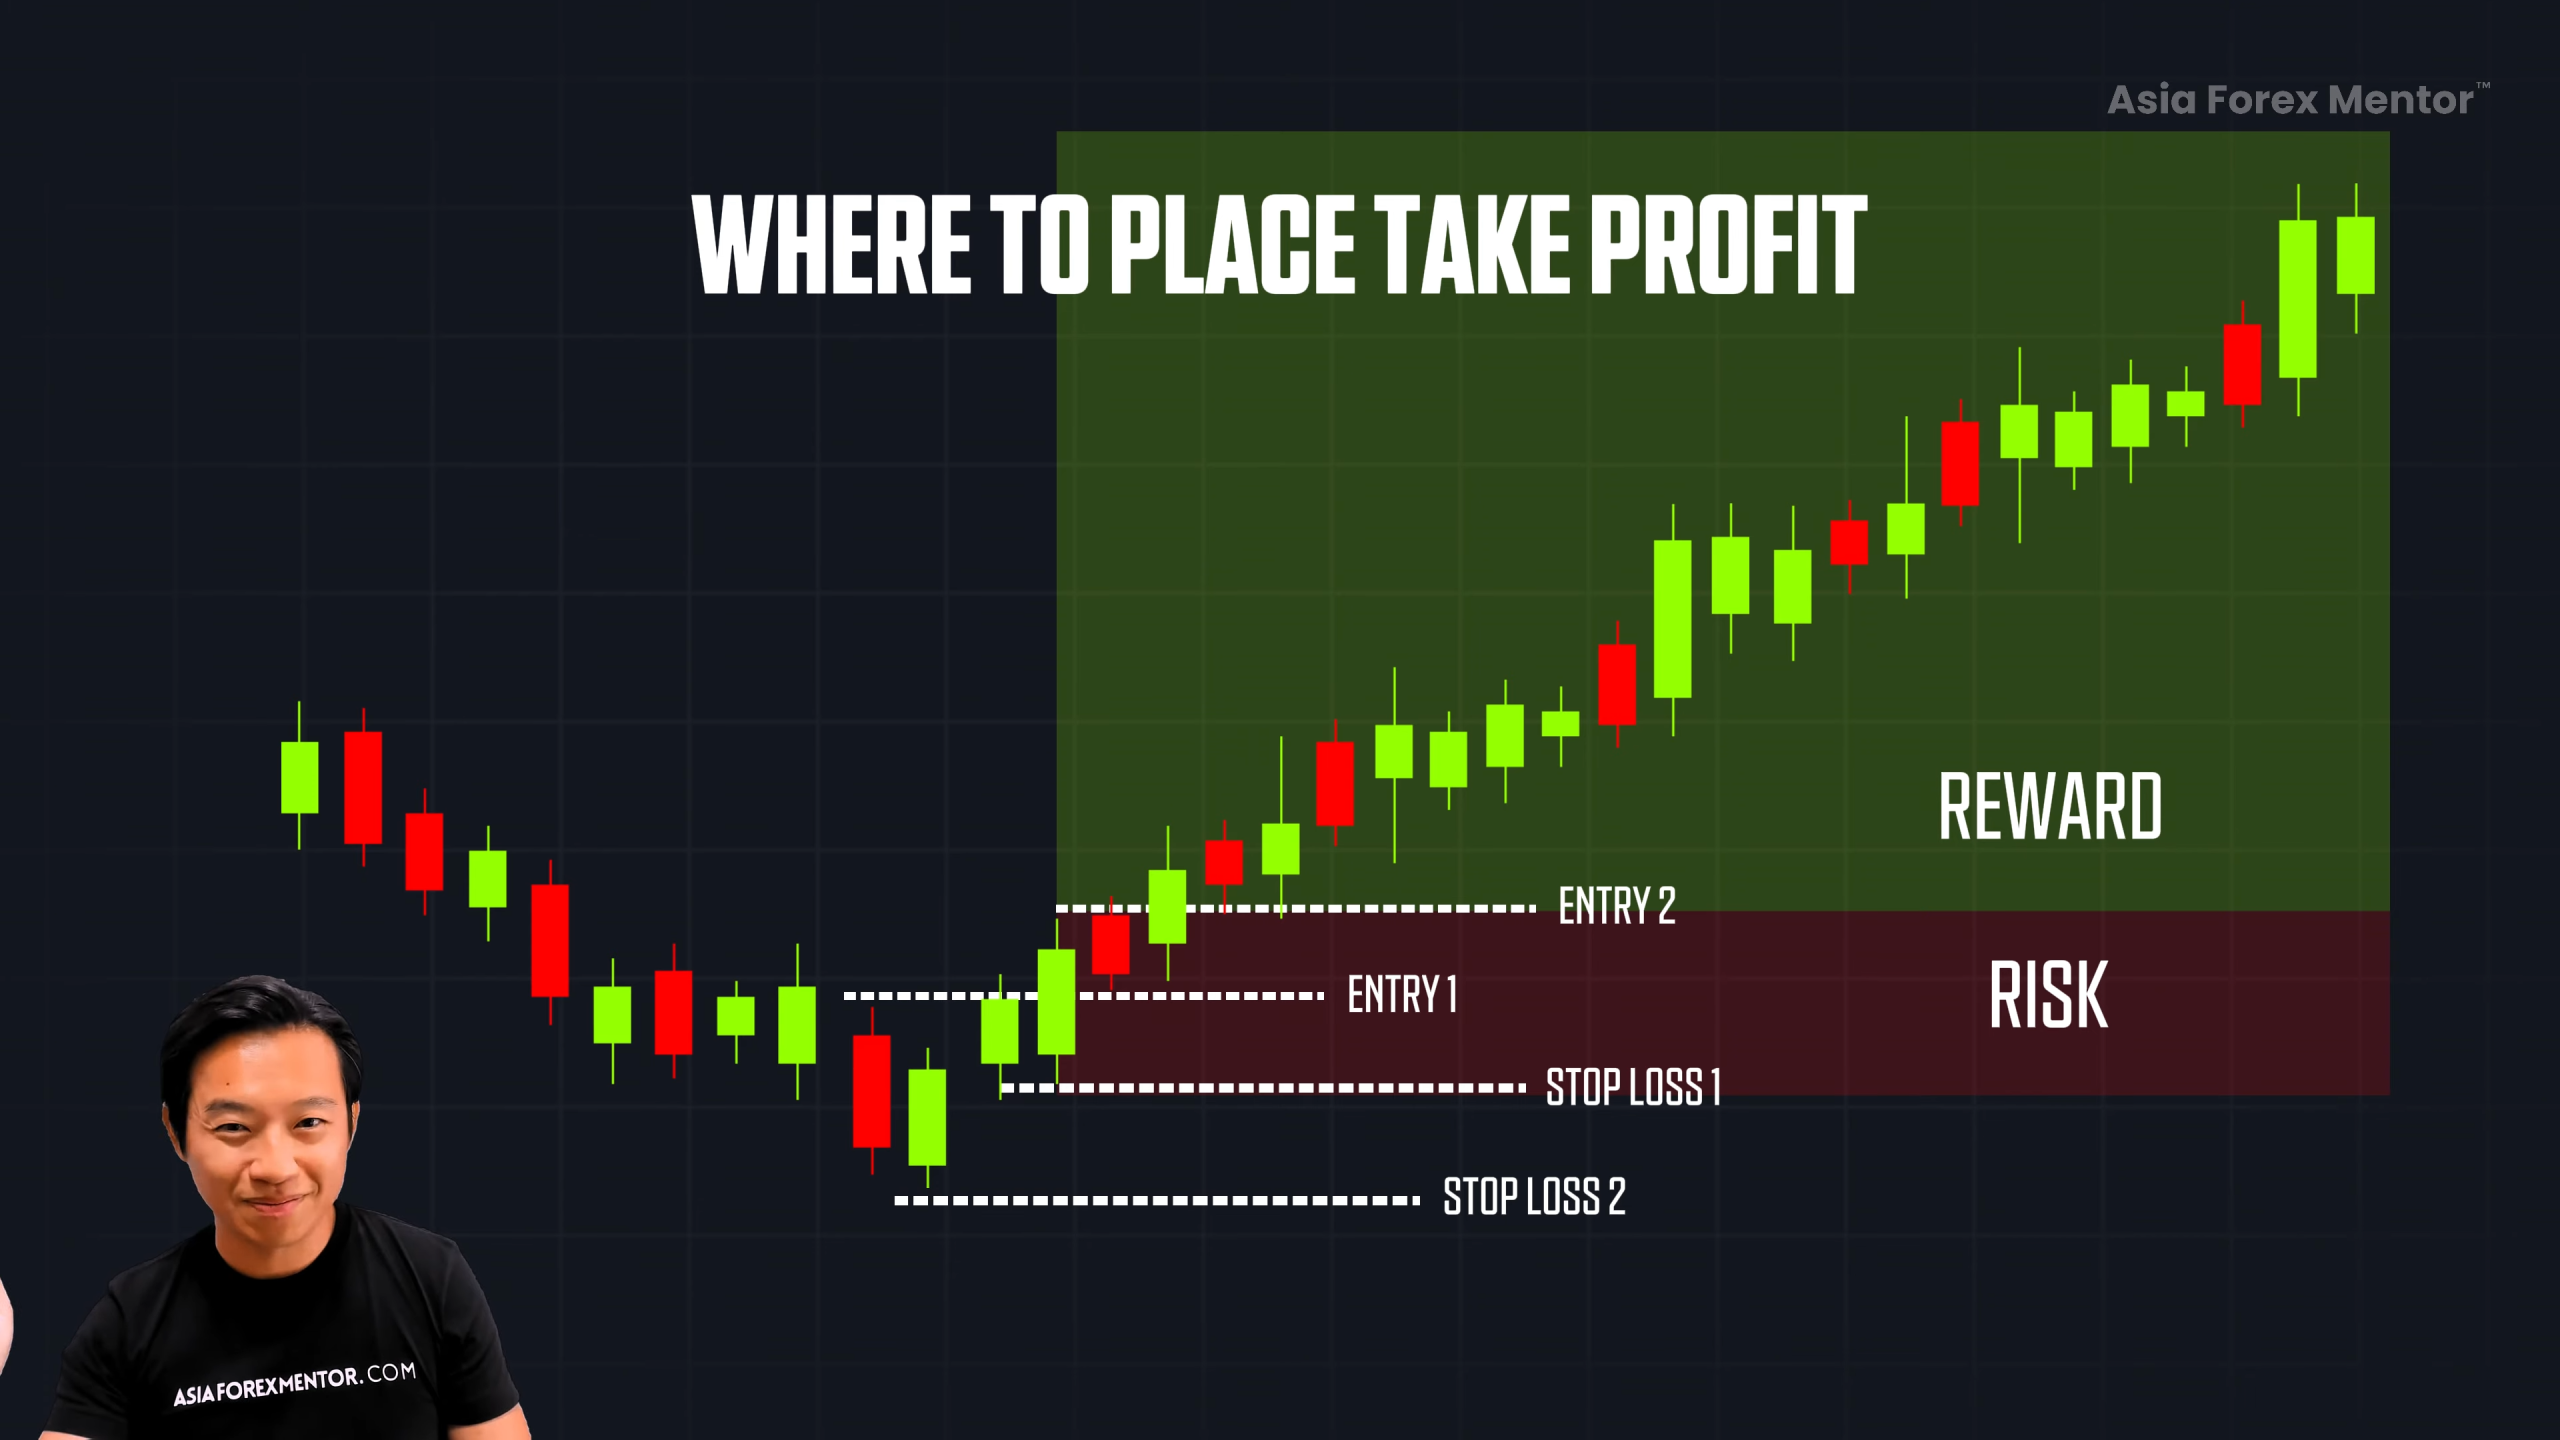
🟩 Entry Options:
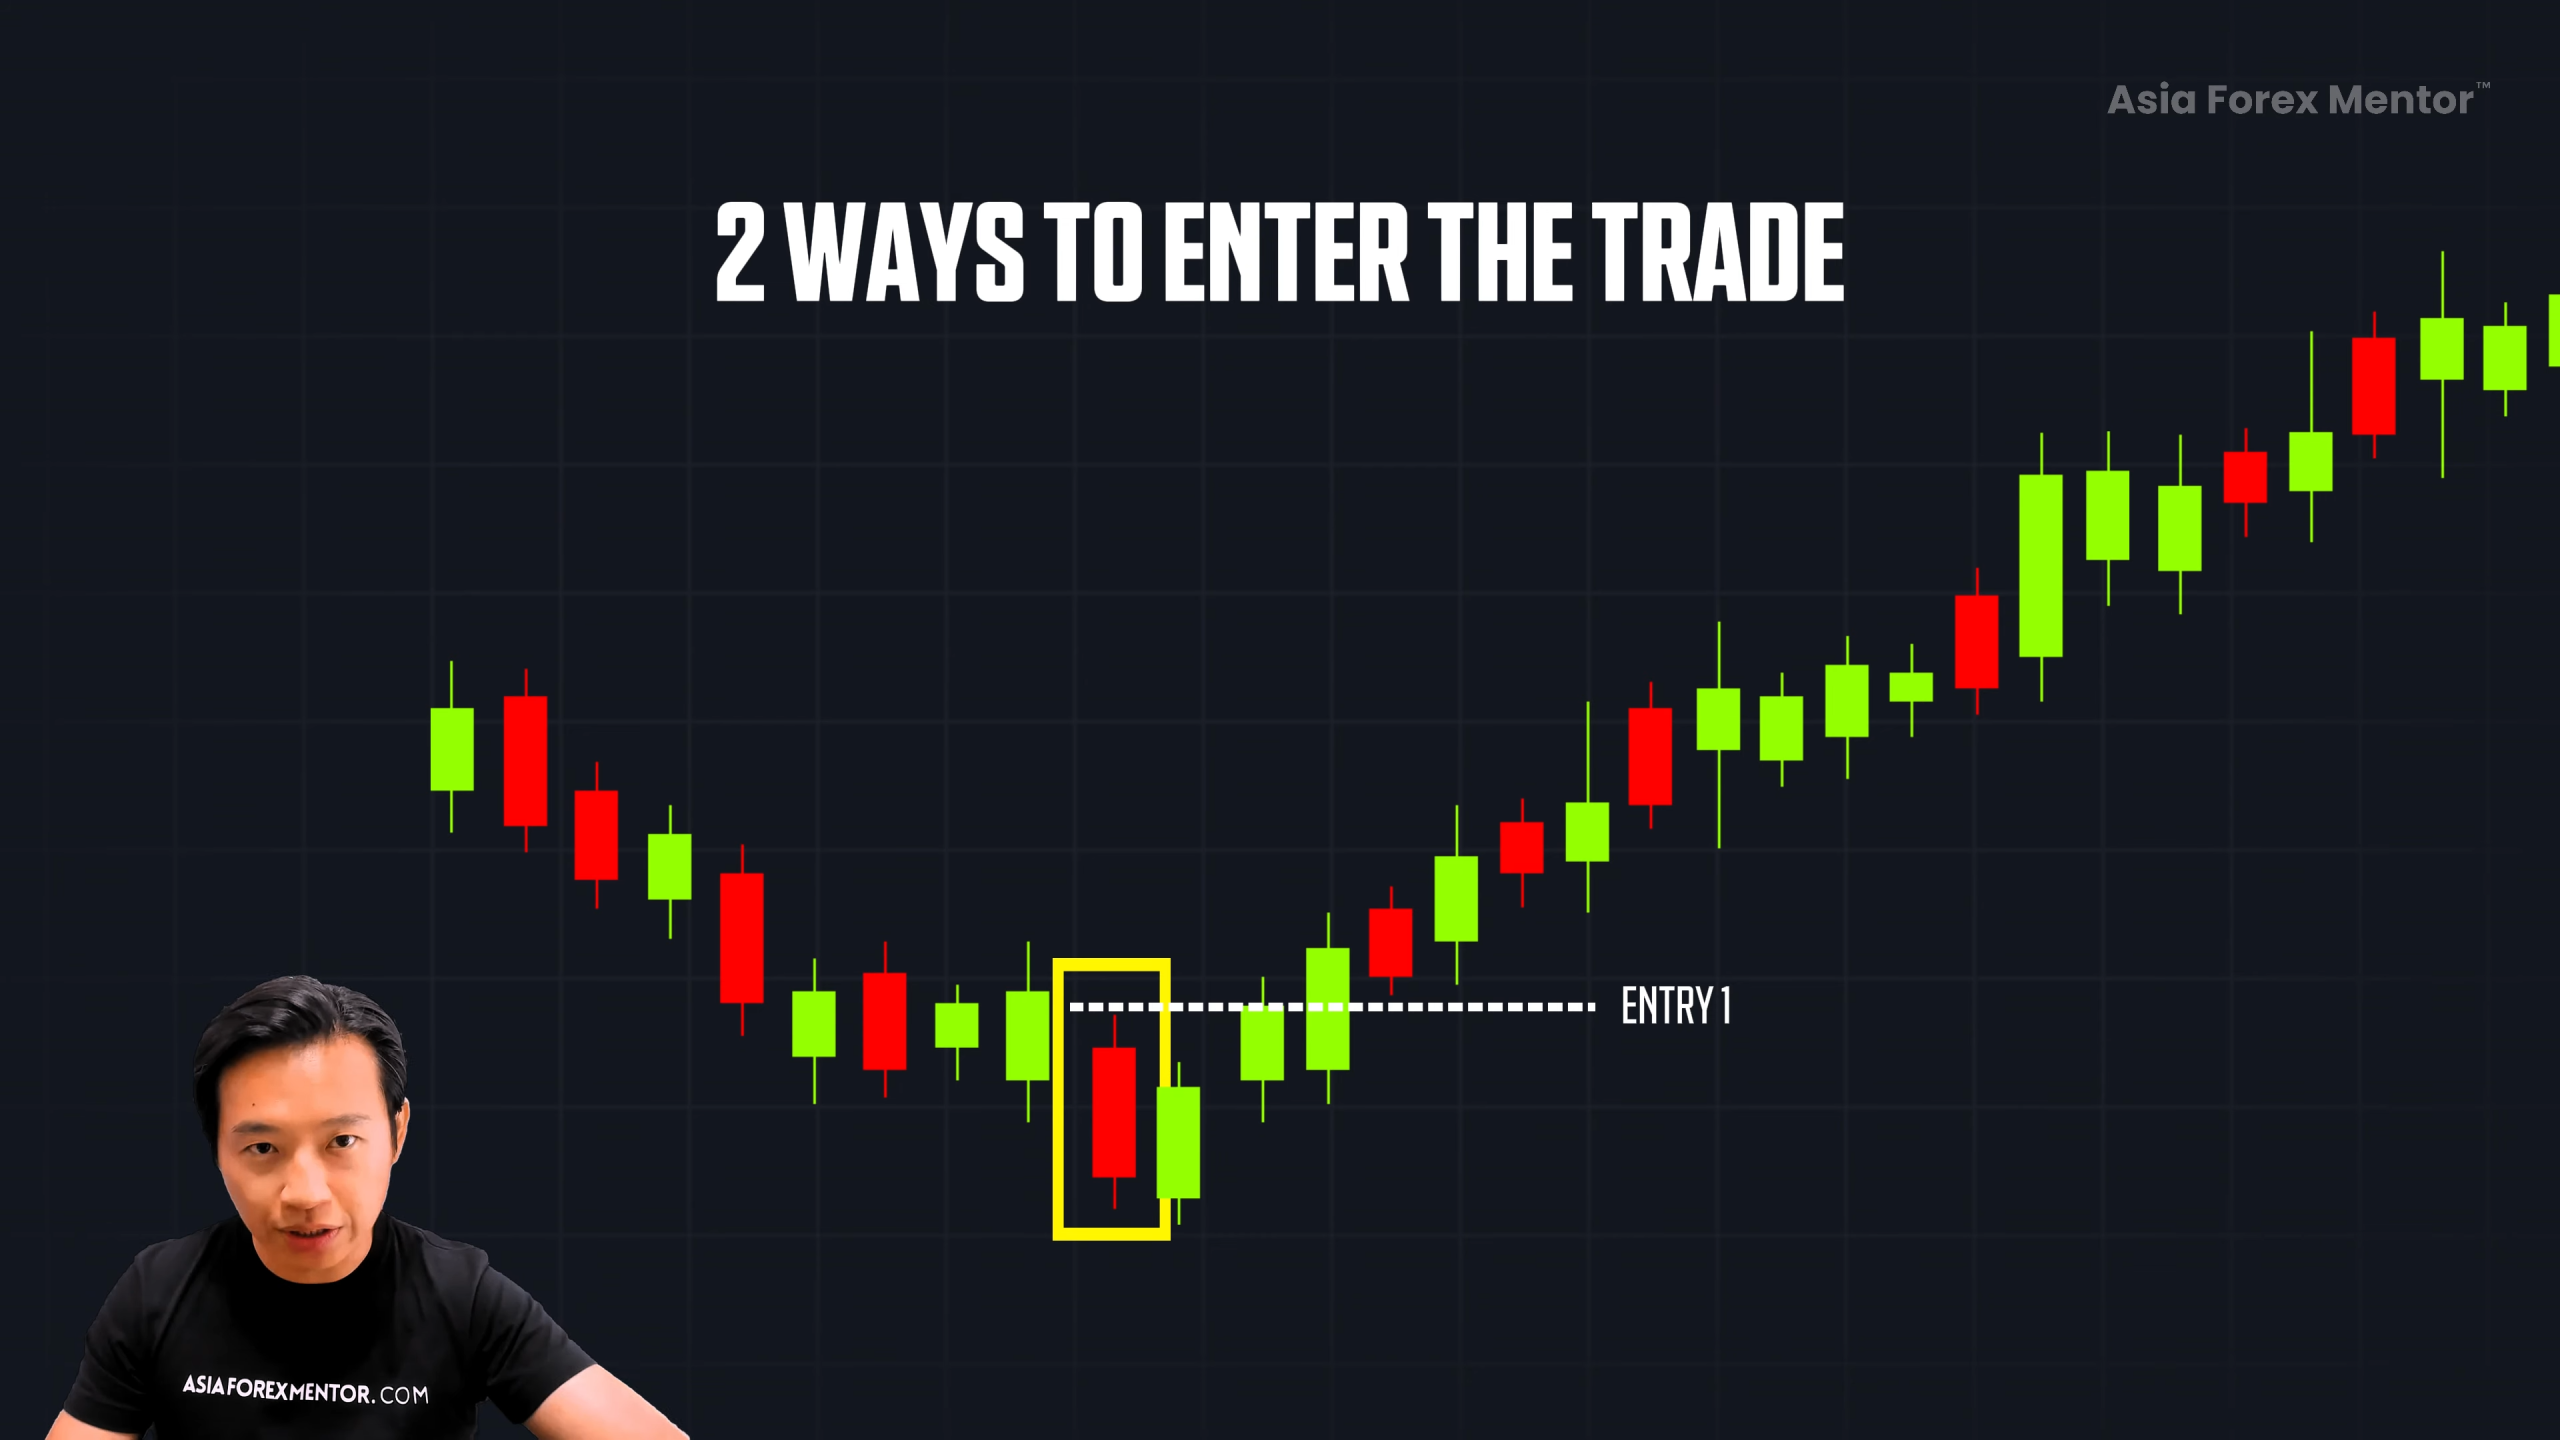
1. Aggressive: Place a buy stop above the red candle’s high
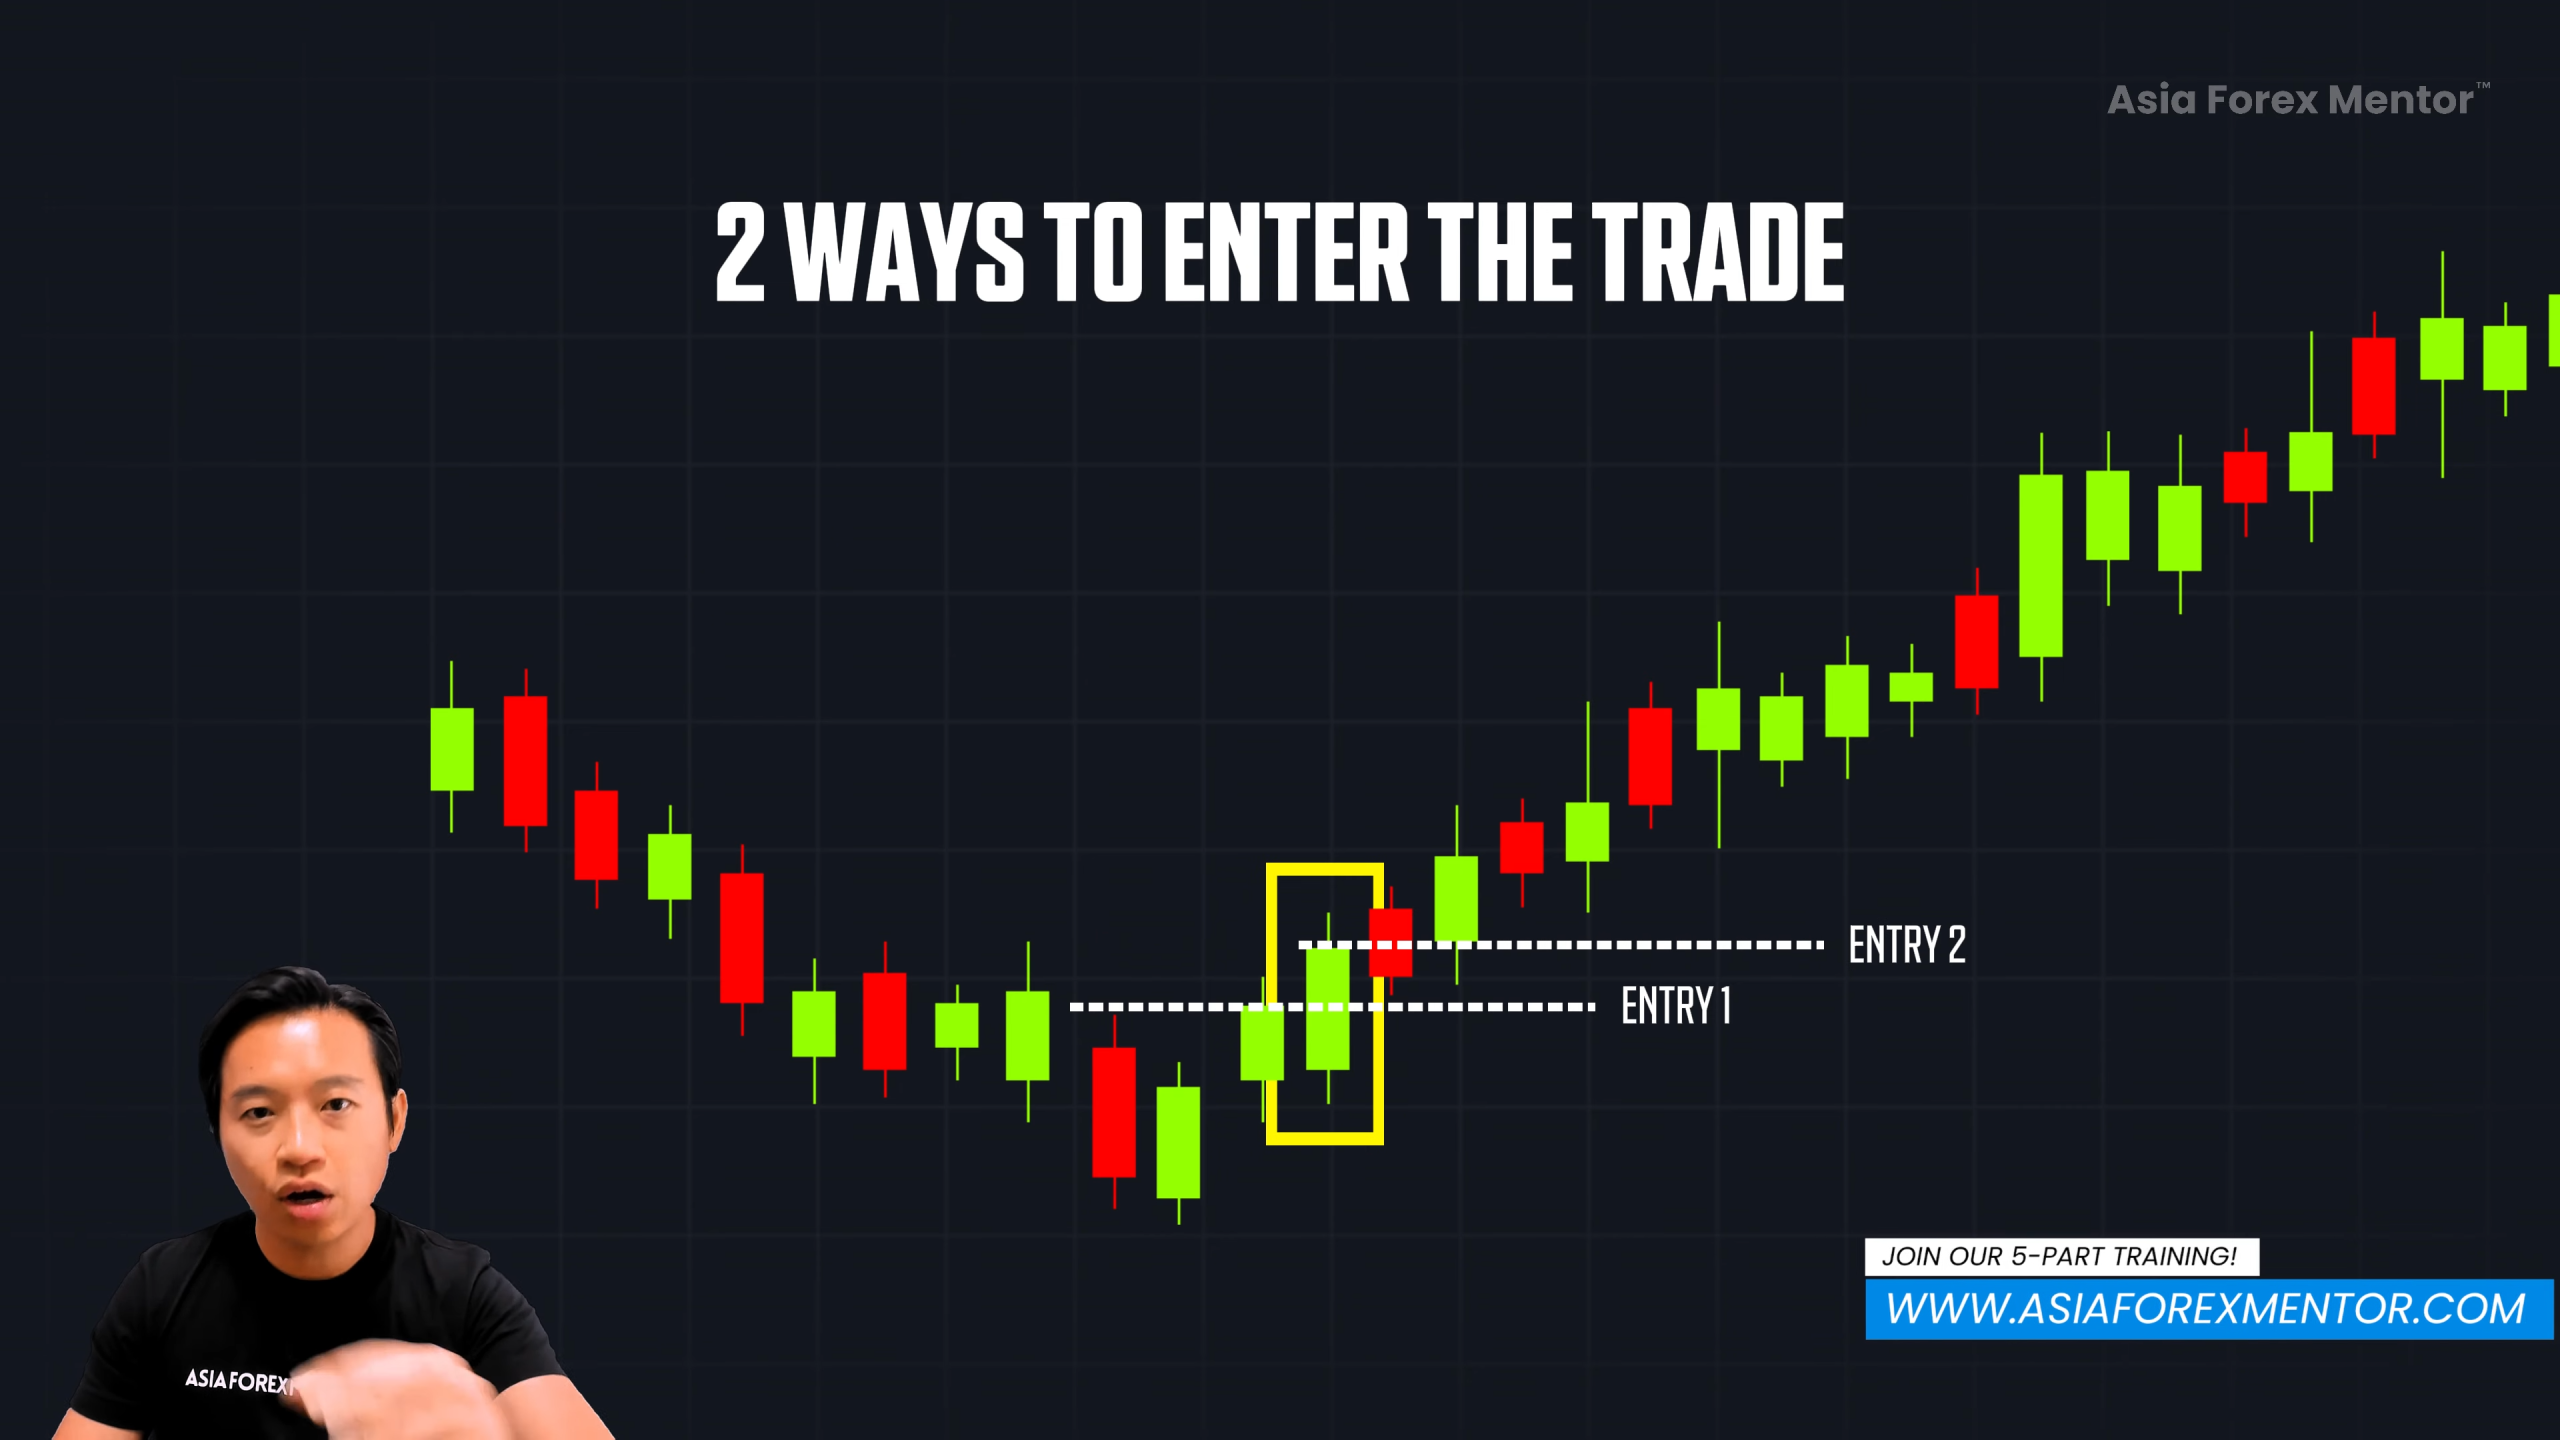
2. Conservative: Enter after the third bullish candle closes
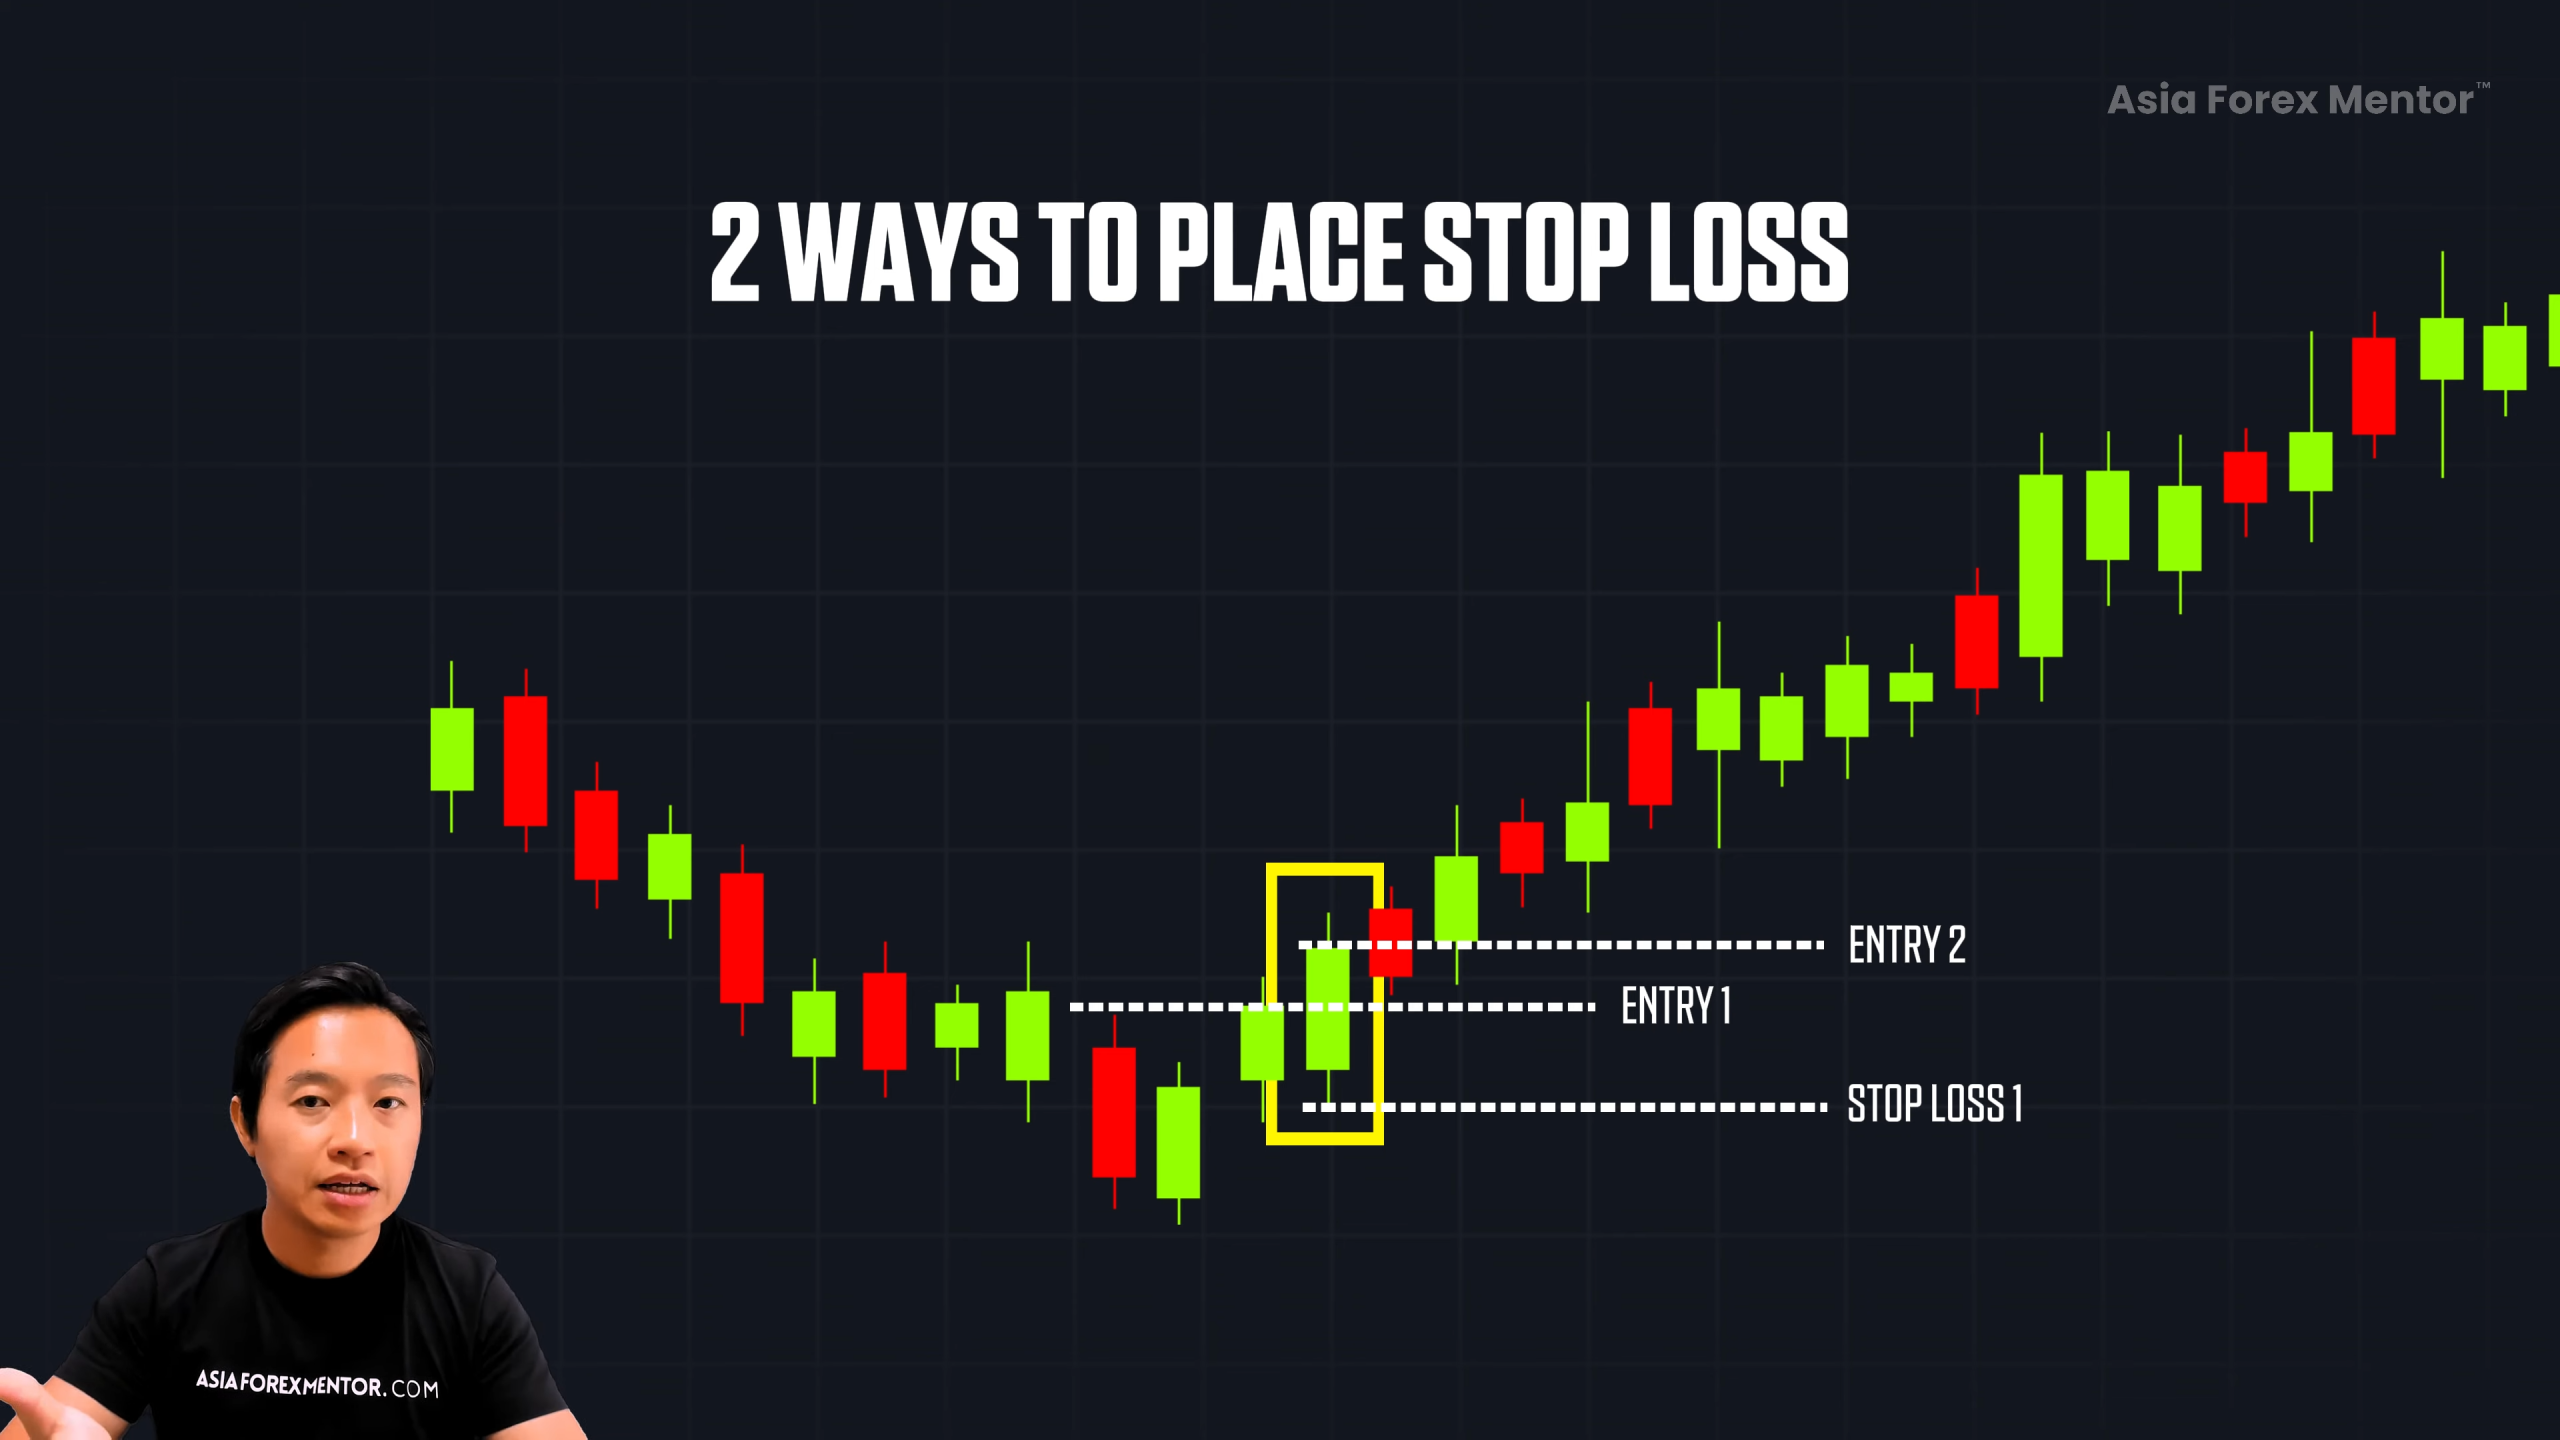
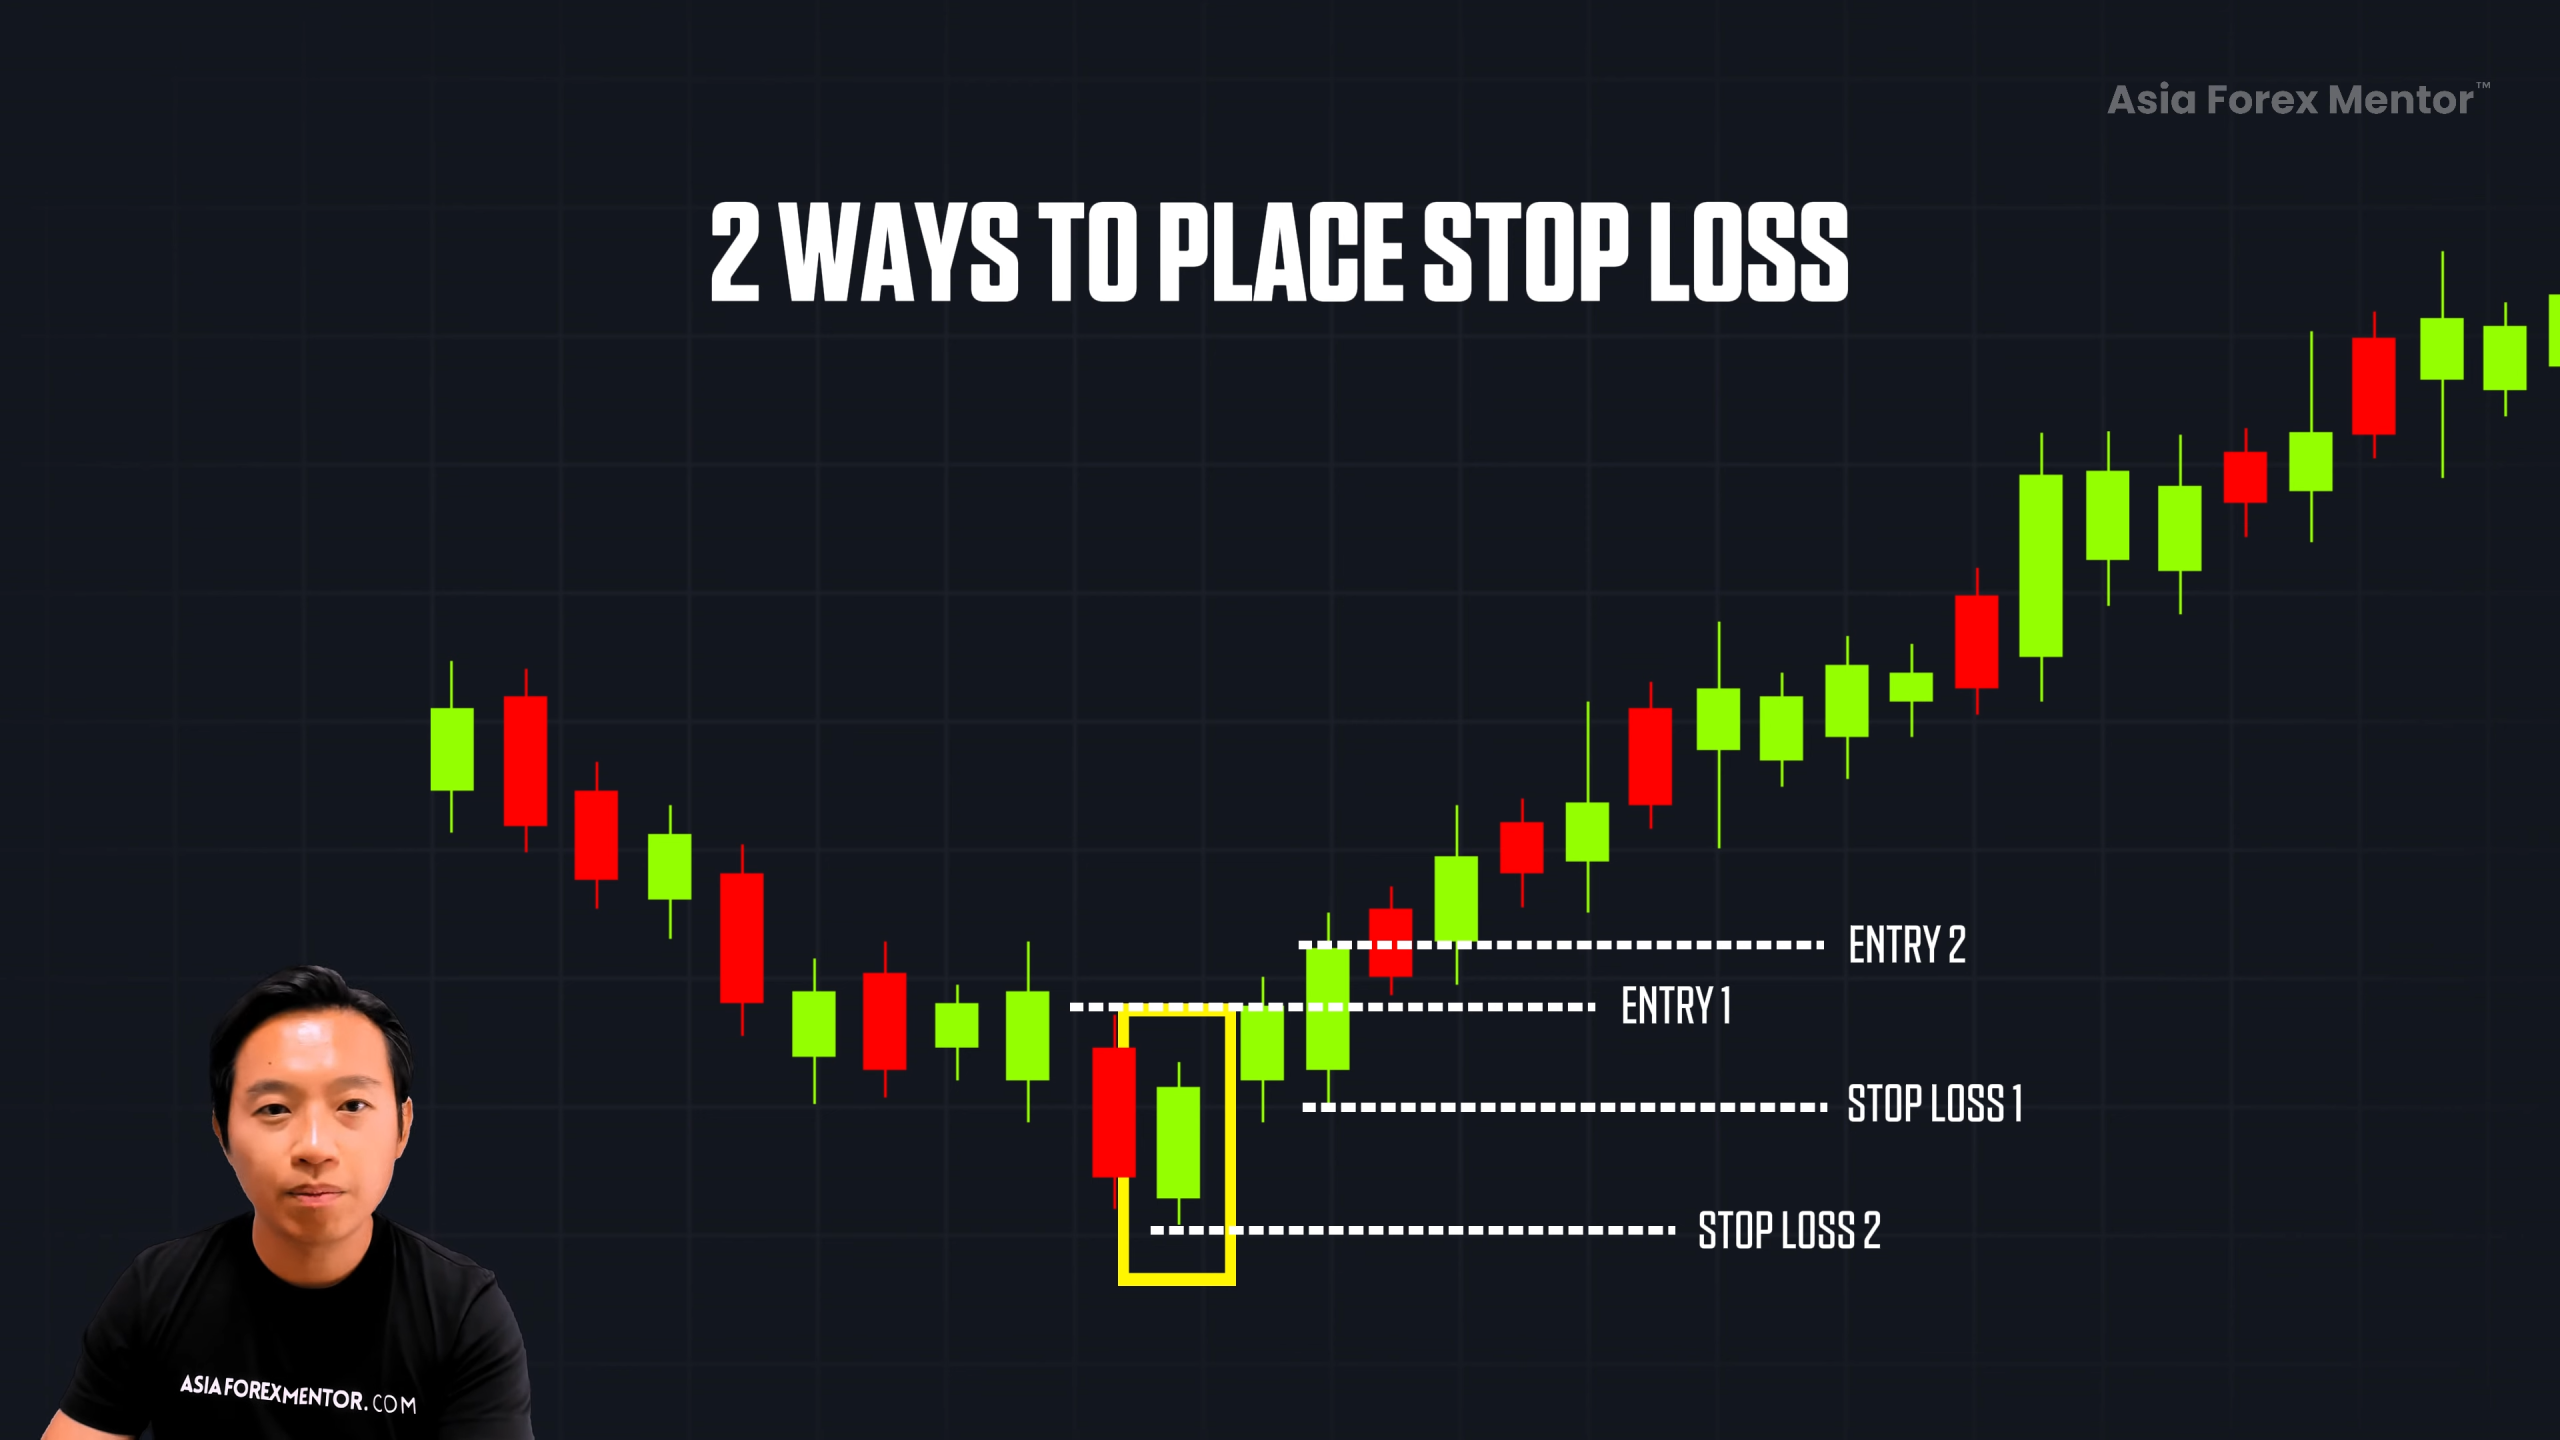
🛑 Stop Loss Placement:
-
Aggressive: Below the third green candle
-
Conservative: Below the first green candle
🎯 Take Profit:
-
Previous swing high
-
Or trail your stop if the trade runs in your favor (especially if in line with a higher time frame trend)
Risk Management & When It Fails
Let’s be real: not every pattern works out.
Sometimes price bounces, then crashes back down. That’s why stop loss placement is non-negotiable.
But when you:
-
Use the pattern with volume, support, and trend confluence
-
Manage risk correctly…
💥 You get a high-probability trade with massive reward-to-risk potential.
Recap & Final Thoughts
Here’s what you’ve learned:
✅ The Piercing Line Pattern helps you spot early signs of a bullish reversal
✅ It works best after a price drop, near support, with rising volume
✅ Confirmation with a third candle makes it even stronger
✅ Always trade in line with the higher time frame trend for best results
🎯 The best part? This pattern is simple, powerful, and rarely talked about — but now it’s yours.
So go ahead, add this to your trading toolbox and start spotting those early reversals before the crowd.
👉 The trend is your friend, and now, the Piercing Line Pattern is your friend too.
📢 Want to Learn More?
If you found this useful, I’ve created a free 5-part training where I show you exactly how I trade using my lifestyle strategy.
Until next time, trade safe and profit smart. 🙌
FAQs
Can the Piercing Line Pattern be used in any market?
Yes, absolutely! Whether you're trading stocks, forex, crypto, or other instruments, the Piercing Line Pattern applies across all charts, as long as there’s price movement and candlesticks. Just remember to combine it with volume, support zones, and market context for best results.
What time frame works best for spotting this pattern?
You can use this pattern on lower time frames (like 1H) for entries, but it's crucial to align it with the higher time frame trend (like daily or weekly). This ensures you're trading in the direction of the bigger picture, which increases the probability of a successful trade.
Is the third bullish candle required for confirmation?
Technically, the Piercing Line Pattern only involves two candles, but the third bullish candle gives you confirmation. It shows that buyers are in control and increases your confidence to enter the trade. If you're a more conservative trader, it’s smart to wait for that third candle before jumping in.