
Candlestick Patterns Cheat Sheet
For a financial trader, the markets are ruthless morphing entities that feed off trader emotions and losses. Nevertheless, with the right weapons, you can actually beat the market and make substantial profits while minimizing your losses. In this candlestick patterns cheat sheet, we will learn how to harness and employ the power of candlestick analysis.
Candlesticks are not only easy-to-use and straightforward, but they are also practical charting options that help you visualize market trends as they evolve. By allowing you to see the different changes in momentum as an instrument's price changes during the trading day, candlesticks provide traders with a robust, consistent, and reliable system to guide their trading decisions as well as forecasting short-term price movements.
Contents
- Brief Background of Candlestick Charting
- Attributes of Candlesticks
- Long Candlesticks
- Short Candlesticks
- Pitfalls to Avoid
Brief Background of Candlestick Charting
With their roots in the militaristic culture that prevailed in japan in the 1700s, candlesticks have been used for hundreds of years to analyze investors' mindset. In doing so, candlesticks help define a clearer picture of the underlying demand and supply dynamics.
Steve Nison introduced modern candlestick analysis to the west in 1989. Since then, traders have been relying on candlesticks, or candles as they are more popularly known, to guide their trading.
Candlesticks are an information-filled charting option. The candlestick patterns explained with examples in this article show how a trader can use candlestick charting to identify the end/beginning of a trend and confirm that a trend is continuing. All of these things present unique trading opportunities based on the trader's position in the market.
Attributes of Candlesticks
Every candle you see depicts the trading activity associated with the stock, currency pair, or any other trading instrument at a particular trading session.
Regardless of the time frame, candlesticks provide critical information about
- Opening and closing prices
- Trading range
- Trading direction
These three attributes give each candlestick it's distinct shape as seen below:
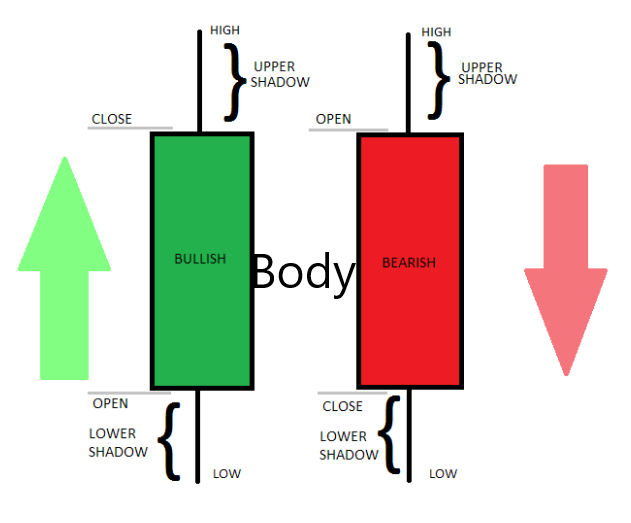
The Body
The differences between an instrument's opening and closing prices at a particular time interval create the candlestick's body. The horizontal borders at the bottom and top of the rectangular candlestick body denote the opening and closing prices.
The body's height is determined by the range between the opening and closing price. If the opening and closing prices for a period are close to each other, the body is usually small, and vice versa. If the opening and closing prices are similar, the candle won't have a rectangular body per se—the body will take the form of a horizontal line.
The body's color is determined by the closing price. If the closing is lower than the opening price, the candle can be black or red. The red candle is, in fact, referred to as the bear candle. Conversely, when the closing price is higher, the candle is often colored green or white. A green candle is also referred to as a bull candle.
The body's color is the visual attribute of candles that allows you to immediately tell the overall direction in which the price moves. The green candle shows that the session is moving upward. Similarly, the red candle is indicative of a downward-moving trend.
Candle Wicks
Above and below the body are these thin line extensions representing the highs and lows that the price reached at a particular session. The lines are called shadows, tails, or wicks.
A long upper shadow may reflect failed buyer momentum in the market. A long lower shadow, in contrast, may reflect sellers losing momentum. All these signs point towards a reversal of the existing trend.
Long-Candlesticks
A candle's shape, color, and extensions are all important, as we have already seen. The size of the candle is also equally important. Candlestick can either be long or short.
A long candle may indicate increased momentum by buyers (long bullish candle) or sellers (long bearish candles). The length shows that large price movements have been recorded between the opening and closing prices of that session.
A good candlestick pattern pdf will tell you that a long candlestick generally indicates a struggle between buyers and sellers in the market. Essentially, they are a sign of trend reversal or continuation. When long candles appear in the direction of the existing trends, they signify continuation.
A long candle that appears in a direction opposite to the existing trend may sign an impending trend reversal. This is particularly so when the long candle touches or breaks past resistance/support.
The Marubozu
A common long candle is the marubozu.
The marubozu has a body but no shadows. In Japanese, Marubozu loosely translates to ‘little hair.' This candlestick has a very tiny or no upper or lower shadow.
The very nature of the marubozu is indeed quite revealing. The lack of extensions identifies market control or momentum and exceptional strength by either the buyers or sellers.
Three variants of the marubozu pattern exist, as shown below. However, the easiest way to identify the pattern is to remember that there is always a flat marubozu line. The line could be flat at the close or open. A full marubozu is flat at the open and close.
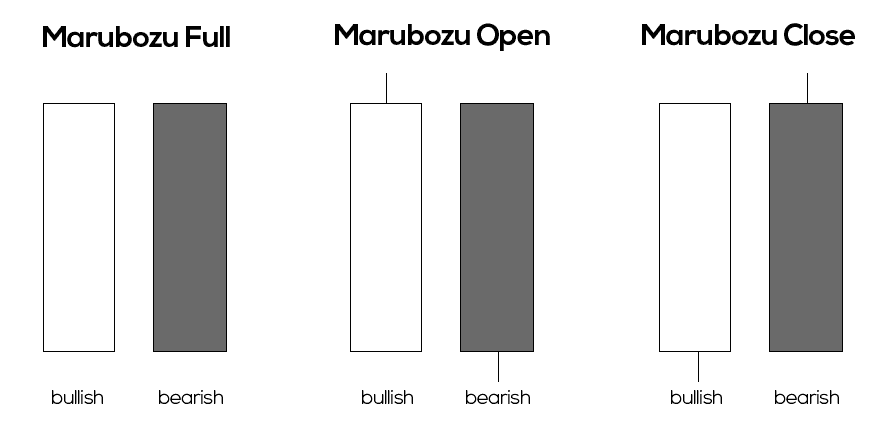
As you can see above, in all three marubozu types, they are bearish as well as bullish versions. A white/green-colored marubozu is a bullish one, while a black/red-colored marubozu is bearish.
As you will find in any candlestick cheat sheet book, the longer the marubozu, the more dramatic the price jump is.
The Bullish Marubozu
A bullish marubozu indicates so much buying interest in an instrument that market players buy at every point during that session. Therefore, the expectation is that a surge of bullishness will ensue and probably continue over the next few trading sessions.
A bullish marubozu appearing in an uptrend gives off strong indications that the trend will continue.
If a bullish marubozu appears in a downtrend, there's a strong possibility of trend reversal since market sentiments are changing with an increased interest in buying.
The Bearish Marubozu
A bearish marubozu signifies so much selling pressure in the market that participants sell the instrument at every point in the trading session. Therefore, sellers control the market, leading to a surge of bearishness that might continue over the next few sessions.
Therefore, a bearish marubozu appearing in a downtrend tells the trader that there are strong possibilities for the trend to continue. However, when a bearish marubozu appears in an uptrend, it points towards a possible trend reversal.
Short Candlesticks
A relatively short or small candlestick reveals that there's an agreement among buyers and sellers that the current price for an instrument is fair. This holds true particularly when the short candles appear in a series that form sideways moving pattern.
Nevertheless, short candlesticks may indicate a slowing momentum and/or possible trend reversal when they appear following a strong trend in either direction. This holds true particularly when long candlesticks have also begun showing up.
Doji Candles
When the open and close prices are identical, or there's a very thin range between them, the candlestick's body is usually so narrow that it consists of merely a horizontal line. The candlestick is then referred to as a doji candle.
In Japanese, doji, or more accurately “dо̄ji,” loosely translates to “blunder” or “mistake,” alluding to the rarity of open and close prices being the same.
The upper and lower extensions of a doji vary. Different signals can be drawn from a doji based on the size of its shadows and where it appears in the prevailing trend.
Nonetheless, the most important attribute of a doji is that it represents a very tight struggle in the market between buyers and sellers. As a result, neither could move the price away from the opening.
When a doji appears in a sideways, choppy market, it is mostly insignificant. However, in a trading market doji candles must not be ignored.
Doji patterns do not signify a reversal. On the contrary, they represent indecision and/or equality between the market bulls and bears. Doji often appear when the market is resting after a significant move up or down. After resting, the market will continue on its way. Nevertheless, such a pattern could be interpreted as a prior trend losing its strength.
This chart pattern cheat sheet found that depending on the horizontal open/close line's location, a doji may be described as a dragonfly, gravestone, doji star, long-legged, or a four price doji.
The Dragonfly Doji
This is a doji that forms when the highest price in a particular session is the same as the open and close. It has a long lower wick, which gives the dragonfly doji a T shape
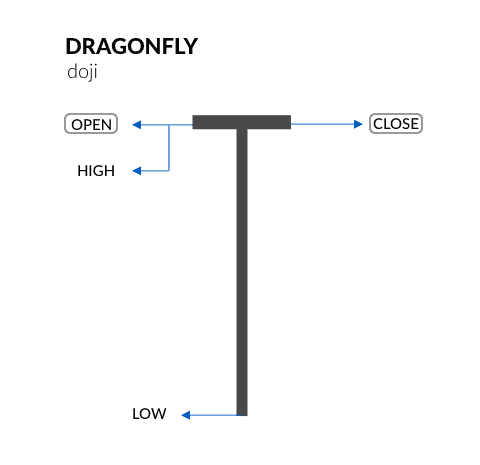
The long lower shadow of the doji shows that the bulls rejected the bears in that session. This means that, for a moment, the bears were able to push the price downward. However, support formed at the session's low, and the buying pressure that ensued pushed the price back to the opening price.
Dragonfly doji can thus be interpreted as a bullish reversal candle if it occurs at the bottom of a downtrend. Confirmation is strongest when it occurs at a level of support.
To a technician, the dragonfly doji indicates where the market tested for demand and potential support levels.
The Gravestone Doji
This one looks like an inverted T. It is the opposite of the dragonfly doji. It forms as a result of the session's low being the same as the opening and closing price.
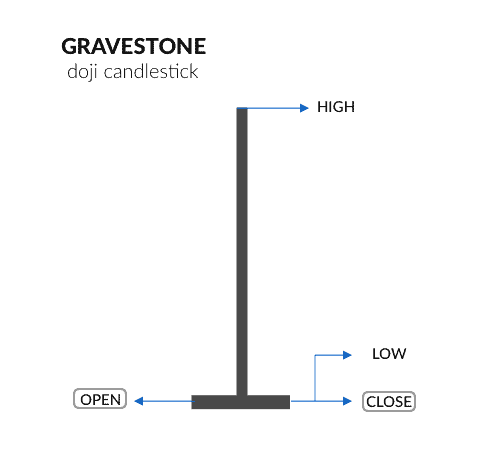
The long upper shadows suggest the initial bullish advance was eventually overcome by the bears at the end of that session. It shows that when the session began, the buyers were able to drive the price upwards. They, however, failed to sustain their bullish momentum. Resistance developed at the session's high, a selling pressure ensued, and the bears drove the price back down to the opening price.
Therefore, a gravestone doji can be viewed as a bearish reversal pattern when it forms in an uptrend. Technicians might interpret it as the market testing to look for supply and potential resistance levels.
The Doji Star
Also known as the standard doji candlestick, this pattern forms when all buying and selling is in equilibrium.
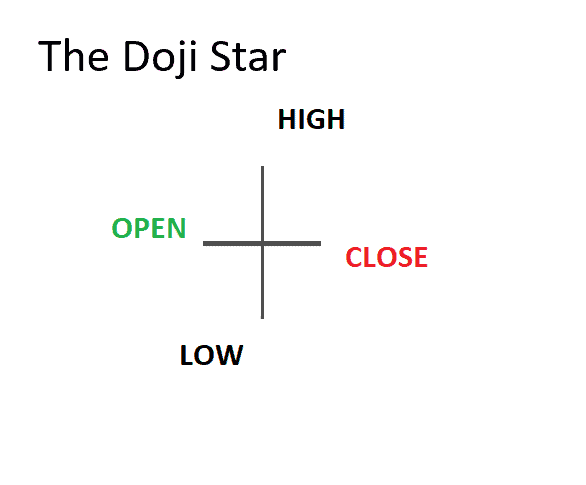
On its own, the doji star doesn't reveal much. However, it might offer useful insight when placed in the context of the ongoing price trend.
A doji star pattern occurring within an uptrend may point towards a possible change in market direction. For instance, a doji star preceded by a strong bullish candle formation (and its high is lower than the doji star's high) may be considered a sell signal for traders.
The Long-Legged Doji
The long-legged doji is like the doji star but with longer shadows.
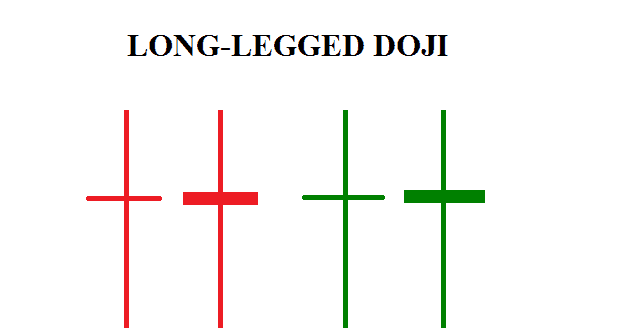
This pattern is seen in a session where both sellers and buyers tried to dominate, but neither succeeded in controlling the market.
The significance of the long-legged doji is viewed in terms of where the closing price lies in relation to the candlestick's midpoint.
- If the closing point falls below the mid-point, the doji may be viewed as a bearish bar especially if it occurs at a resistance level. Hence it may point to a possible downtrend.
- If the closing point is above the midpoint, the doji may be viewed as a bullish bar especially if it occurred at support level. As such, it could be a pointer towards a possible uptrend.
Four Price Doji
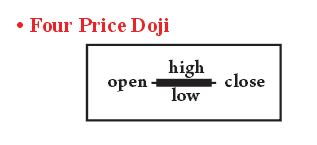
This extremely rare doji occurs when the open, close, high, and low prices are similar. The four price doji is so rare that you should suspect some data errors once you see it. For instance, it may form when the data source only had the closing and no other prices.
Further read: The Doji Candle Complete Guide
Pitfalls to Avoid
Ask any forex trader, and they will tell you that no charting system can provide absolute accuracy. All signals, including candlesticks, can fail. Therefore, it would be ill-advised to believe that candle patterns ensure 100% accuracy and perfect guarantees of entry and exit times.
Some common financial trading pitfalls to look out for include:
Failing to Consider the Fundamentals
Price patterns occur as a reaction to certain market-related events. These events are the fundamentals such as earnings reports, consumer indices, or divided announcements, among many others. The fundamentals determine how the prices move.
Forcing Indicators
Interpreting signals is never easy. Many traders continuously struggle to find good, reliable information. A common pitfall is trying to find information where none exists. A trader in a long position may, for instance, find themselves looking for bullish signals, especially when prices are going down or moving sideways. Therefore, trade objectively and study the signals carefully instead of merely looking for the type of candlestick movement you desire.
Emotional Trading
A popular saying in financial trading is that bulls and bears make money. Pigs and chicken, on the other hand, get slaughtered. ‘Gut reacting' to price movements is probably one of the greatest pitfalls in financial trading. Many traders, especially new traders, often react emotionally to changes in the market. Emotions of greed and panic are quite common, and they have been known to drive people into huge losses.
Therefore, even as you apply this candlestick patterns cheat sheet in your trading, always be analytical, adopt a strategic approach, and never let emotions of greed or panic control your trading decisions.


