Simple Moving Average Trading Strategy
The Simple Moving Average is a renowned indicator used by many. Ranging from beginners to professionals. It is a flexible and versatile indicator that allows the user to customise its settings according to their personal strategy. Even then, there are many who use Simple Moving Average trading strategy by itself, with their own backtested unique settings.
Simple Moving Average – Video explaination
Simple Moving Average
- What is it?
- How to use?
- Profitable Moving average forex strategies
- Best moving average crossover for intraday trading
- Pros and cons
- Conclusion
- Rating
- Infographic Representation
What is it?
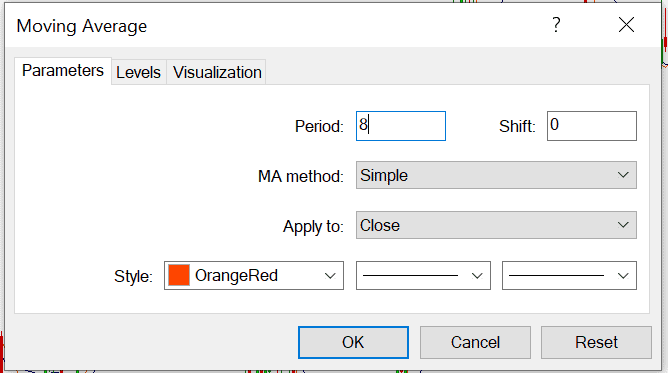
A simple moving average (SMA) is an arithmetic moving average calculated by adding recent prices and then dividing that figure by the number of time periods in the calculation average. Its profitability depends on its unique characteristics set by the user. Users are able to tweak the parameters of the indicator, which contains the period, shift, method and application. Firstly, the period of the indicator is the number of past candles taken into calculation. Secondly, the shift of the indicator is the change in the candles taken into calculation without changing the period, from the most recent candle. Thirdly, the method of the indicator refers to the type of calculation involved. Lastly, the application of the indicator refers to the type of sample data to be used for the calculation.
How to use?
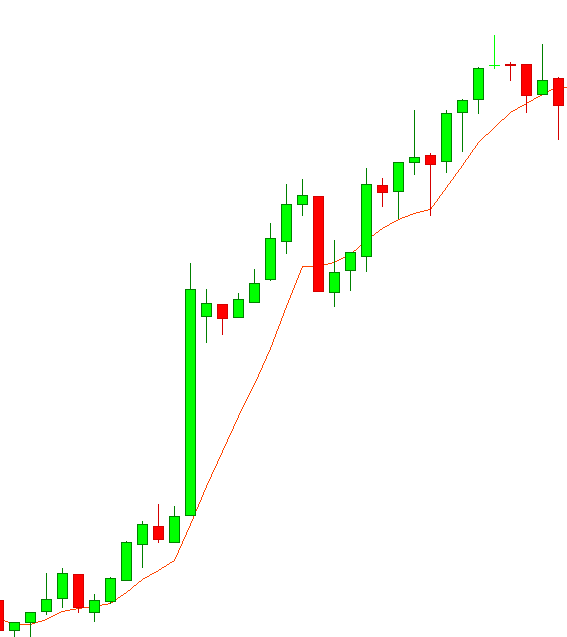
The Simple Moving Average can be used in two main ways, to identify the trend of the market as well as to identify the support and resistance of the price action. When prices that are above the Simple Moving Average, the market is seen to be in an uptrend.
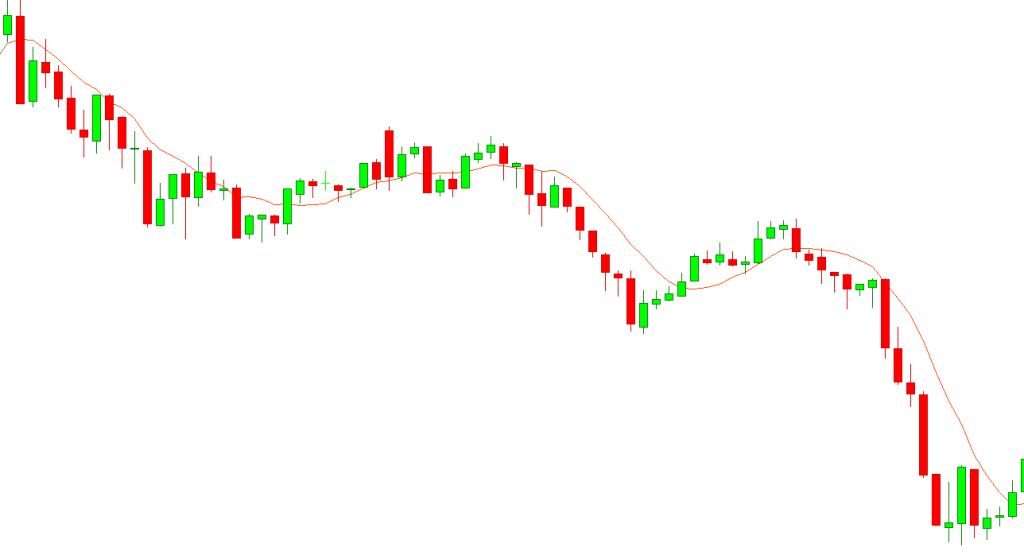
Whereas, when prices are below the Simple Moving Average, the market is seen to be in a downtrend.
Furthermore, the Simple Moving Average also acts as a form of dynamic support and resistance. This means that the Simple Moving Average serves as a self-adjusting level of rejection that corresponds with the market. Coupled with other indicators, price action and fixed support and resistance lines, the Simple Moving Average will no doubt provide a deeper insight to the trading analysis.
Profitable Moving average forex strategies
Gold & death cross with charts
ELAB on Chart e.gs
One of the profitable moving average forex strategies would be the Moving Average crossover. This trading strategy requires the utilisation of two moving averages, Simple or Exponential, to identify Golden and Death crosses. A Golden cross is a bullish formation when two moving averages cross each other, giving confirmation that the price action is in the midst of a transition to an uptrend.
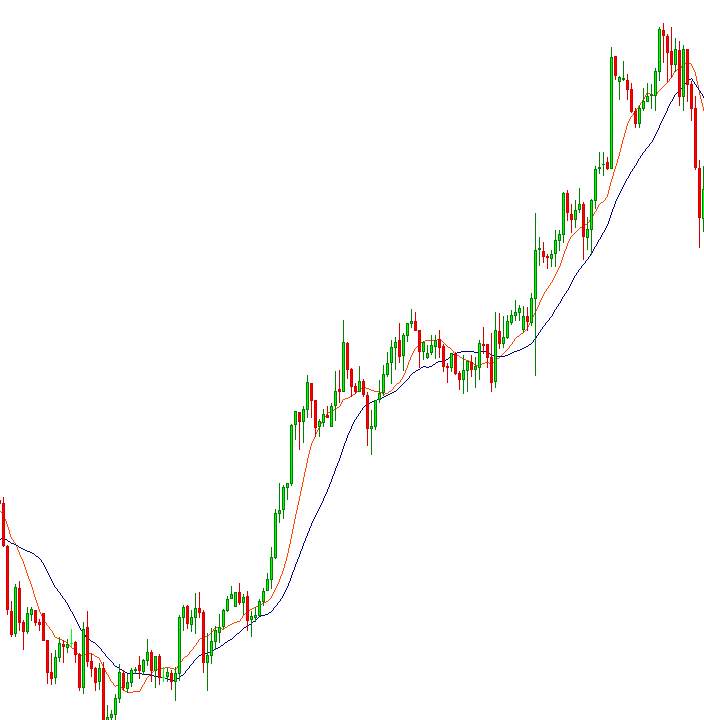
For this strategy, a buy signal is indicated when the price action is above the crossing over of the two moving averages, as depicted with the blue arrows in Fig 1.3 and an exit signal is indicated during the first subsequent crossing over of the two moving averages as depicted with the red arrows in Fig 1.3.
On the other hand, a Death cross is a bearish formation when two moving averages cross each other, giving confirmation that the price action is in the midst of a transition to a downtrend.
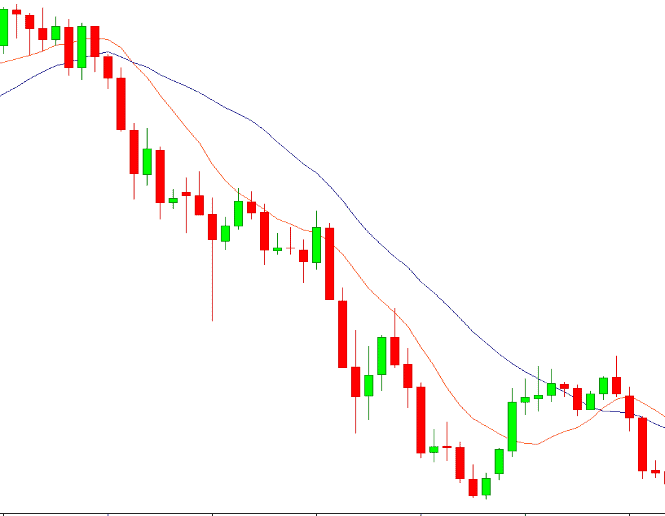
Similarly, for this strategy, a sell signal is indicated when the price action is below the crossing over of the two moving averages, as depicted by the blue arrow in fig 1.4 and subsequently, an exit signal is indicated during the first crossing over of the two moving averages, as depicted by the red arrow in fig 1.4.
Best moving average crossover for intraday trading
ELAB on Chart e.gs
- The Moving Average crossover strategy works best in the long term, for day traders as well as swing traders. However, it is still possible to be a profitable strategy in intraday trading and scalping as well. Naturally, the settings of the moving averages used must be tweaked. However, the profitability and settings of the moving averages on its own as a strategy does vary from pairing to pairing.
- Based on a personal backtest on a few pairings as examples, namely USDCHF, USDJPY and NZDUSD, I find the best settings for an intraday trade with the H1 timeframe to be SMA 10 and 21.
-
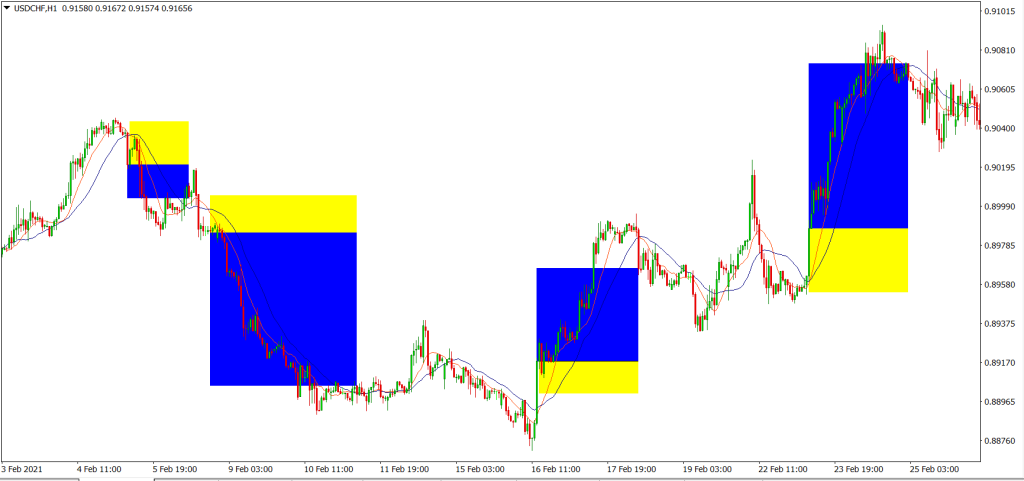
Fig 1.5: Eg of application with SMA 10 and SMA 21 crossing strategy in the H1 timeframe. - The results of the other two pairings were similar to that of USDCHF.
- As observed, this strategy is able to capture huge movements in the H1 timeframe, but mostly unable to capture the market when it is consolidating.
- Hence, by minimising the number of trades during a consolidation and maximising the number of trades during huge movements, the strategy will be sustainable.
- However, the challenge of this strategy will be to identify these price action.
- On the other hand, using the same pairings, I find out that the best settings for scalping with the 15m timeframe to be SMA 8 and 21
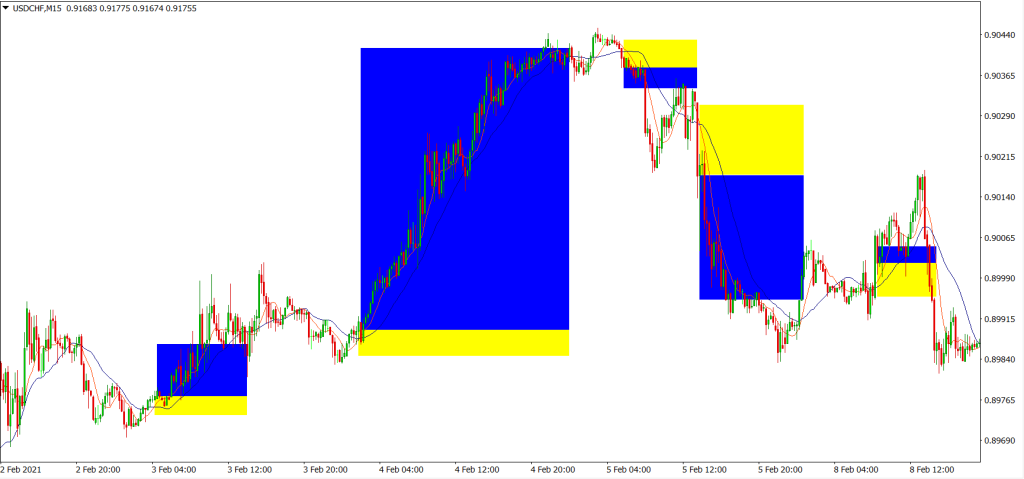
- Similar to the H1 strategy, a slight tweak in the SMA settings allows you to capture huge movements. The results of the other pairings are also similar to the results of the backtest in USDCHF 15m timeframe.
- Because both are SMA derived strategies they have the same strength and weaknesses as well.
Pros and cons
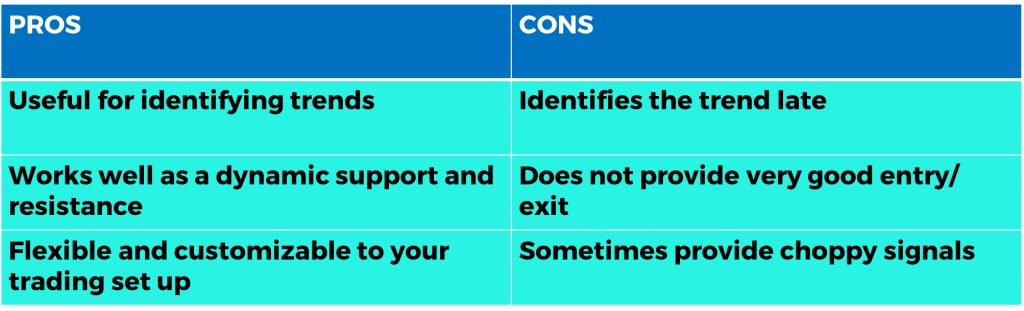
- In this section, we will explore the advantages and disadvantages of using Simple Moving Averages. The first advantage is that it is rather useful for identifying trends, especially when using two Simple Moving Averages.
- Secondly, it works well as a dynamic support and resistance, which up to today, most traders utilise.
- Finally, it is highly customisable with its settings, making it a flexible and versatile fit for various trading strategies
- However, even if it is rather useful for identifying trends, it is still a lagging indicator. This means that it will identify the trend with time delay, making, less reliable in choppy markets.
- Because it is a lagging indicator, when used alone, it is unable to time the entries and exits of trades with sharp accuracy.
- Furthermore, due to the characteristics of a lagging indicator, it is prone to giving unclear and choppy signals when the market is going sideways or is in a consolidation.
 BT findings based on SMA 10 EMA 50- example of a widely used combo for a longer timeframe
Stats
- The most common way traders utilise moving averages, is to pair one short period Simple Moving Average and one long period Exponential Moving Average together. In this case, we shall be using the 10 period Simple Moving Average for our short term and the 50 period Exponential Moving Average for our long term.
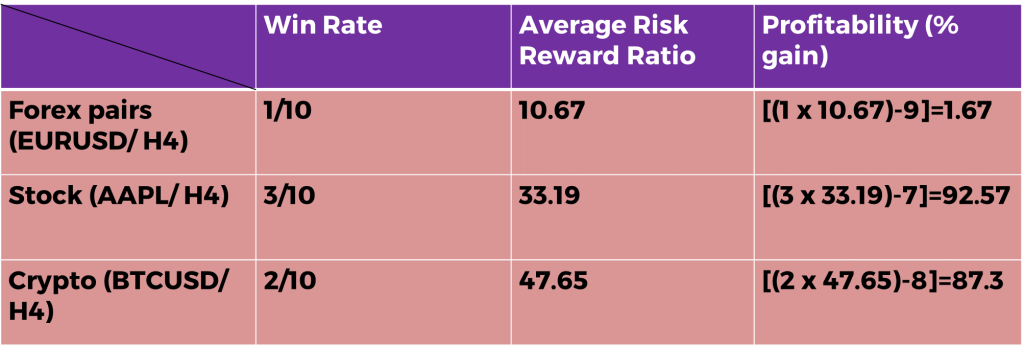
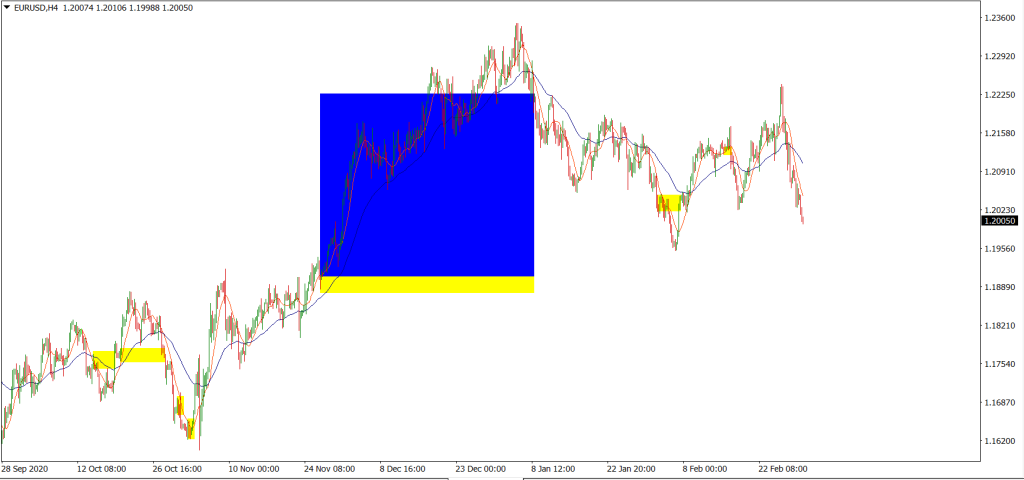
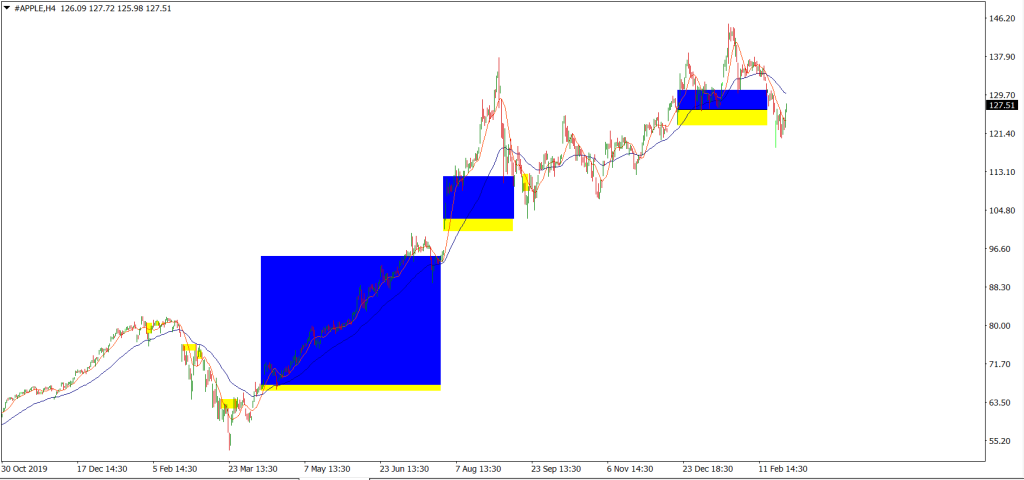
- For this backtest, we will be taking EURUSD as a sample for the forex pairing, AAPL as a sample for stocks and BTC for a sample for cryptocurrency.
- For simplicity, we will assume that all trades taken have a risk of 1% of the account.
- Definitions: Avg Risk reward ratio= ( Total risk reward ratio of winning trades/ total no. of wins) Profitability (% gain)= (no. of wins* reward)- (no of losses* 1) [ Risk is 1%]
- We will place an entry after the crossing of the two Moving Averages and when the candle closes above both Moving Averages.
- We will then exit right when the next crossover takes place.
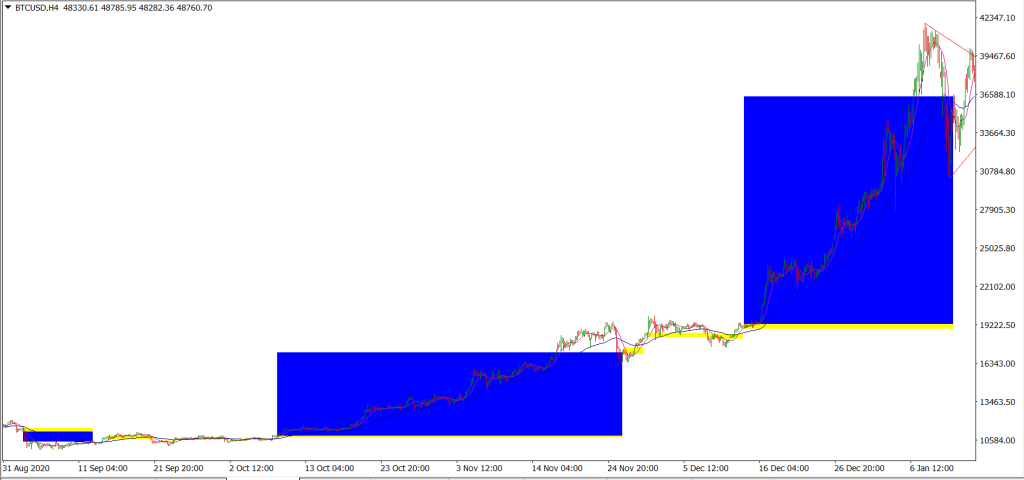
- Application on the rules of the strategy are as shown in fig 1.7.
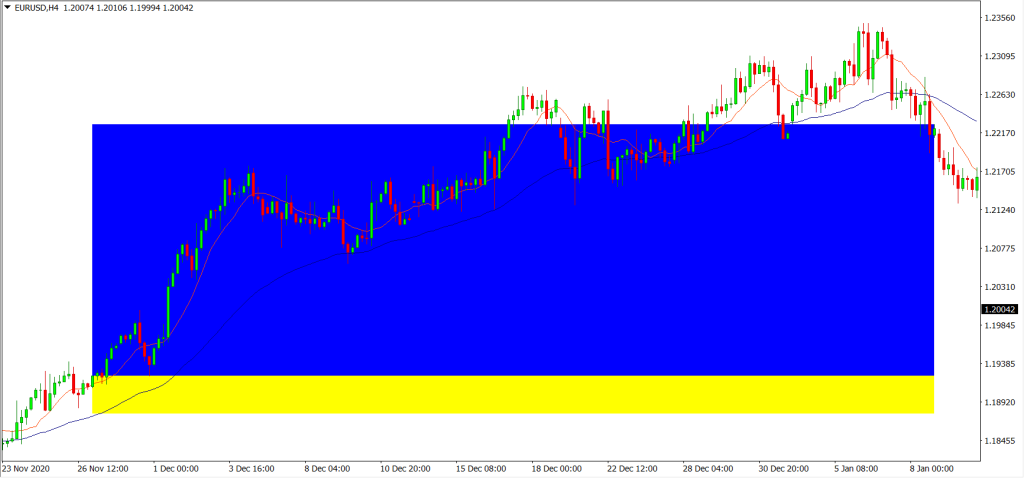
- For the Backtest results, trades with blue and yellow zones indicate an overall win with the blue zone as reward and the yellow zone as the risk taken.
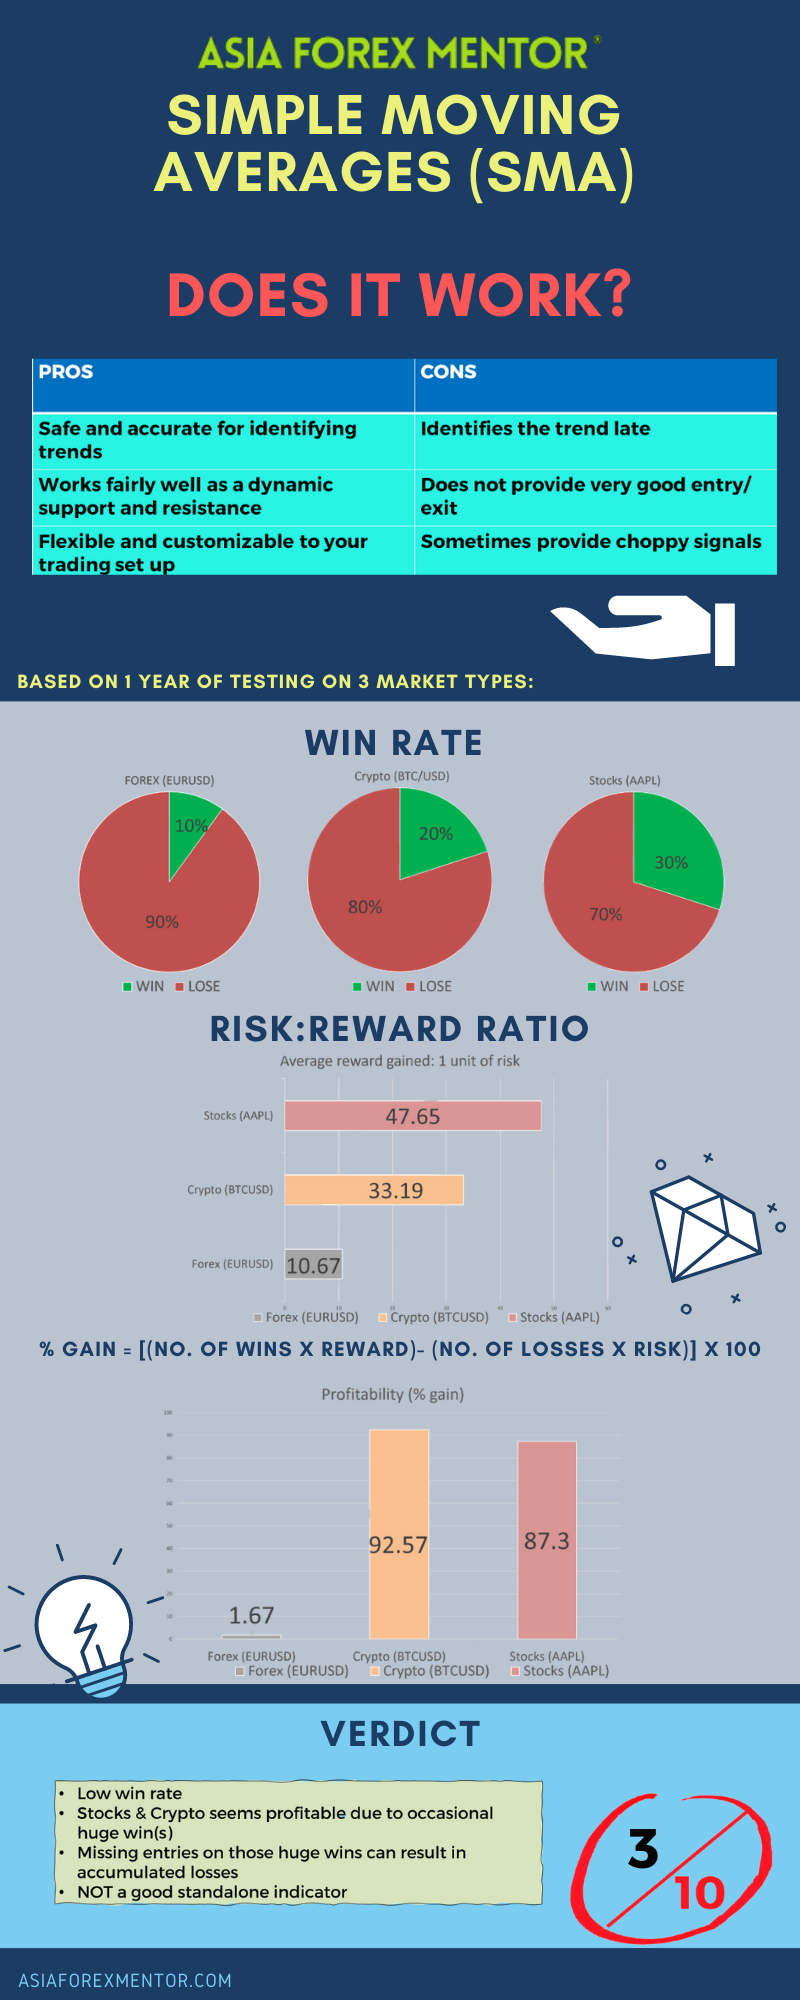
- As shown in our backtest, the win rate of this strategy for EURUSD (Forex) is 10%, AAPL (Stocks) is 30% and BTC (Crypto) is 20%
- The average risk reward ratio of this strategy for EURUSD (Forex) is 10.67, AAPL (Stocks) is 33.19 and BTC (Crypto) is 47.65.
- The profitability of this strategy for EURUSD (Forex) is 1.67, AAPL (Stocks) is 92.57 and BTC (Crypto) is 87.3
Conclusion
The Forex results were the closest to the common results of using only the SMAs to trade. The Stock and Crypto results were greatly affected by the market sentiment at that time, the Covid crash and recovery, as well as the crypto bull run, therefore creating huge trends, giving an anomaly to the expected percentage gain. The SMAs alone will definitely not be profitable given the bad win rate, unless just like the backtest, you are able to capture a trade in a tremendously long trend, which is very rare. In truth, the market moves in waves, and more than often, it needs to consolidate sideways. Thus, the Simple Moving Average trading strategy on its own is unable to provide good trade signals in a choppy market, which may result in accumulated losses. However, coupled with other indicators, the Simple Moving Average will still be useful in many ways to your set up nevertheless.
Rating
3/10
Infographic Representation