The Bollinger bands trading strategy (divergence) or what we would refer to as the Bollinger bands divergence strategy is an advanced set up built from the understandings of multiple strategies. The reason why the Bollinger bands divergence strategy works is because of how the two different strategies, the RSI and the Bollinger bands strategy, complement each other, covering the weaknesses and enhancing the strengths of one another. How exactly do they do that? To figure that out we have to first understand how the individual indicators work.
Content
Goal of the article (FAQ)
-
- what do Bollinger bands tell you?
- how to use Bollinger bands with RSI?
- what is divergence?
- what does divergence mean?
- how to find divergence?
- what does RSI mean?
Bollinger band divergence for beginners
Though the Bollinger bands divergence is a rather advanced strategy, it is one of the many strategies on the list for beginners to master and pick up. Beginning traders tend to need more guidance in market reading and trade execution as they tend to over trade in the market, allowing trades of lower probabilities to be factored into their decision-making process. To curb this common problem amongst the newer traders, the Bollinger bands divergence strategy are able to provide a form of cross check to filter out the majority of “unnecessary trades” that should not be taken since it comprises of two trading indicators of complementary function. On top of that, the prevention of overtrading would also lead to a peace of mind and a less stressful trading session as the newer trader is more confident when trading with reliable confirmation. This would further mean that the newer trader would receive lesser emotional pressure during his trading sessions as lesser trades taken would mean avoiding more emotional rollercoasters. Ultimately, this would also potentially save the accounts of various beginners giving them a less bumpy start to their trading career.
How to use
The Bollinger bands divergence is simple to use as long you are familiar with the applications of the indicators and also the concept of divergence in the market. This strategy works by identifying over bought areas for a sell and over sold areas for a buy. Once identified, look at the RSI indicator for any market discrepancy, also known as divergence. If the RSI shown a strong divergence, proceed to wait for prices to form a price action signal corresponding to the direction of the trade. Finally, execute the trade and manage it via trail stops.
Also read: Algorithmic Trading Strategies
Back to top
Is it possible/ feasible?
The Bollinger bands strategy on its own relies heavily on the Bollinger band indicator. The Bollinger band indicator segregates the market into 3 main sections for technical analysis. The Bollinger bands indicator is also able to identify and point out over bought and over sold areas, also known as over or under valued areas. Furthermore, it is able to identify markets during low and high volatility by the contraction and expansion of the bands with respect to the price movements. However, being able to time entries is the Bollinger bands indicator’s greatest weakness.
On the other hand, the RSI strategy relies heavily on the RSI indicator, which is able to represent price movement as an oscillation from a range of 0-100. This also allows it to identify over bought and over sold areas in the market as well as divergence. A divergence is the discrepancy between the momentum of the market and the price movement of the market. What this means is that there are scenarios where even when the market is bullish, the underlying momentum is increasing at a decreasing rate or may even be declining. Being able to read and identify bullish and bearish divergences can allow traders to be a step ahead of the market and thus allowing the next movement of the market to be predicted with higher accuracy.
The two indicators may have their respective strategies, however, when put together they complement each other and give rise to a better strategy that eliminates many bad trades. This can be done by cross referencing the market with the two indicators mentioned. For example, before executing a trade that fits the description of the Bollinger bands strategy, we can also take a look to see if there is any for of divergence present to great increase the probability of winning the trade.
Though the strategy can also be used for normal Bollinger band set ups, it would be recommended to be only playing the market when any form of divergence is present. This helps to avoid overtrade the market resulting in the prevention of numerous potentially bad trades that can affect the statistics of your account and trading career.
Also read: Futures Trading Strategies
Trade rules
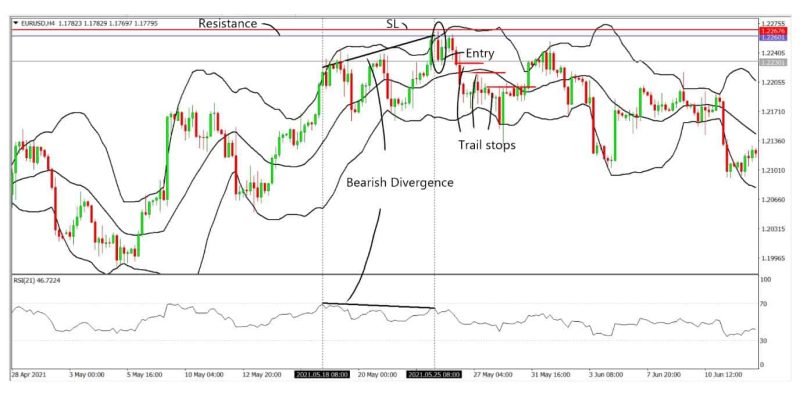
To apply this strategy, take note once RSI shows divergence. Isolate the divergence with 2 vertical lines. Next wait for a bounce on the upper or lower band of the Bollinger band, depending on the direction of the divergence. Next, plot the nearest support or resistance level near the rejection bounce. Enter the trade on a strong bounce off the lower or upper band and place stop loss order below the nearest support or resistance that was plotted. Once the trade has been executed, proceed to trail stoploss orders below every new point of support or resistance formed.
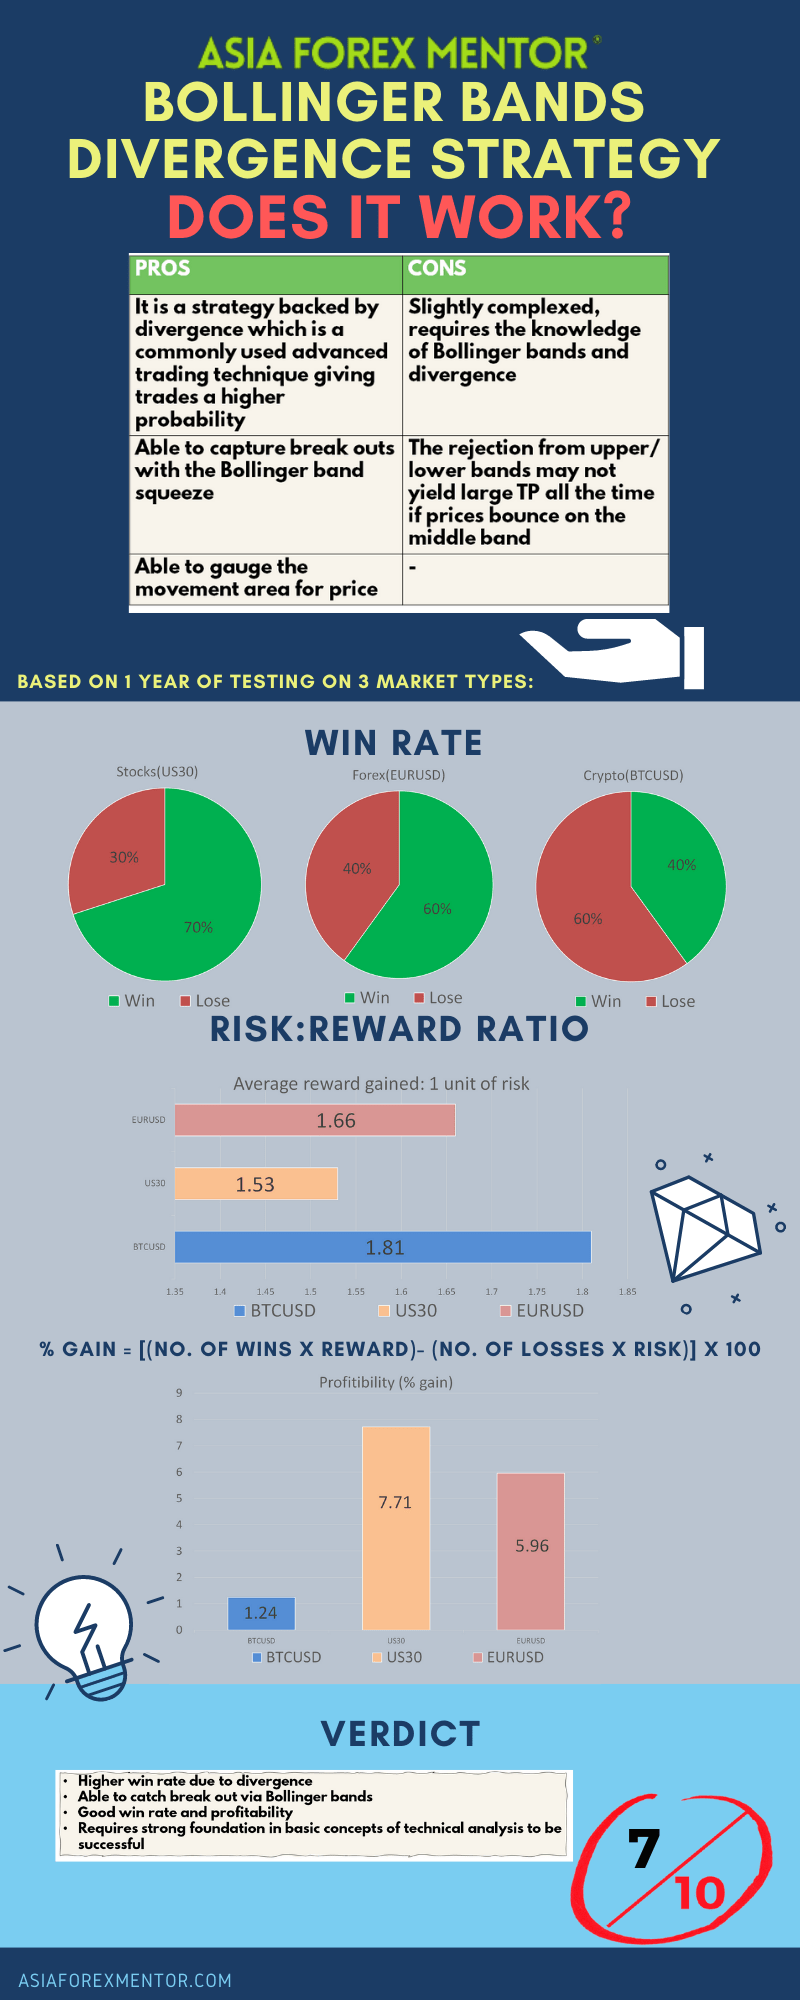
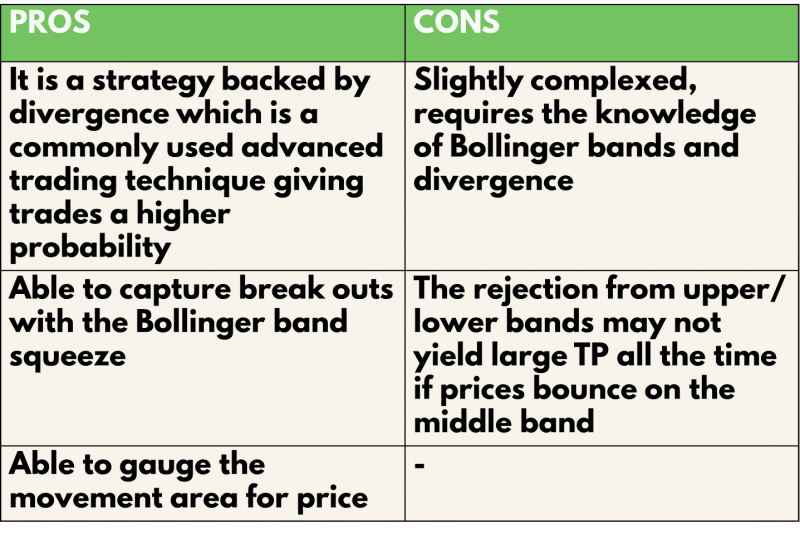
Pros and cons
The pros of adopting the Bollinger bands divergence trading strategy is that it has a higher probability of winning a trade since it incorporates divergence into the decision making process. On top of that, it is able to obtain information regarding break outs in the markets ahead of time with the Bollinger bands squeeze strategy to provide information on the market ahead of time. This enables the trader to be ready and prepared to trade the breakout that is forming. Lastly, as the Bollinger bands segregates the market movement into 3 segments, it allows the trader to gauge the movement and the valuation of the price giving additional information to trade the market with a higher probability. However, it is slightly complexed to use this strategy, especially for beginners as they would be required to know all about the indicators involved as well as the theoretical knowledge of divergence. Subsequently, this strategy does not have a fixed profit yield as it is based on how vigorously prices were to bounce off the upper and lower bands, keeping in mind that the middle band could act as an area of resistance as well. Thus, the take profit margin is not a constant variable in the trading strategy.
Analysis
To find out the profitability of the Bollinger bands divergence trading strategy, we decided to do a back test based on the past 10 trades from 30 Jul 21 on the H4 timeframe. The rules for entry will be the same as what was mentioned above. We will be back testing this throughout 3 types of trading vehicles, namely, EURUSD for forex, US30(DJI) for stocks and BTCUSD for cryptocurrency. For simplicity, we will assume that all trades taken have a risk of 1% of the account.
Also read: Bat Pattern
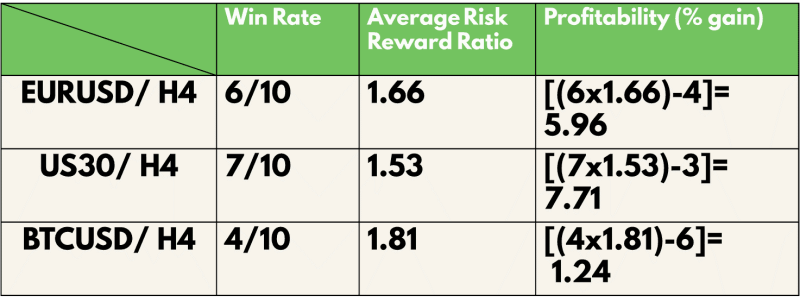
Definitions: Avg Risk reward ratio= ( Total risk reward ratio of winning trades/ total no. of wins) Profitability (% gain)= (no. of wins* reward)- (no of losses* 1) [ Risk is 1%]
An example of the application of the strategy is as shown:
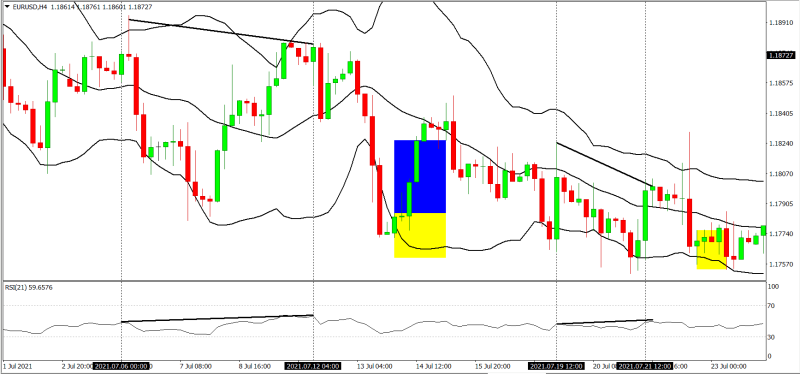
For the Backtest results, trades with blue and yellow zones indicate an overall win with the blue zone as reward and the yellow zone as the risk taken.
As shown in our backtest, the win rate of this strategy for EURUSD (Forex) is 60%, US30 (Stocks) is 70% and BTC (Crypto) is 40%
The average risk reward ratio of this strategy for EURUSD (Forex) is 1.66 US30 (Stocks) is 1.53 and BTC (Crypto) is 1.81.
The profitability of this strategy for EURUSD (Forex) is 5.96, US30 (Stocks) is 7.71 and BTC (Crypto) is 1.24.
Conclusion
In conclusion, the Bollinger bands divergence trading strategy is a all rounded strategy that performs well not only in a trending market but also in a sideways one. This is due to the characteristic of the Bollinger bands in the strategy that will minimise losses and still make small wins in side way markets. This strategy is able to generate profitable results with generally good win rate and risk reward ratio. On top of that, its ability to filter out bad trades is an important asset for beginners, allowing a more steady growth in account size over time. However, it still requires the knowledge of price action trading to fully maximise its potential. Also, the Bollinger band squeeze may often fake traders out by appearing to be expanded and then contracting back to its original state once again. Thus, the foundation in price action reading is extremely important for beginners to grasp to avoid various forms of fake outs. Ultimately, the Bollinger band divergence trading strategy is a stable strategy that proves to be reliable in its own way.
Info