
Using technical indicators while trading is one of the most convenient ways of improving your trading results. While technical indicators are sometimes complex, we simplify them in a way that allows you to understand the concept behind technical indicators.
In this article, we discuss what the TRIN indicator is, how it is calculated and how to use it to improve your trading results.
Also read: How Do You Trade With A Volatility Indicator?
Contents
- What is the TRIN Indicator?
- How to Calculate the Arms Index (TRIN)
- Understanding the Arms Index (TRIN)
- How to use the Arms Index While Trading
- Limitations of Using the TRIN Indicator
- Conclusion
- FAQs
What is the TRIN Indicator?
To begin with TRIN is an acronym for short-term trading index. TRIN is an oscillator which measures market volatility by comparing the relationship between advancing and declining issues and advancing and declining volume of a specific commodity/security.
Simply put, it helps traders understand supply and demand by illustrating clearly when an asset’s price is within or over the overbought or oversold conditions. These in turn helps trades predict future price movements. Ideally, when an assets price is volatile it illustrates significant activity in the stock market and thus presents a ripe opportunity for trading. These two factors make the TRIN indicator a strong technical analysis tool especially for intraday traders.
The TRIN indicator was developed by Richard Arms in the year 1987. For this reason, it is commonly referred to as the Arms Index. Richard was trying to determine the relationship between the price increase or decrease and the increase and decrease in total volume of a specific asset. The result was the arms index which turned out to be a very reliable trading instrument.
While the TRIN breadth indicator can be used to trade forex, futures and stocks, it mostly popular in various stock markets eg: NASDAQ and New York Stock Exchange (NYSE). It is one of the most popular indexes among other indices such as the TRICK index for trading stocks.
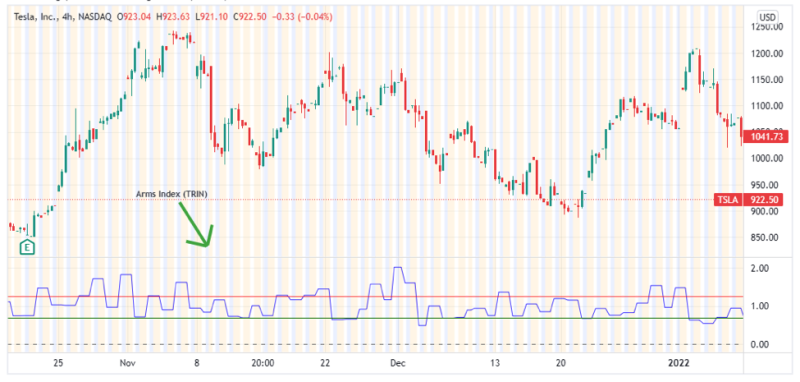
Below is an image of the TRIN indicator as it appears on the Tesla Stocks chart, on the NASDAQ stock exchange in Trading View.
How to Calculate the Arms Index (TRIN)
While it is not essential for you to calculate the short-term trading index (TRIN) especially while trading, understanding the calculation of the arms index is essential to understanding how it works. To calculate TRIN follow the steps below:
- Calculate the ratio of advancing stocks to declining stocks.
- Calculate the ratio of advancing volume (up volume) to declining volume (down volume).
- Finally, calculate TRIN by divide the ratio of advancing stocks to declining stocks by the ratio of advancing volume to declining volume.
The formula for calculating the arms index (TRIN) is:

Understanding the Arms Index (TRIN)
To begin with A TRIN value of one implies that the market is at a balance as the ratio of advance/decline stocks is equal to the ratio of advance/decline volume. When this happens, the market is said to be neither overbought not oversold.
It is important to note that unlike most oscillators, TRIN readings usually appear in an inverse manner as higher values suggest that most traders are selling while lower values suggest that most traders are buying.
TRIN readings of below one suggests a strong bullish market move as a result of strong advancing issues which are greater than the declining issues therefore driving prices to rally. Additionally, analysts found out that if the long-tern index reading was below one it could be a confirmation of a bullish long-term bias. When the TRIN readings are below 0.5 constantly, the market is considered overbought and hence could lead to a bearish reversal.
Conversely, TRIN readings of above one implies a strong bearish move as a result of the declining issues being greater than advancing issues. The long-term index reading of above one suggests a bearish sentiment of the stock market. When the TRIN readings are above 3.00 consistently, the market may be said to be in the oversold levels and hence could serve as a signal for a bullish reversal.
Sometimes the TRIN values will not get to the above-mentioned extremes; the 0.5 and 3.00 values respectively. When this happens, it is up to you as a trader to figure out the extremes over a specific time period and use them to identify overbought and oversold levels of a specific underlying asset.
Also Read: Complete Guide To The Williams Alligator Indicator
How to use the Arms Index While Trading
There are three major ways you can use the Arms Index (TRIN) to generate trade signals. Typically, the TRIN indicator is a leading indicator hence can be used to provide buy signals, sell signals, or even reversal signals.
To begin with, an arms index reading of below one will serve as a buy signal. This is because the advancing volume is greater than the advancing stocks and the declining volume is greater than the declining stock.
Secondly, an arms index of above one will serve as a sell signal. This is because the advancing volume is less that the advancing issues and subsequently the declining volume is less than the declining stock.
Finally, extreme readings of above 3.00 and below 0.5 serve as reversal signals. A reading of above 3.0 implies that a stock is oversold and hence a bullish reversal is imminent, while a reading of below 0.5 implies that a stock has been overbought hence a bearish reversal is imminent.
Limitations of Using the TRIN Indicator

While the arms index (TRIN) is very effective especially in identifying buy and sell signals through confirming trends, it faces the limitation of measuring volatility, which is also a crucial element before entering a trade. However, market analysts worked around this limitation by considering the 10-day moving average for the TRIN values.
Additionally, the TRIN indicator may be misleading in a situation where the advancing volume in the advancing issues is less than expected. For example, there are instances where the advancing stocks are twice as declining stocks and twice as much advancing volume as declining volume during a bullish market action. If this happens, the TRIN value will be one suggesting a balanced market, while it is not the case.
To work around this inaccuracy, traders usually separate the TRIN indicator to two different components. A trend to show the advancing/declining stocks and a trend to show the advancing/declining volume. Typically, analysts’ advice combining the TRIN indicator with other technical indicators to avert these limitations and allow for better results.
Conclusion
To sum it all up, when the Up volume/Down volume ratio is higher that the Advancing/Declining issues ratio the TRIN indicator value will be less than one while when the Advancing/Declining volume Ratio is less than the Advancing/Declining issues ratio the TRIN indicator value will be more than one.
A reading below one indicates a bullish market direction while a reading above one indicates a bearish movement. Additionally, extreme readings signify either a bullish or bearish reversal depending on the value. As the TRIN indicator is a leading indicator, it is popular especially among intraday traders as it clearly illustrates overbought and oversold conditions of the stock market.
While the information contained in this article is useful when using the arms index or rather the TRIN indicator, it should not be considered as investment advice.
FAQs
What is the TICK volume indicator?
The TICK indicator is a breadth indicator or index that compares the ratio of up stocks and down stocks to the total volume to determine the market sentiment/direction at any particular period. It is popular among day traders who trade stocks in various stock markets such as NASDQ and NYSE.
What does TRIN indicate?
Simply put, the TRIN index indicates the strength of an assets price in the stock market. Essentially, it helps traders identify short-term overbought or oversold market conditions. TRIN values are derived from dividing the AD ratio of stocks by the AD ratio of volume.