

The reverse head and shoulders pattern is a well-known trend reversal indication. However, trading this chart pattern can be challenging for most traders. Most traders miss the opportunity to enter the market at the proper time, not because there is a “secret” to trading this pattern. Any trading strategy's most important component is timing, which is crucial when looking for chances on the charts.
This post will explain how to detect the inverse head and shoulders pattern on a stock price chart and how to trade it successfully.
Also Read: What is Strategy Tester?
Contents
- What Is The Inverted Head And Shoulders Pattern?
- Inverse Head and Shoulders Formation
- How To Trade This Pattern
- Target Price And Pattern Height
- The Drawbacks of An Inverse Head and Shoulders
- Bottom Line
- FAQs
What Is The Inverted Head And Shoulders Pattern?
The inverted head and shoulders pattern reflects a bullish trend reversal pattern. Its visual representation on the chart, which consists of two higher lows on either side of a lower peak in price movement in the center, gives rise to its name. It also resembles a head and shoulders design that has been turned on its side.

The inverse head and shoulders pattern often closes off a downward price trend on a chart. You can already see the first shoulder forming and the downward momentum diminishing. When the price action penetrates the left shoulder and descends, the head is then formed. Finally, there is a rebound followed by a retest of the right shoulder lows, which shouldn't result in a lower low.
Inverse Head and Shoulders Formation
The indicator is the inverse head-and-shoulders pattern. This pattern signals a price trend reversal in the negative direction. One of the more typical reversal indications is this one.
A low point (a trough) is reached as the price travels back downward, after which it rebounds and swings upward. Then, due to market opposition, it falls once more into a trough.
Left Shoulder Vs. Right Shoulder
Price falls until the market can no longer accept lower prices, at which time it starts to rise once more. Price declines one last time as a result of market opposition once more. The price does not drop to the previous low if the market cannot support a lower price. Before prices start to increase again, this results in a higher low. The left shoulder, head, and right shoulder all experience troughs, or low points, resulting from this movement.

Right shoulder Left shoulder Head Neckline Same distance between the neckline and the head Long entry prevents loss Trading the inverse head and shoulders involves setting a take suitable profit target that is the same distance from the neckline to the head.
During this pattern, two rallies or pullbacks will take place. One follows the left shoulder, and the other follows the head. These pullbacks' high peaks are connected to a trendline that juts out to the right. The neckline or “resistance line” is the name of this trendline.
What Happens When The Reversed Head And Shoulders Pattern Occurs?
Even though anything might happen following an inverted head and shoulders pattern, you need to observe a significant increase in stock prices for the pattern to be successful. As the stock's price continues upward on momentum and breaks out from the neckline, the volume should rise.
Despite this, a retest of the head and shoulders pattern's top range may occur. It is usual for stocks to move back into a consolidation zone to retest supply and demand levels. Prices will probably increase once more as long as demand still exceeds supply.
Gauge the move in accordance with the depth of the original pattern if you are scalping the pattern. You can collect profits once you hit your target on the breakout. To add back any sales you may have made for a bigger move, wait for the pattern's retest if you wish to hold for a bigger move.
You wil see two different trend movements and retracements occur during this pattern. One occurs after the left side shoulder, and one after the head. The high points of these pullbacks connect with a trendline, which extends out to the right. This trendline is called the “neckline” or “resistance line”.
How To Trade This Pattern
Since the inverse head and shoulder patterns form bottoming patterns when it completes its cycle. You should focus on buying or holding long positions (owning the stock). The pattern completes when the price rallies higher than the pattern’s neck line or breaks the resistance line.
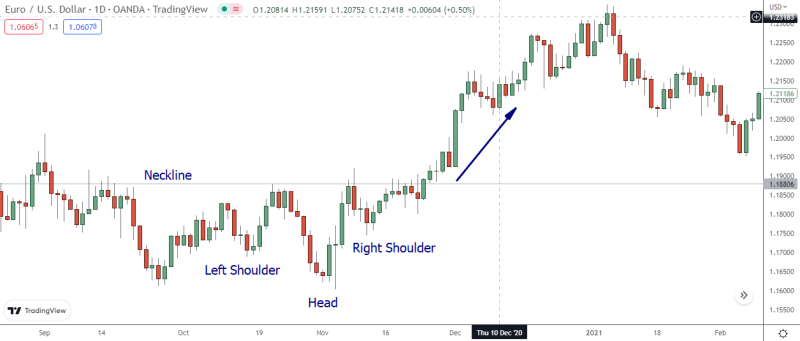
On the pictured chart, the price rallies over the neck line following the right-hand shoulder. Traders call this a breakout, and it signals a completion of inverse head and shoulder pattern.
Traditionally, you would trade the pattern by entering a long position when the price moves above the neckline. You would also place a stop-loss limit below the right shoulder’s low point.
The neckline works well as an entry point if the two pullbacks (the short intervals in the trend) of the pattern reached similar price zones, or the second pullback hit slightly lower compared to the first.
If the right-hand shoulder is above the first, the trendline will angle upwards and therefore won’t provide a good entry point (it’s very high). In such a case, buy or enter long while the price rallies above the high of the second pullback level (between the head at the bottom and the right shoulder).
Target Price And Pattern Height
Based on the size of the pattern, chart patterns offer price objectives or a rough range of where the price might go. The high price of the retracements can be subtracted from the head's low price. You now have the pattern's height.
For instance, if the retracement high was $2,063.50 and the head low was $2,059.50, the pattern's height would be four ($2,063.50 – $2,059.50 = 4).
To determine a profit target, multiply the breakout price by the height. The goal price will be $2,067.25 if the breakout price is $2,063.25. Price targets are just intended to be a general guide; they do not guarantee that the price will reach the objective or that it will halt rising when it gets close to the target.

Concentrate on trading strategies that, depending on the objective and stop loss, offer trades with a reward-to-risk ratio greater than 2:1. If the stop loss were set at $2,063, which is slightly below the right shoulder, the goal would be 4 points above the entry price. The stop would be 3.25 points away.
The trade doesn't have a great reward-to-risk ratio, but the chart pattern nevertheless demonstrates a change from a short-term decline to a short-term upswing. More advantageous threat ratios for trading are produced by patterns where the low of the right shoulder lands considerably above the low of the head.
Also Read: How To Read Candlesticks Like A Pro
The Drawbacks of An Inverse Head and Shoulders
Like all charting patterns, the head and shoulders pattern's ups and downs reveal a clear narrative about the conflict between bulls and bears.
The initial decrease and subsequent peak signify the prior negative trend entering the first shoulder part as it gains speed. Bears attempt to push the price back down through the initial trough following the shoulder to reach a new low in an effort to prolong the bearish momentum as long as possible (the head). Bears might yet regain market control and push the negative trend on.
However, it becomes obvious that bulls are making progress as the price increases again and reaches a level above the previous peak. Bears make one more attempt to drive the stock lower but can only reach the slightly lower low from the original dip. The price moves upward and completes the reversal when it fails to surpass the lowest low, signaling the bears' loss and the triumph of the bulls.
Bottom Line
The inverse head and shoulders pattern occurs at the end of a downtrend. Three lows are shown on the chart, separated by two retracements. The pattern is complete when the price advances above the neckline or second retracement high and offers a potential purchase point.
Traditionally, you would employ a stop-loss, price it just below the right shoulder, and set a target based on the pattern's height multiplied by the breakout price. If the trade doesn't offer a reward-to-risk ratio greater than 2:1, the pattern nevertheless offers valuable information by demonstrating the change from a negative trend to an upward trend.
FAQs
What Do an Inverted Head and Shoulders Mean?
The inverse head and shoulders chart is supposed to forecast a bearish-to-bullish trend reversal and signifies the conclusion of a downward trend. Investors regard it as one of the most accurate patterns for trend reversals.
Is Inverted Head and Shoulders Bullish?
A bullish reversal pattern is the Inverse Head-And-Shoulder pattern. This indicates that the price movement and trend before the emergence of this pattern were negative. The inverse head-and-shoulder pattern frequently manifests itself near the base of a market movement.
Is Inverse Head and Shoulders Bearish?
The inverse head and shoulder is a bullish trend reversal pattern. It forms following a bearish market (left shoulder). The head forms at the bottom of the chart. The price reverses for a bullish move from the head and creates the right shoulder.
What Invalidates an Inverse Head and Shoulders?
The head-and-shoulders pattern is invalidated if the right shoulder forms, then break before the neckline does.
Do I Need In-depth Training Programs to Learn Inverse Head and Shoulder Trading Strategy?
Regular and inverse head and shoulder patterns are as easily understood and reliable as trend reversal patterns. All you need is to scroll back to the chart, look for relevant patterns, and track the price reactions following the formation of the chart pattern.


