In the world of technical analysis, candlestick patterns play a vital role in predicting future market movements. Among these, the homing pigeon pattern stands out as a significant indicator of potential market reversals. Whether you're a novice trader or an experienced investor, understanding how to trade the homing pigeon pattern can enhance your trading strategy and improve your profit targets. This article will delve into what the homing pigeon pattern is, how to identify it, and how to trade it effectively.
What is the Homing Pigeon Pattern?
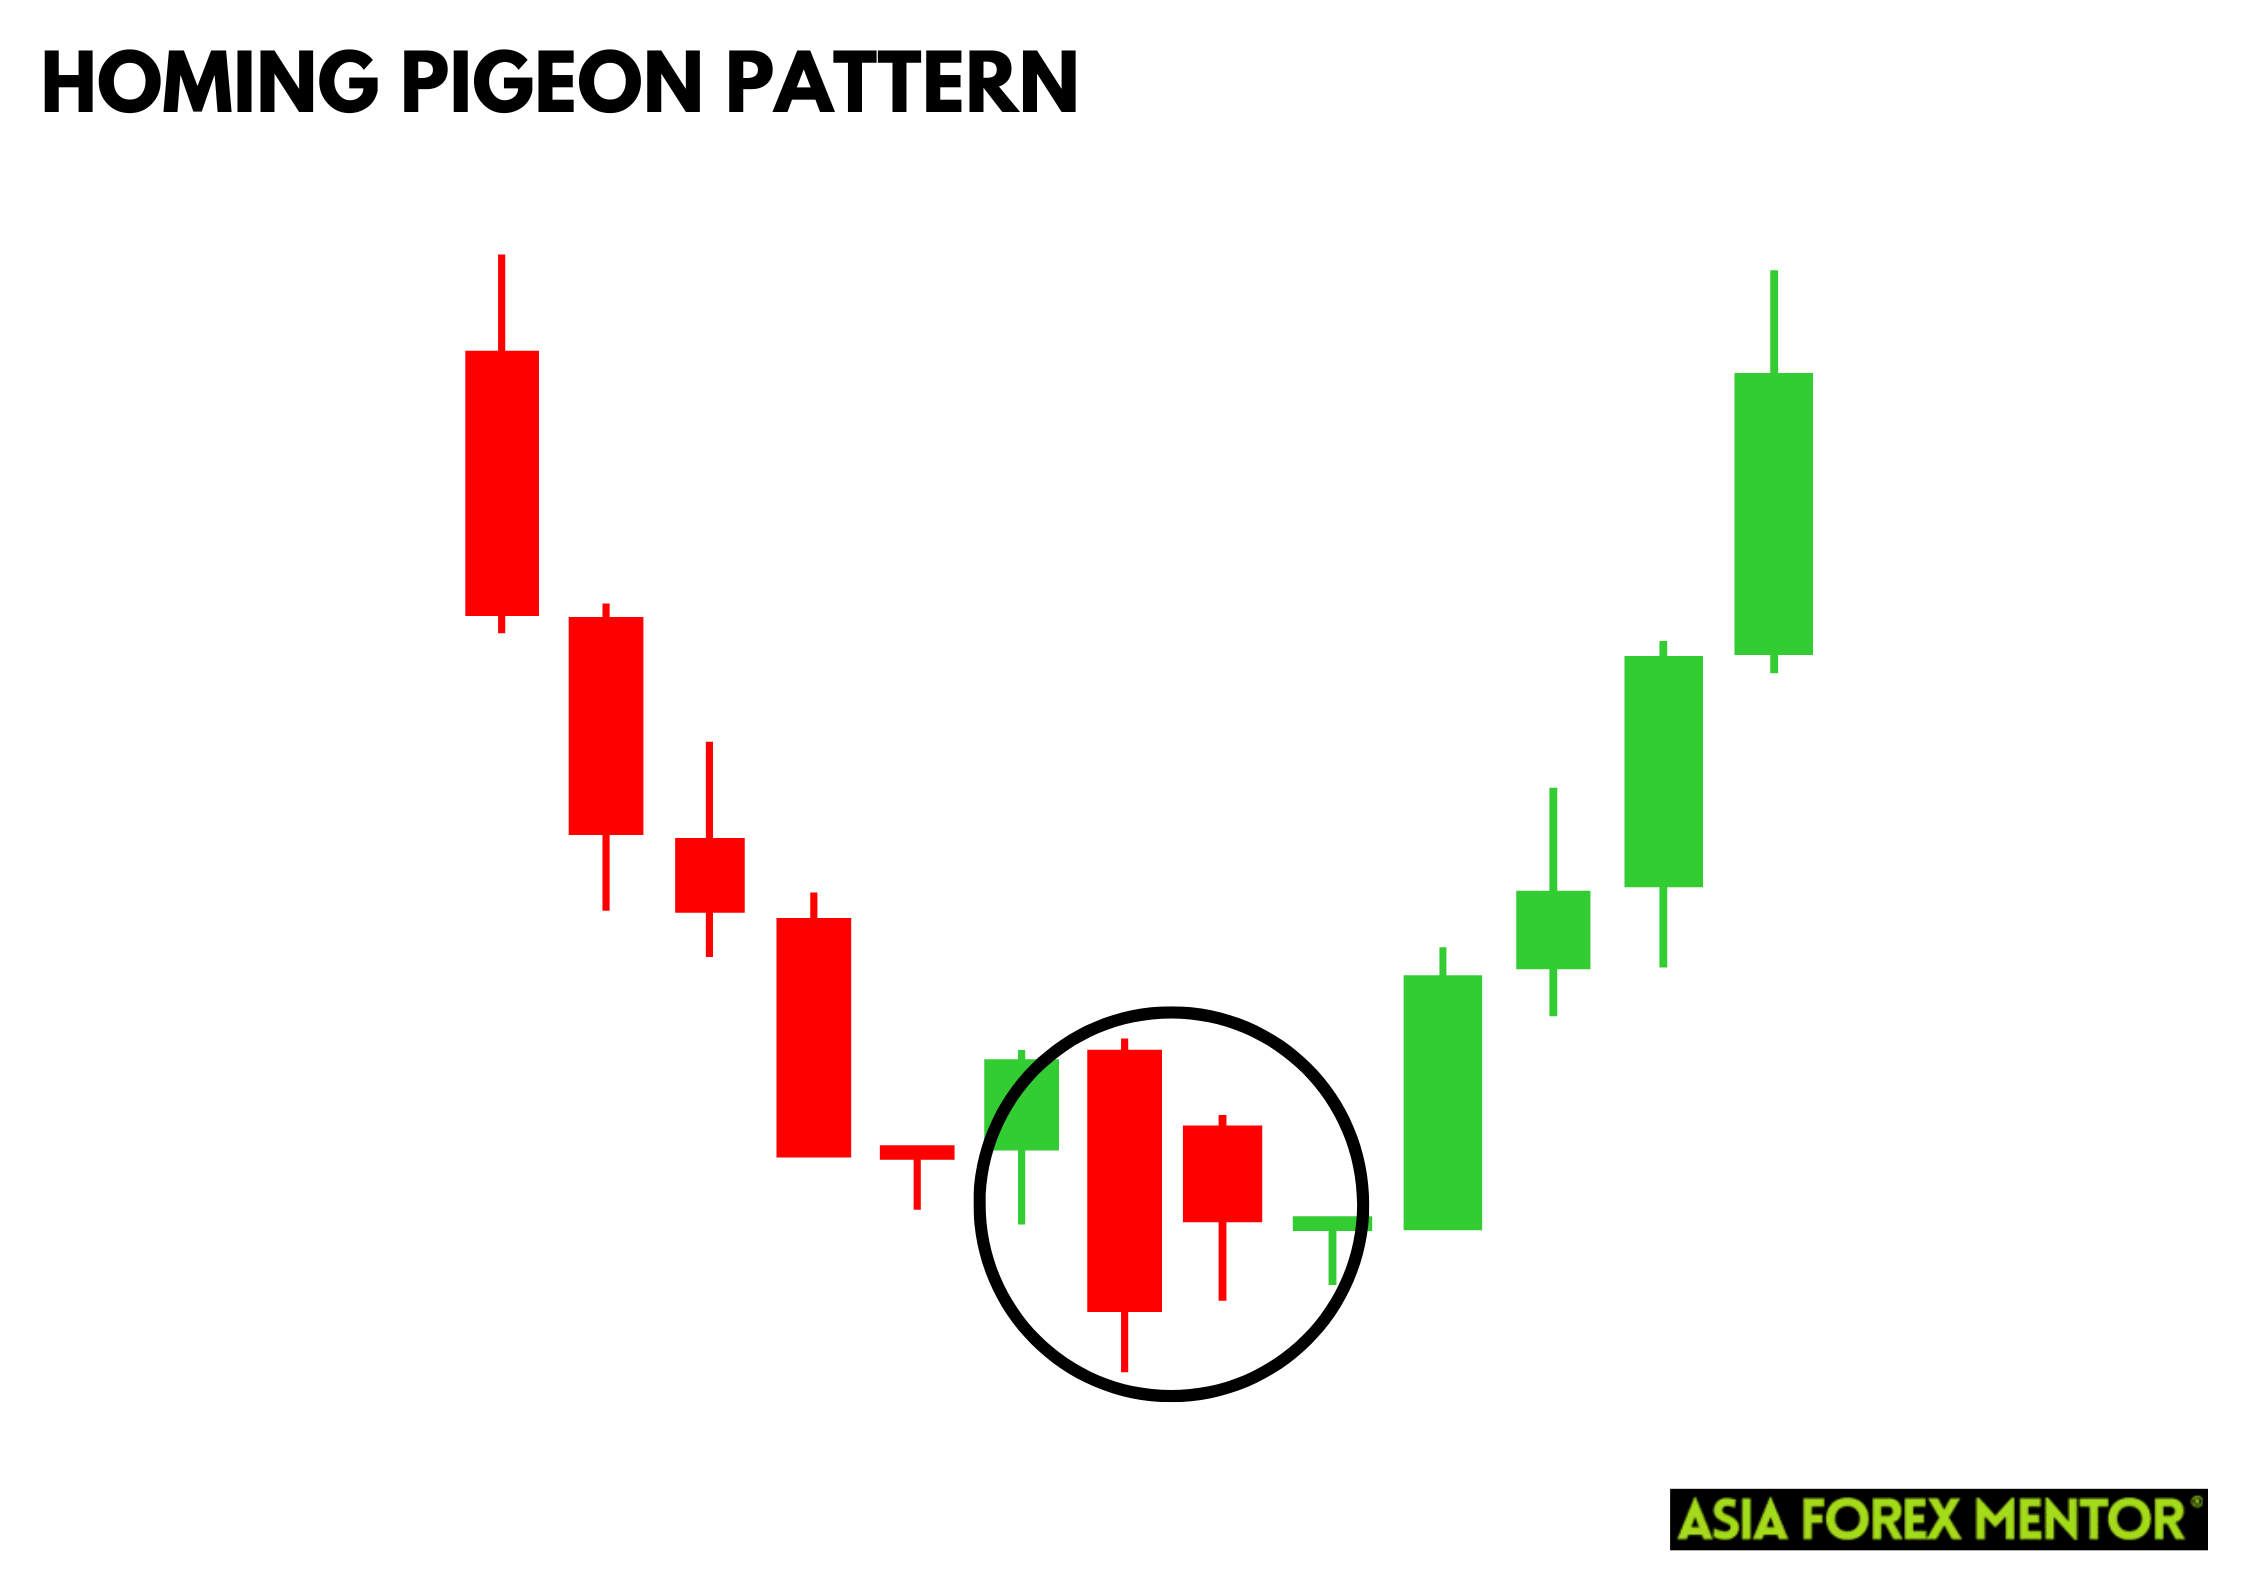
The homing pigeon pattern is a candlestick pattern that signals a potential reversal in the current trend. It consists of two candles and typically appears at the bottom of a downtrend. This pattern suggests that the bearish momentum is weakening, and a bullish reversal may be on the horizon. However, it is important to note that the homing pigeon pattern can also be interpreted in a bearish context, indicating a possible continuation of the downward trend. The homing pigeon pattern is similar to the bullish harami pattern but has its unique characteristics that can signal either a bullish or bearish sentiment depending on the market context.
Also Read: The 28 Forex Patterns Complete Guide
What is the Bullish Homing Pigeon Pattern?
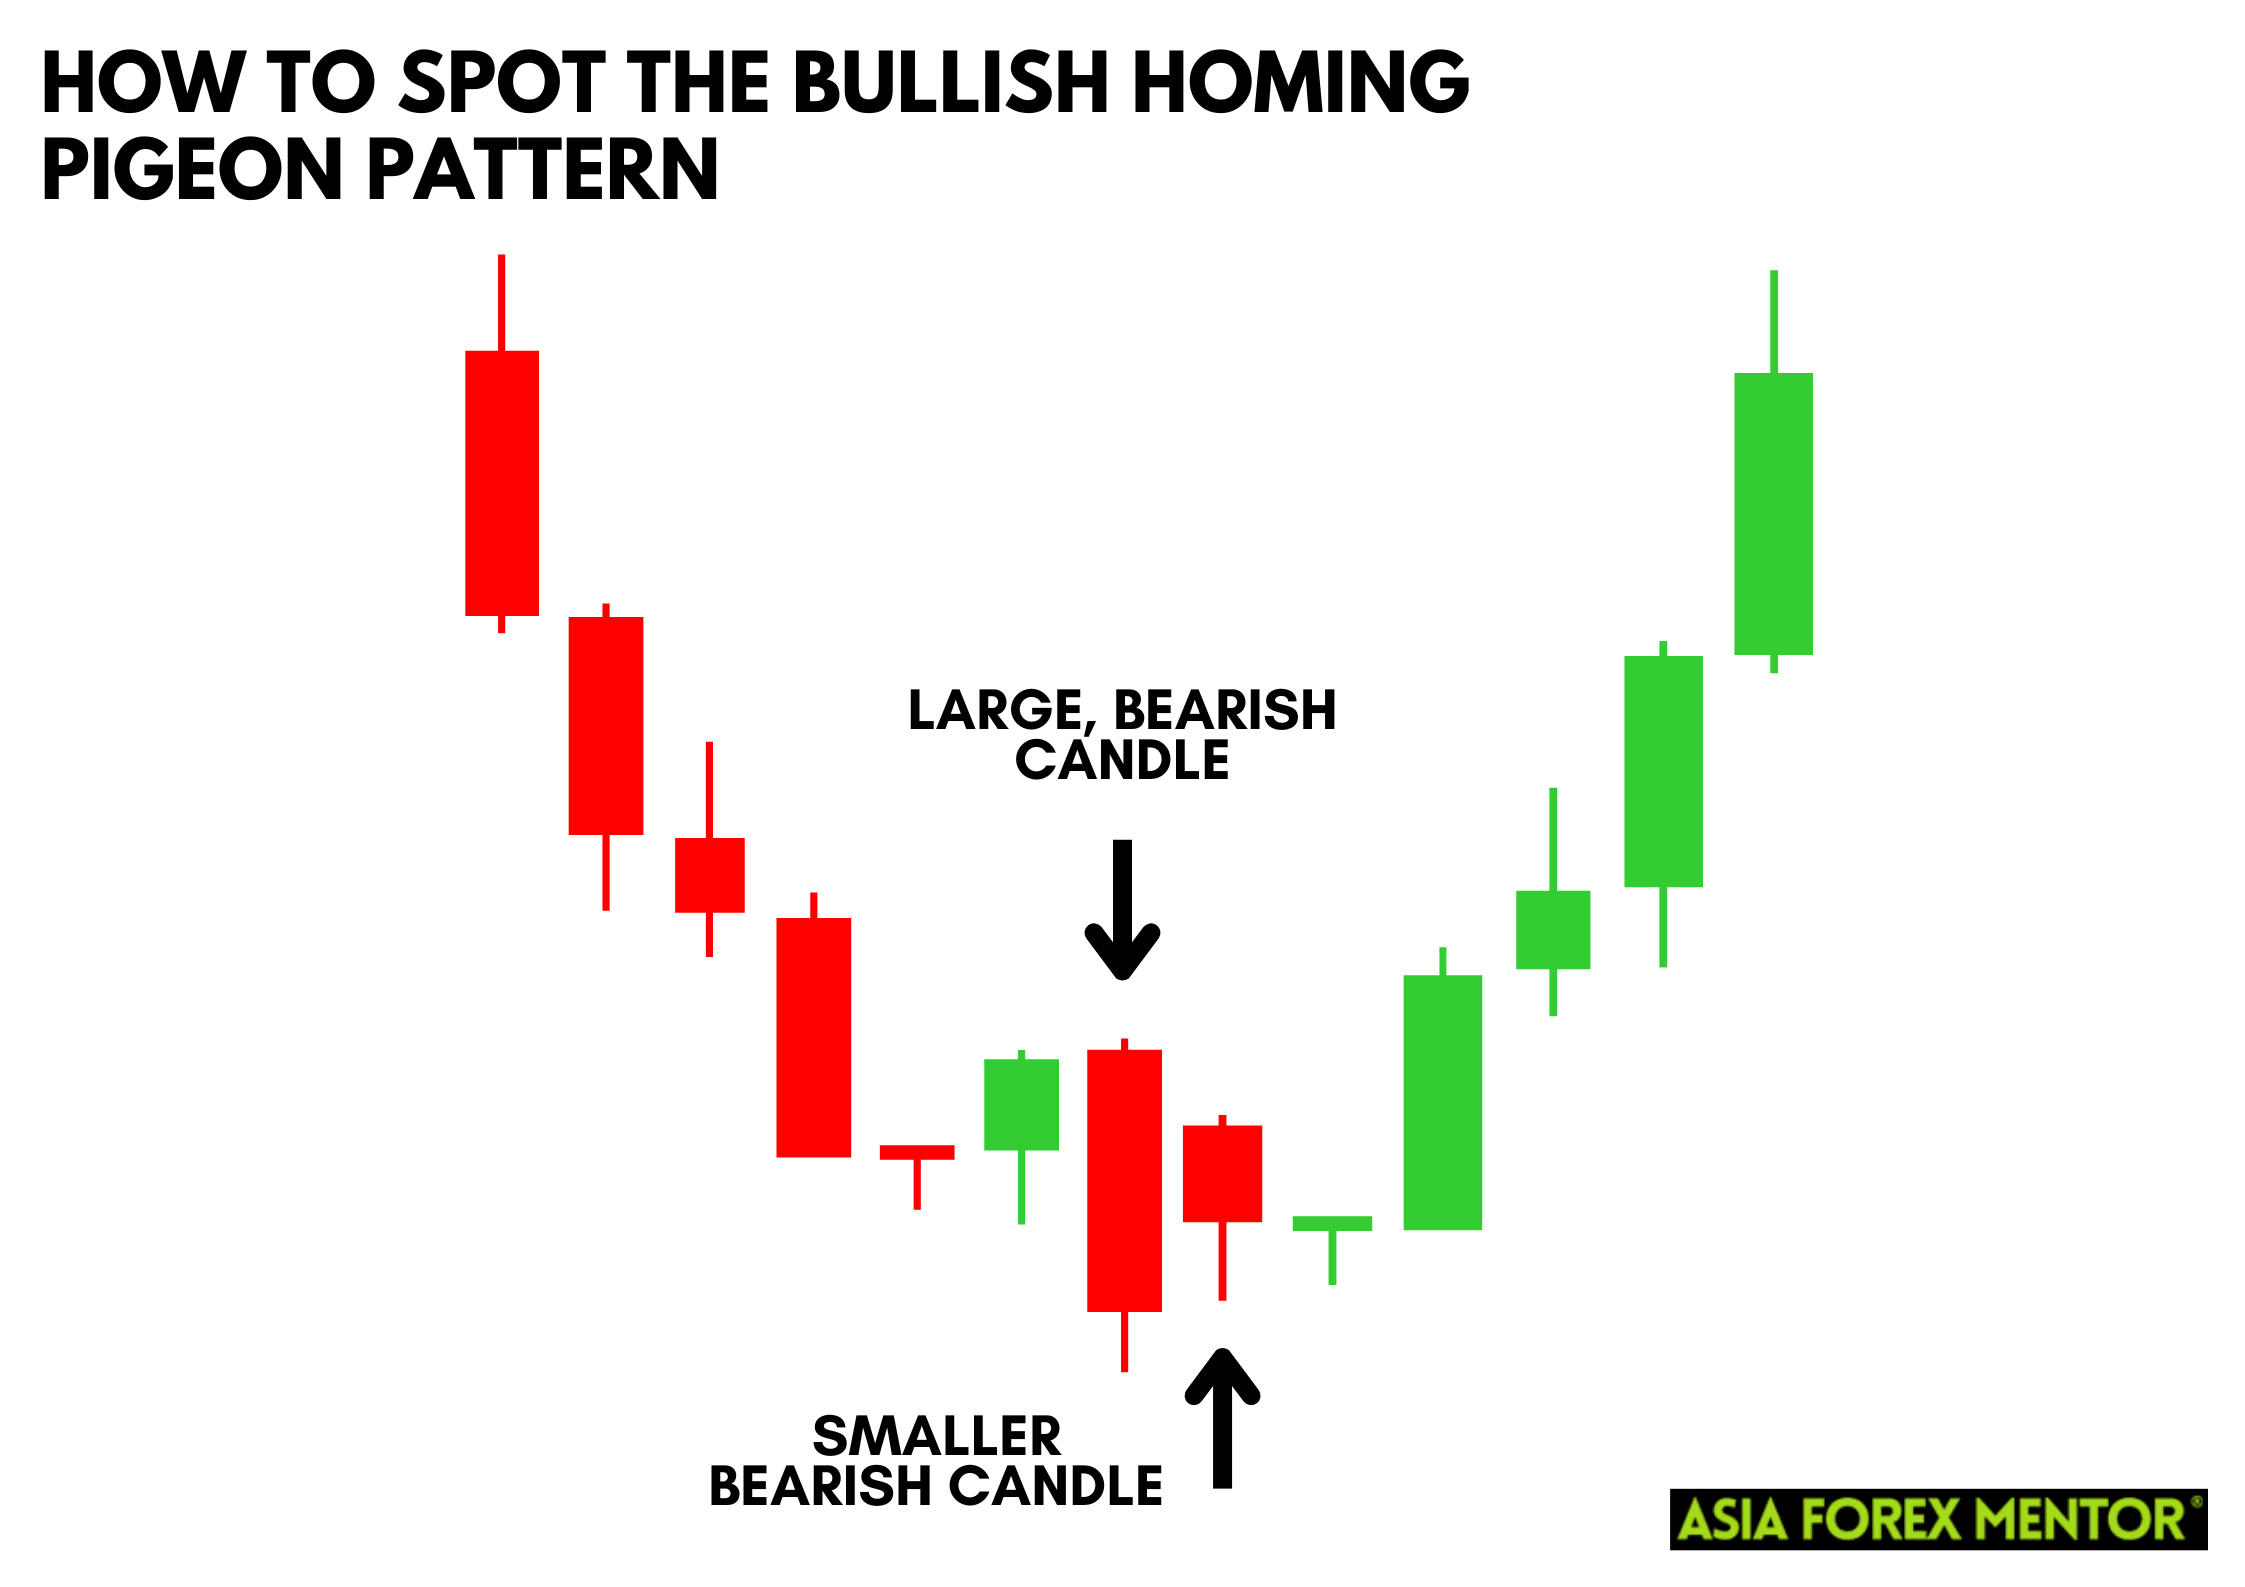
The bullish homing pigeon pattern is a specific type of homing pigeon pattern that indicates a potential upside reversal. It forms when two bearish candles appear consecutively, with the second candle closing within the body of the first candle. This pattern suggests that the selling pressure is diminishing, and a bullish trend reversal might be imminent.
How to Spot the Bullish Homing Pigeon Pattern
Spotting the bullish homing pigeon pattern involves examining the candlestick chart closely. Look for a downward trend followed by two bearish candles. The first candle is a large bearish candle, and the second candle is a smaller bearish candle that closes within the body of the first candle. This formation indicates a weakening bearish trend and potential bullish reversal.
How to Trade the Bullish Homing Pigeon Pattern
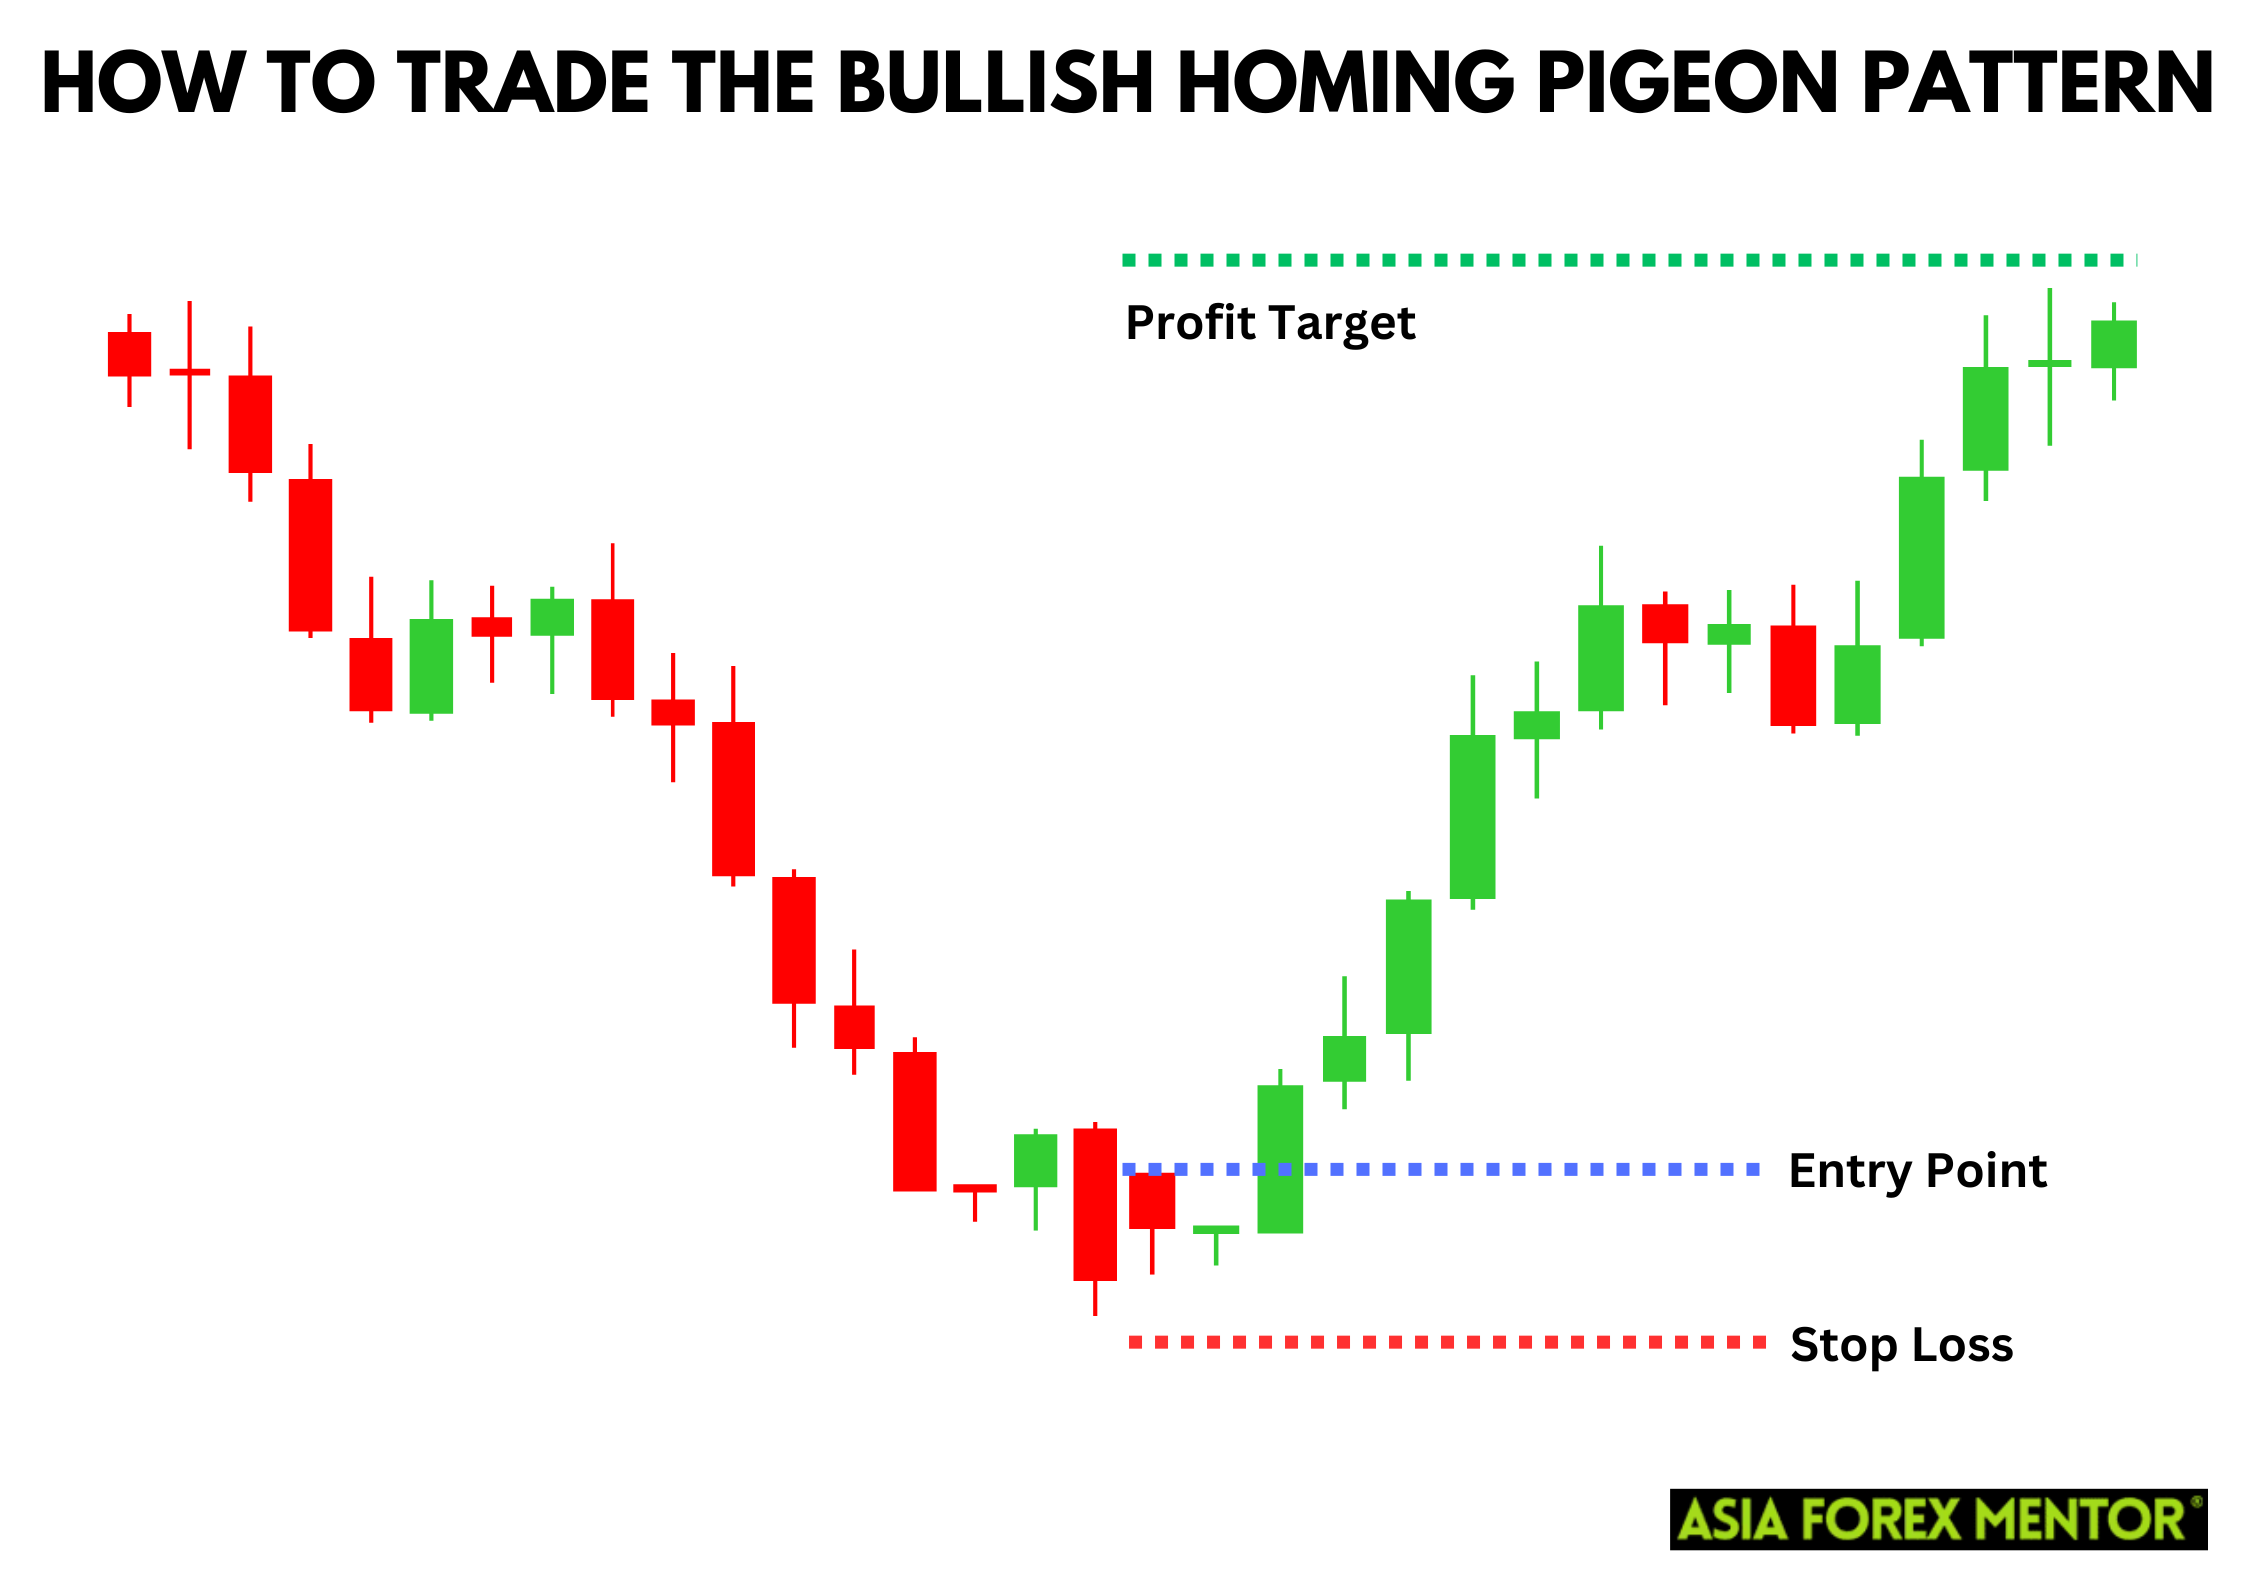
Entry Point
To trade the bullish homing pigeon pattern, enter a long position when the price breaks above the high of the first candle. This confirms the bullish reversal and signals the beginning of an upward trend. This entry strategy ensures you are capitalizing on the initial buying pressure that follows the confirmation candle, giving you a head start in a potentially profitable trade.
Stop Loss
Set your stop loss just below the low of the second candle. This protects your position if the pattern fails and the price continues to drop. By setting a tight stop loss, you minimize potential losses and ensure that you are risking only a small portion of your capital on each trade. This disciplined approach helps in managing market volatility and unexpected price movements.
Profit Target
Aim for a profit target that is at least twice the distance between the entry point and the stop loss. This ensures a favorable risk-reward ratio. For example, if your stop loss is $1 below your entry point, set your profit target at least $2 above the entry point. This strategy allows you to maximize potential gains while maintaining prudent risk management practices. Adjust your profit targets based on the market conditions and historical performance of the asset.
What is the Bearish Homing Pigeon Pattern?
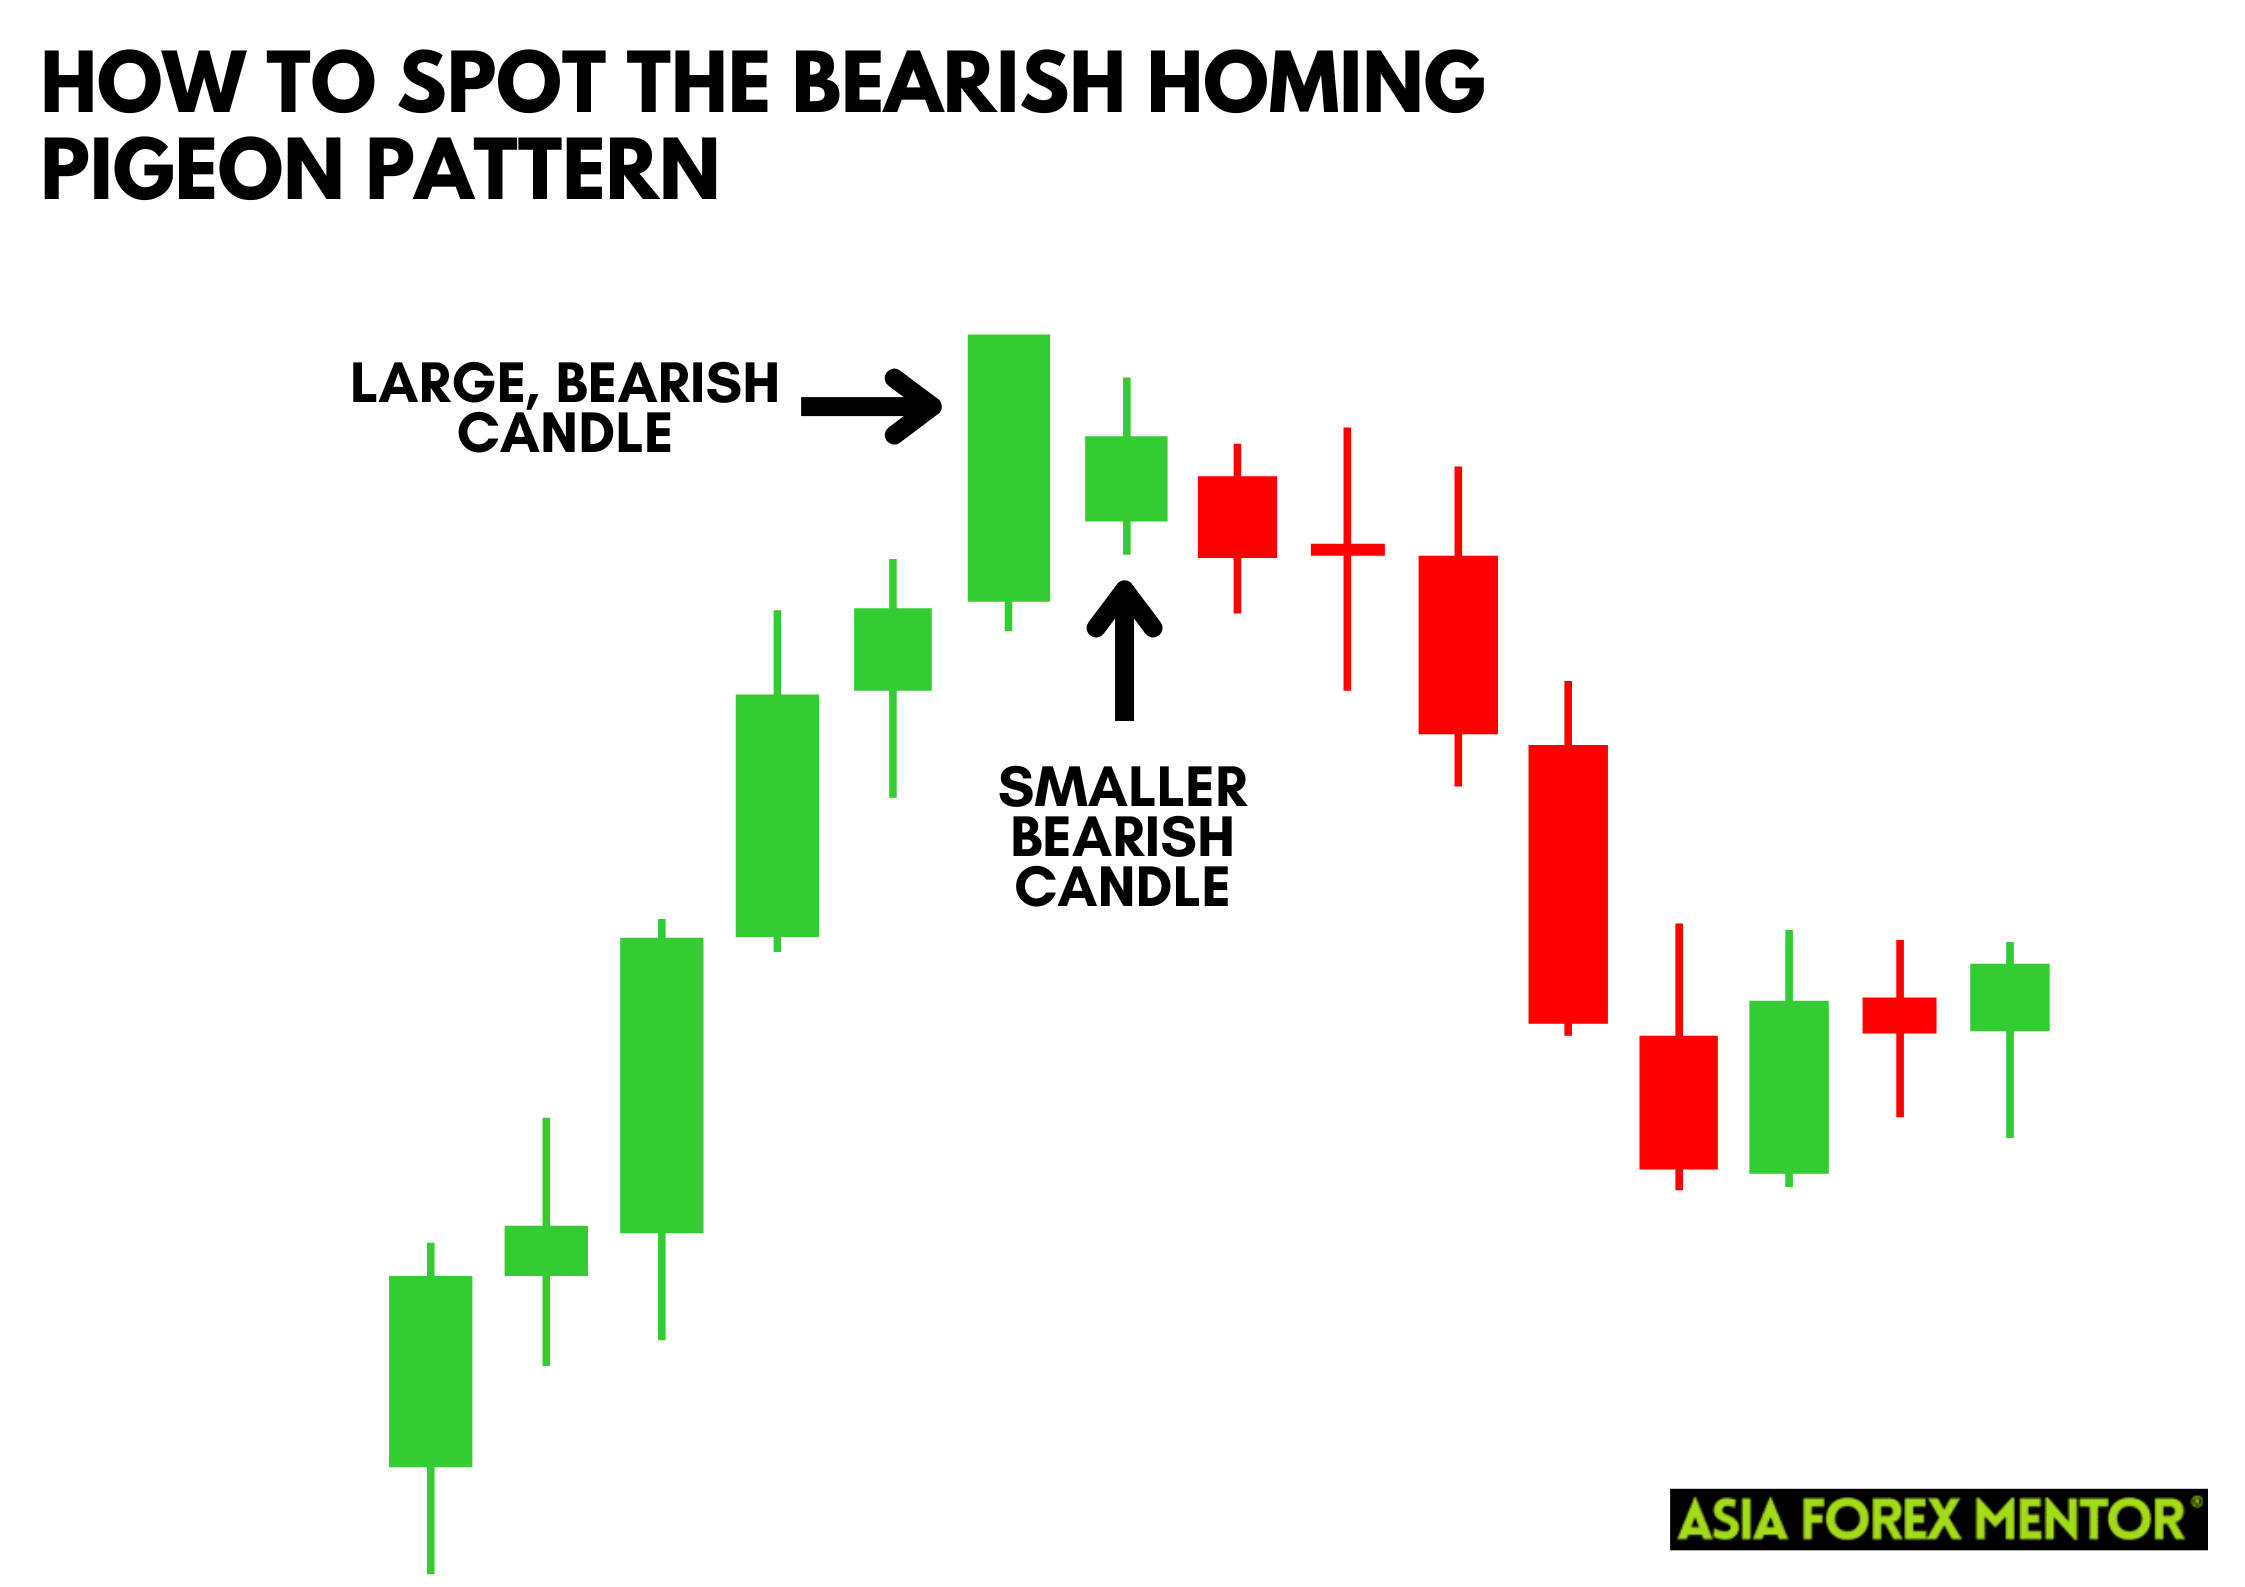
While the homing pigeon pattern is primarily bullish, it can also indicate a bearish continuation in some contexts. The bearish homing pigeon pattern suggests a brief pullback phase within a dominant bearish trend. It forms when the second candle, though smaller, still closes within the body of the previous candle but fails to signal a strong reversal.
How to Spot the Bearish Homing Pigeon Pattern
To spot the bearish homing pigeon pattern, look for a series of bearish candles during a downtrend. The second candle should close within the body of the first candle but not indicate a significant bullish reversal. This pattern suggests the downtrend may continue, highlighting the weakness in buying pressure and reinforcing the bearish sentiment.
How to Trade the Bearish Homing Pigeon Pattern
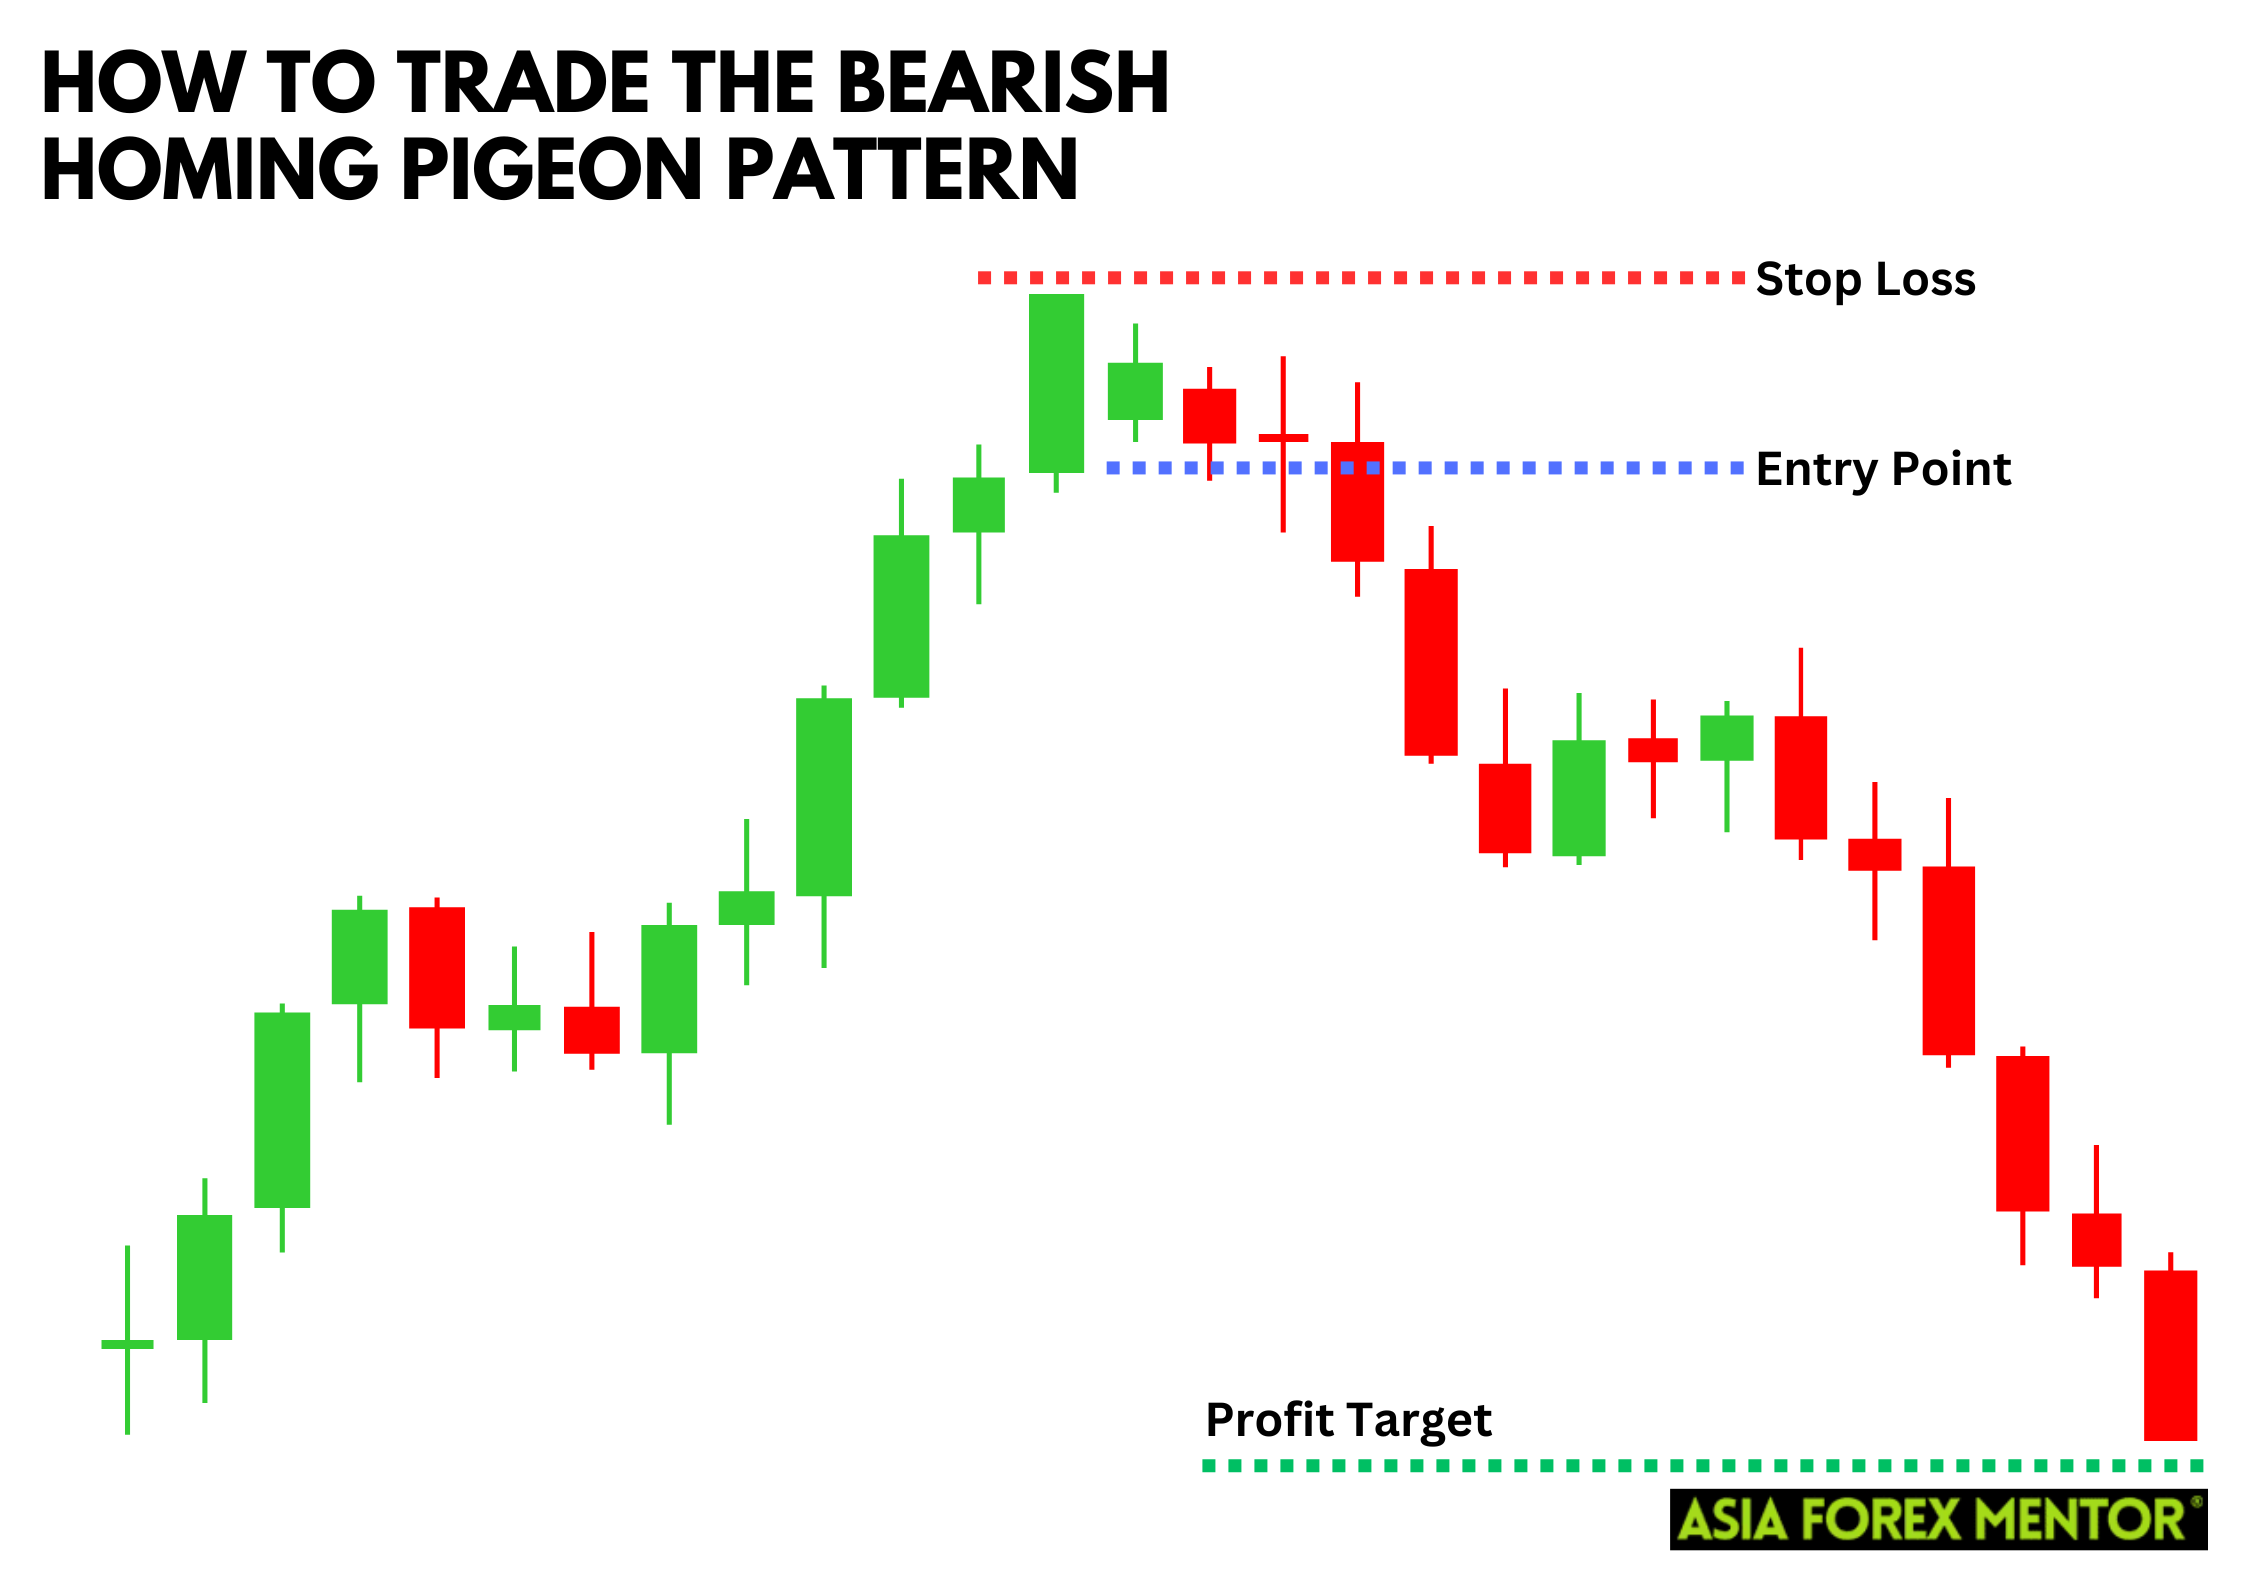
Entry Point
Enter a short position if the price drops below the low of the second candle. This confirms that the bearish trend is resuming. By waiting for this confirmation, traders can avoid premature entries and ensure that the bearish momentum is indeed continuing. This approach helps in aligning your trades with the overall market trend.
Stop Loss
Place your stop loss just above the high of the first candle. This protects your trade if the market moves against your position. By setting a stop loss at this level, you safeguard your capital from unexpected market reversals and ensure that your potential losses are contained within manageable limits. This practice is crucial for long-term trading success.
Profit Target
Set a profit target that is at least twice the distance between your entry point and stop loss. This helps to maximize your potential returns while managing risk effectively. For instance, if your stop loss is $1 above your entry point, set your profit target at least $2 below the entry point. Adjusting your profit targets based on market conditions and the asset's volatility can further enhance your trading strategy.
Pros and Cons of the Homing Pigeon Pattern
Pros
- The homing pigeon pattern is straightforward to spot on a candlestick chart.
- This pattern is reliable for indicating potential trend reversals.
- Applicable in stocks, forex, and other trading markets.
Cons
- Like all technical patterns, it doesn't guarantee future results.
- Often needs additional indicators for confirmation to avoid false signals.
Indicators to Use to Confirm the Pattern
To increase the reliability of the homing pigeon pattern, use these indicators for confirmation:
- Moving Averages: Check if the price crosses above a significant moving average.
- Relative Strength Index (RSI): Look for RSI to exit oversold territory.
- Volume: Ensure there is an increase in trading volume as the pattern forms.
Conclusion
The homing pigeon pattern is a valuable tool in technical analysis, helping traders identify potential trend reversals. By understanding how to spot and trade both the bullish and bearish versions of this pattern, traders can enhance their strategies and improve their chances of success. Always remember to use additional indicators to confirm the pattern and manage your risk with appropriate stop loss and profit target levels.
Also Read: How to Trade the Unique Three-River Bottom Pattern
FAQs
What is the difference between the bullish harami pattern and the homing pigeon pattern?
The bullish harami pattern and the homing pigeon pattern are similar; however, the homing pigeon pattern consists of two consecutive bearish candles, while the bullish harami can involve any color candles, with the second candle being smaller and within the first candle's body.
Can the homing pigeon pattern appear in an uptrend?
Typically, the homing pigeon pattern appears at the bottom of a downtrend signaling a reversal. It is less common but can occasionally appear in pullbacks within an uptrend.
How reliable is the homing pigeon pattern?
The homing pigeon pattern is relatively reliable, but like all candlestick patterns, it is not foolproof. It works best when confirmed with other technical analysis tools such as moving averages, RSI, and volume analysis.