The bump and run pattern is a chart pattern used in technical analysis to identify potential trend reversals in financial markets. This pattern is especially useful in very fast moving markets and provides traders with a clear framework to make informed trading decisions. By understanding the distinct phases of this pattern and the trading strategies involved, traders can enhance their overall performance rank in the market.
What is the Bump and Run Pattern?
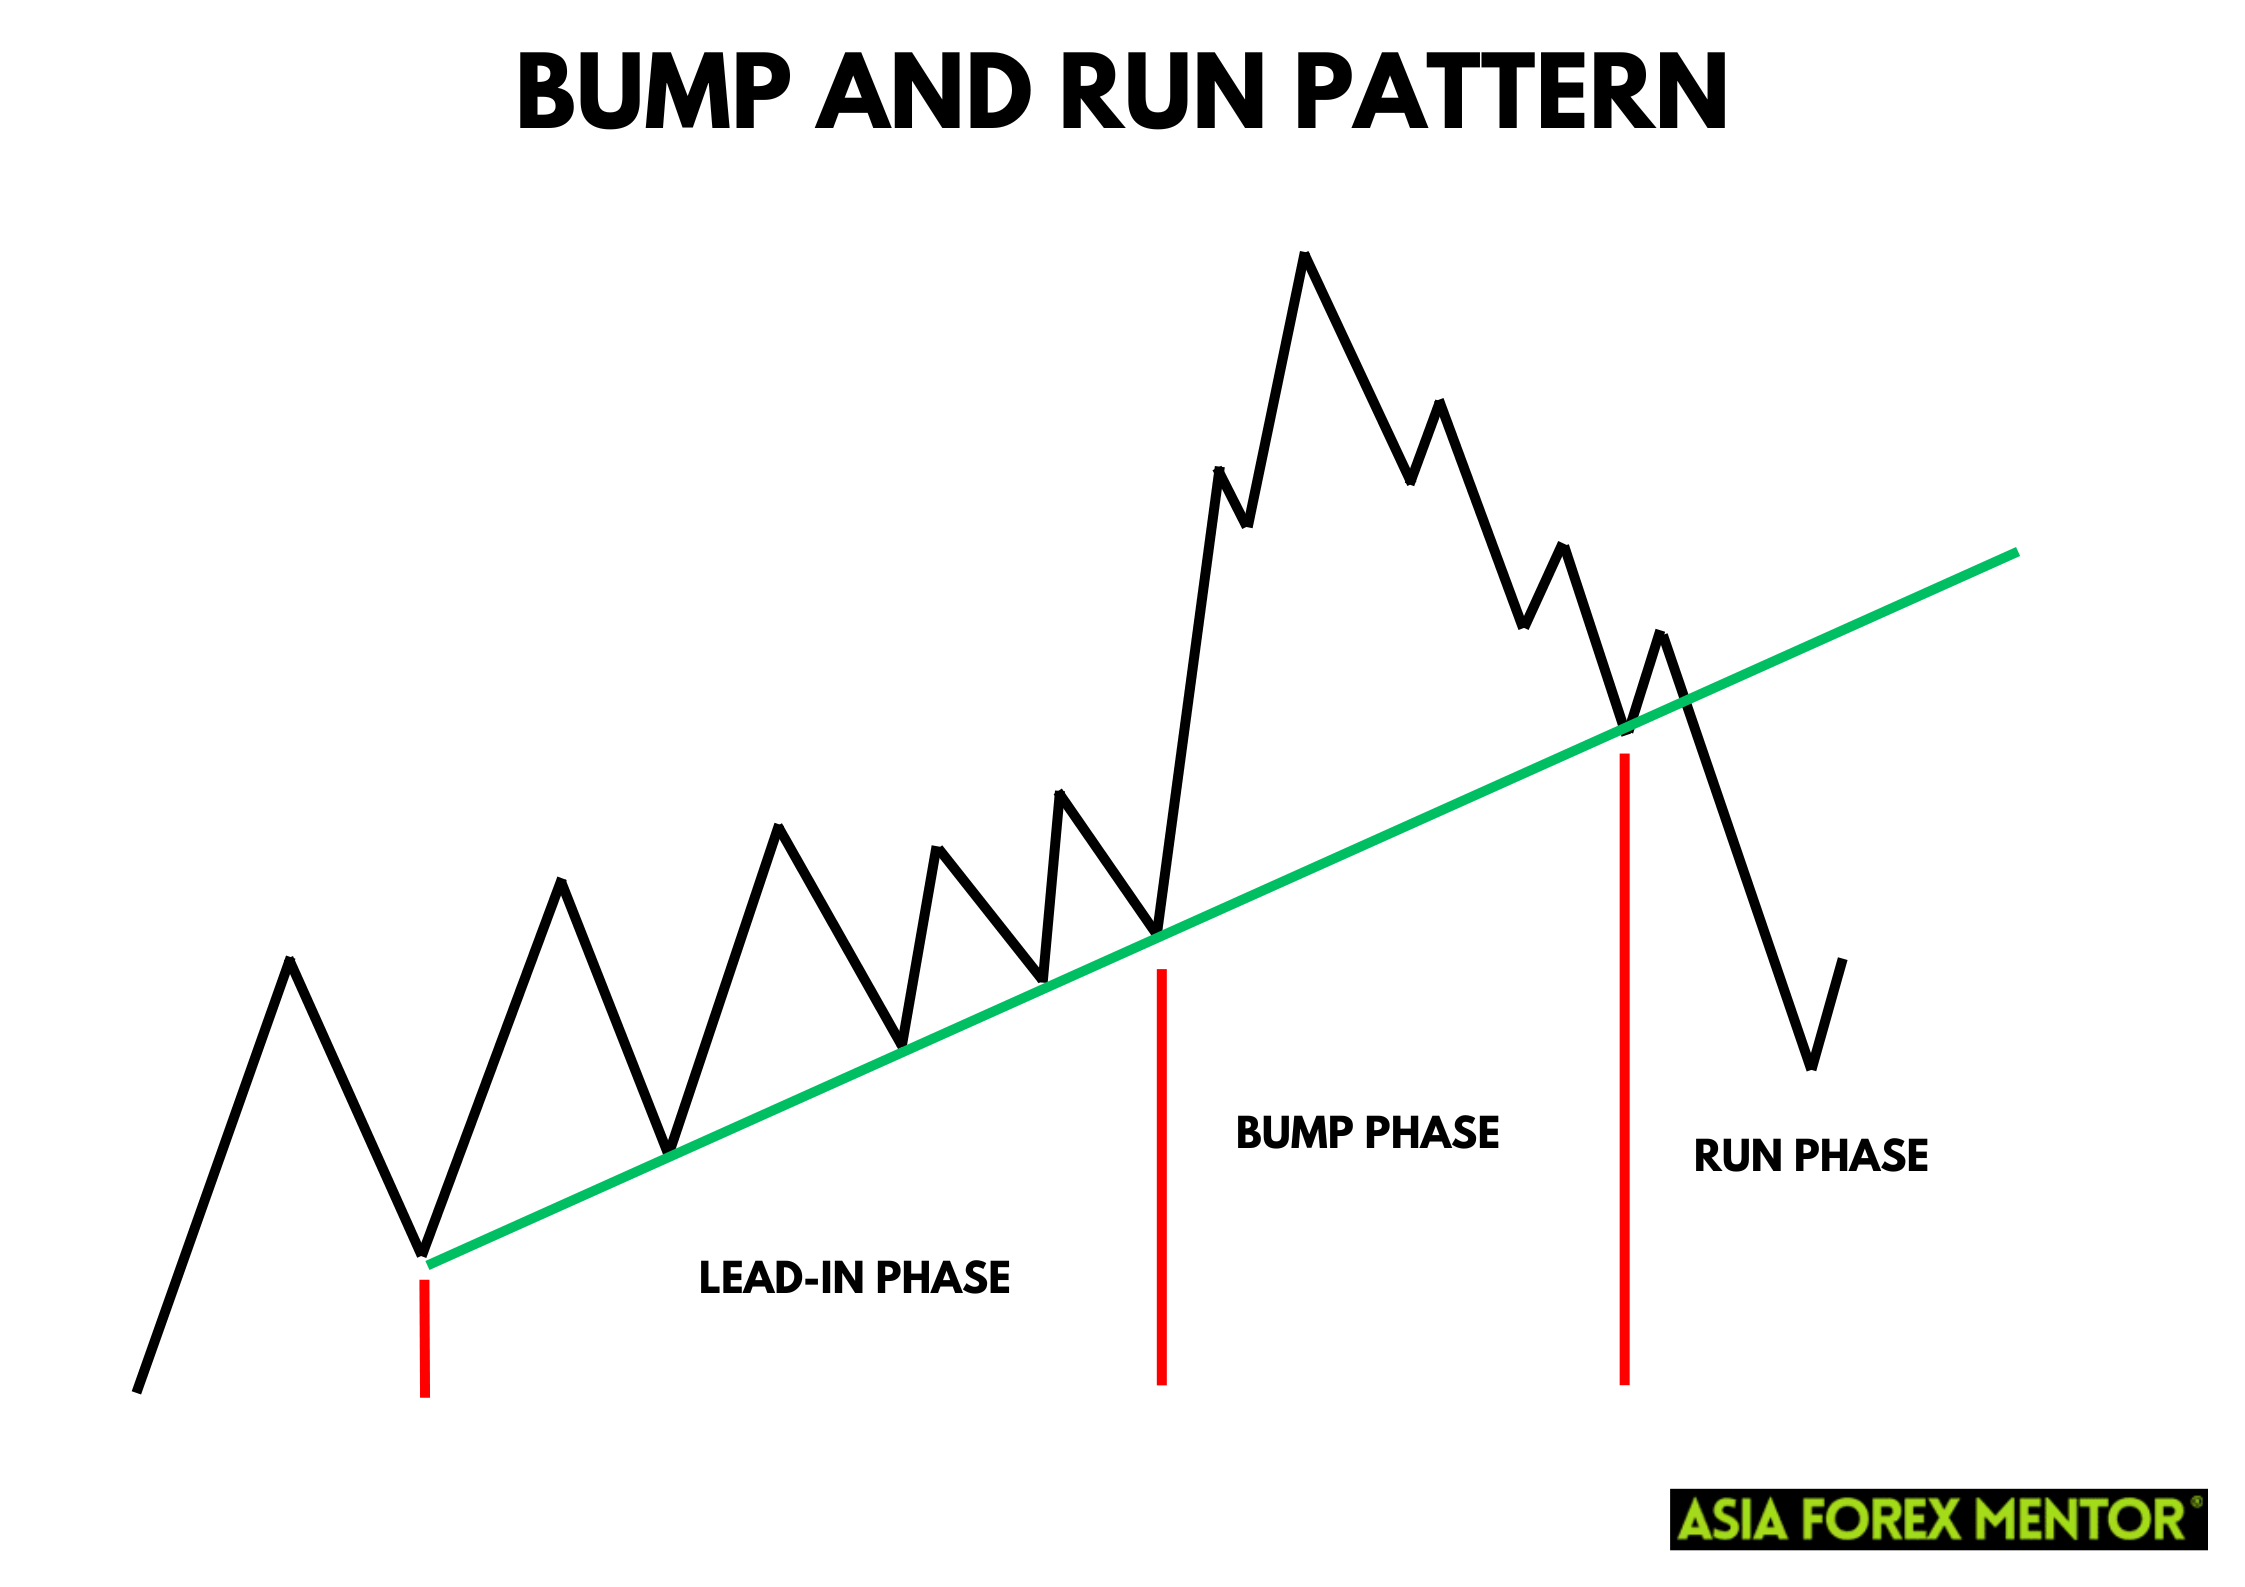
The bump and run pattern, also known as the bump and run reversal pattern, is a technical chart pattern developed by Thomas Bulkowski in 1996. It consists of three distinct phases: the lead-in phase, the bump phase, and the run phase. This pattern can indicate both bullish and bearish trend reversals, making it a versatile tool for traders.
Also Read: Mastering Japanese Candlestick Patterns
Lead-in Phase
The lead-in phase is characterized by a standard bullish trend or bearish trend with a moderate slope. The trendline formed during this phase is known as the lead-in trendline. This phase sets the stage for the bump phase, and the price action prior to the bump is crucial for identifying the pattern.
Bump Phase
The bump phase is marked by a large price hike or a rapid price drop, which deviates significantly from the preceding trend. This phase is driven by excessive speculation and strong buying pressure in a bullish pattern, or selling pressure in a bearish pattern. The bump pattern forms when the price action reverses direction after this sharp move, indicating a potential trend reversal.
Run Phase
The run phase begins when the price breaks the lead-in trendline, signaling a reversal. In a bullish bump and run reversal, the price rises after breaking the trendline, while in a bearish bump and run reversal, the price drops rapidly. This phase confirms the reversal and provides traders with an entry point for their trades.
How to Spot the Bump and Run Pattern
Spotting the bump and run pattern involves analyzing historical data and looking for specific price action characteristics. The pattern starts with the lead-in trendline, followed by the bump phase, and concludes with the run phase. Here are the steps to identify the pattern:
- Identify the Lead-in Trendline: Look for a trending stock with a moderate slope in its price chart.
- Spot the Bump: Look for a sharp price movement that deviates significantly from the lead-in trendline. Measure vertical distances to assess the bump height.
- Confirm the Run Phase: Identify the point where the price action reverses and breaks the lead-in trendline. This breakout point is crucial for confirming the pattern.
How to Trade the Bump and Run Pattern
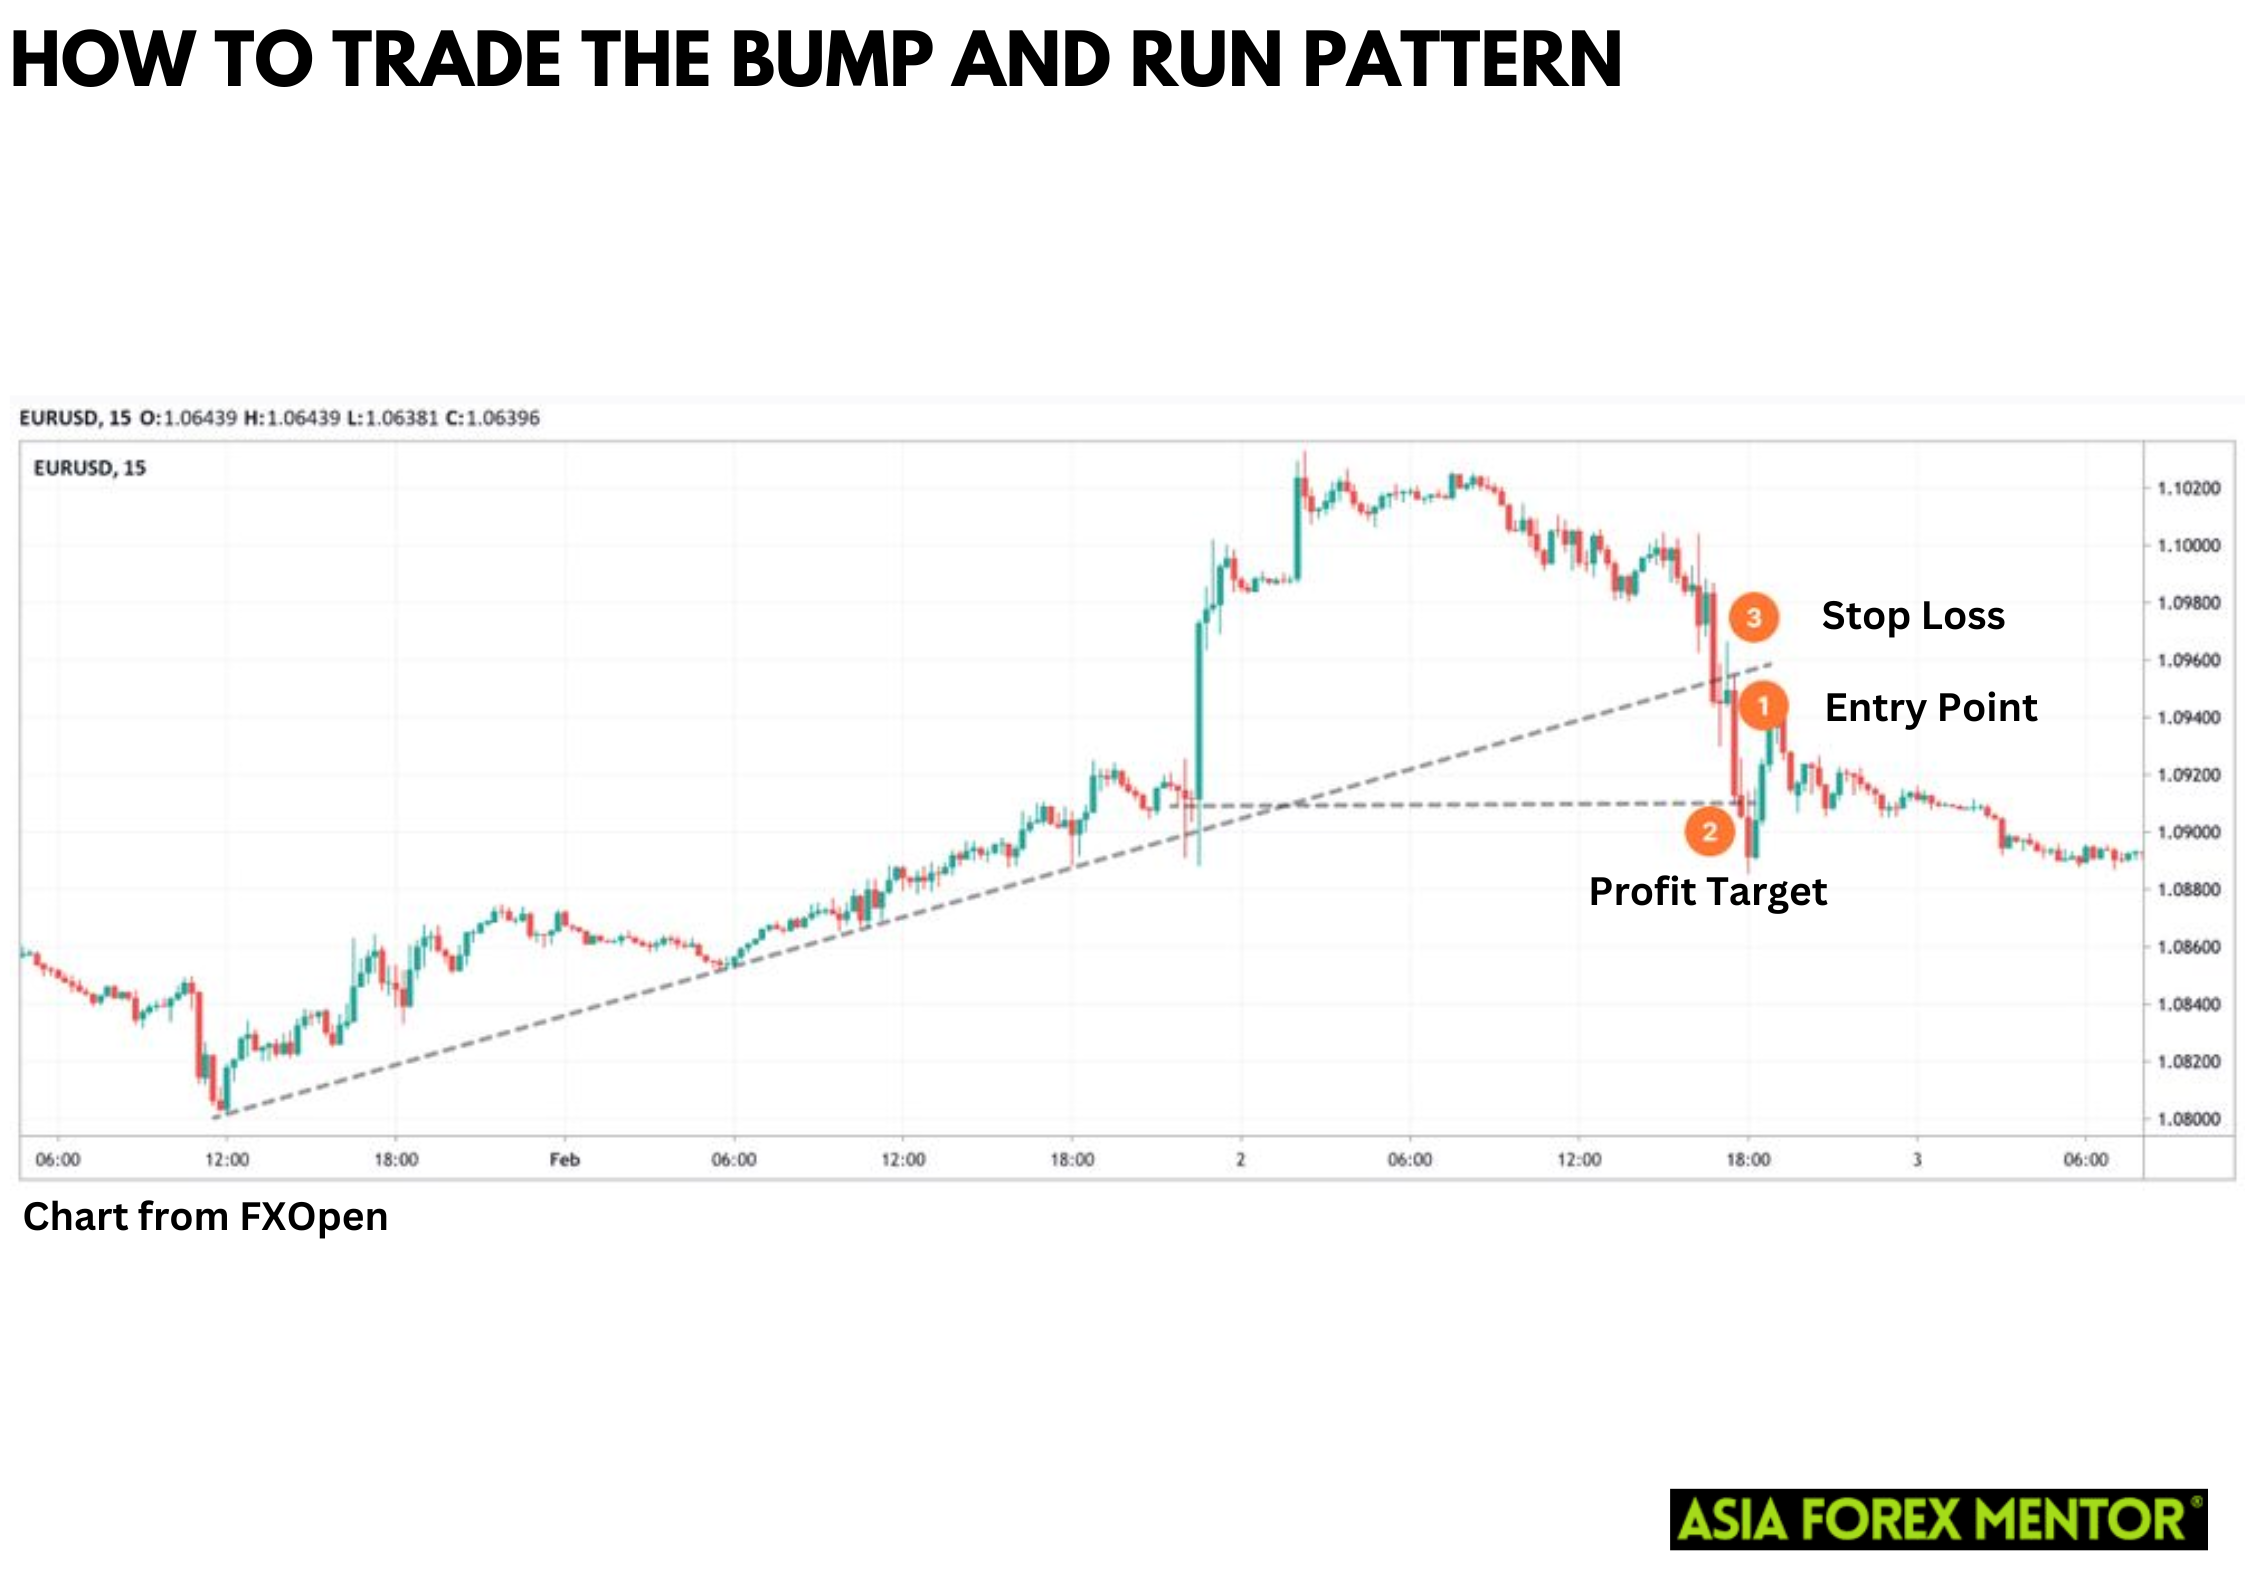
Trading the bump and run pattern involves specific strategies for entry, stop loss, and profit target. Here’s a step-by-step guide:
Entry Point
The entry point for a trade is when the price breaks the lead-in trendline during the run phase. Traders should wait for actual confirmation of the breakout before entering the trade.
Stop Loss
Set a stop loss level to manage risk. For a bullish bump and run, place the stop loss below the breakout trendline. For a bearish bump and run, place the stop loss above the breakout trendline.
Profit Target
The profit target should be set based on the vertical distance of the bump phase. This can be measured from the lead-in trendline to the peak or trough of the bump. This ensures a favorable risk-to-reward ratio.
Pros and Cons of the Bump and Run Pattern
Pros
- The pattern provides a clear visual representation of price movements
- It can be applied to various financial markets including stocks, commodities, and cryptocurrencies
- Works well in very fast-moving markets due to its quick identification and execution
Cons
- Identifying and trading the pattern accurately requires experience and practice
- There is a risk of false breakouts, leading to potential losses
Indicators to Use to Confirm the Pattern
Using technical indicators can help confirm the bump and run pattern. Key indicators include:
- Volume Indicators: Increased volume during the bump phase can confirm the strength of the move.
- Moving Averages: Help identify the trend direction and potential breakout points.
- Relative Strength Index (RSI): Indicates overbought or oversold conditions, providing additional confirmation for the reversal.
Conclusion
The bump and run pattern is a powerful tool in technical analysis, offering traders a structured approach to identify and trade potential trend reversals. By understanding the pattern's phases and employing effective trading strategies, traders can improve their success rate and overall performance rank.
Also Read: How to Trade the Fry Pan Bottom Pattern
FAQs
What is the best time frame to use for the bump and run pattern?
The bump and run pattern can be used on various time frames, but it is most effective on daily or weekly charts to capture significant price movements.
Can the bump and run pattern be used for all financial markets?
Yes, the bump and run pattern can be applied to stocks, forex, commodities, and cryptocurrencies, making it a versatile tool for traders.
How do I minimize the risk when trading the bump and run pattern?
To minimize risk, use a favorable risk-to-reward ratio, set appropriate stop loss levels, and confirm the pattern with technical indicators before entering a trade.