In the fast-paced world of financial markets, day trading stands out as a strategy where traders buy and sell financial instruments within the same trading day. This approach seeks to capitalize on small price movements, often within minutes or even seconds. Unlike longer-term investment strategies, day trading requires a high level of focus, quick decision-making, and a nuanced understanding of market dynamics.
One of the pivotal tools in a day trader's toolkit is indicators. These are statistical measures that provide insights into market trends, price volatility, momentum, and other crucial aspects of asset behavior. Correctly used, indicators can significantly enhance trading performance by offering buy and sell signals, as well as risk management cues. Failing to employ these can leave one essentially trading in the dark, guided only by intuition and luck—both unreliable allies in this arena.
In this article, we will embark on a comprehensive exploration of the best indicators for day trading. From the foundational types like Moving Averages and Relative Strength Index (RSI) to the nuances of combining multiple indicators for more robust decision-making, this guide aims to be an invaluable resource for Forex traders and investors. Whether you're new to day trading or looking to refine your strategy, this article will equip you with the insights you need to navigate the turbulent waters of intraday trading more effectively.
The Basics of Day Trading Indicators

In Forex trading, an indicator is a mathematical formula that interprets price, volume, or open interest data. These technical indicators are plotted on charts to help traders analyze past price action and forecast future movements. They are very important in technical analysis. They range from simple constructs like moving averages to complex algorithms.
The role of indicators is essential in trading decision-making. They help identify trends, signal potential reversals, and suggest optimal entry and exit points. For instance, a Moving Average can show the trend direction, while the Relative Strength Index (RSI) can indicate overbought or oversold conditions. Using indicators, traders can make informed decisions, reduce risk, and improve profitability. These tools are vital for success in Forex day trading.
Types of Indicators

Moving Averages
A Moving Average smooths out price data to create a single flowing line, which makes it easier to identify the direction of a trend. One example is the Moving Average Convergence Divergence (MACD), a trend-following momentum indicator. Traders often use two moving averages and look for points where these lines cross to identify entry and exit points. In a bullish trend, a shorter-term moving average crossing above a longer-term moving average could signal a good entry point.
Relative Strength Index (RSI)
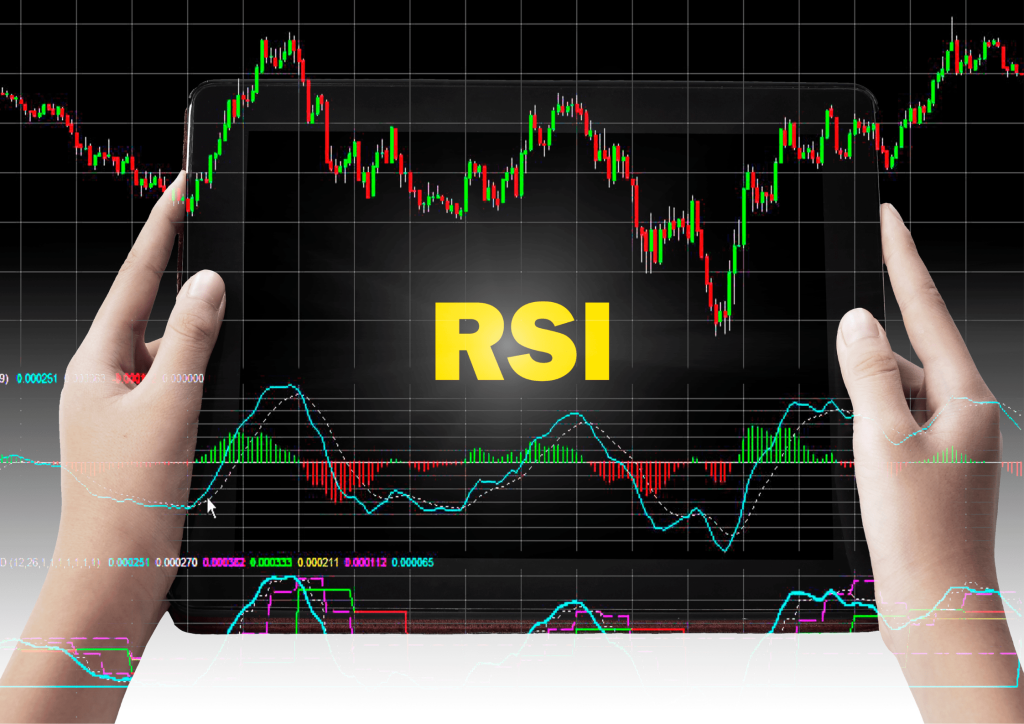
TheRelative Strength Index (RSI) is crucial for identifying overbought or oversold conditions. Generally, an RSI value above 70 indicates an asset might be overbought, while below 30 suggests it might be oversold. Traders use these levels to foresee potential reversals in price action.
Bollinger Bands
Bollinger Bands are another important tool for analyzing price volatility. The bands consist of a middle band, usually a moving average, and two outer bands calculated based on standard deviation. When the bands are close, it indicates low volatility, and when they are far apart, it signals high volatility. Traders often use Bollinger Bands to identify breakout opportunities.
Volume
Finally, trading volume is often overlooked but serves as a useful indicator. A sudden increase in trading volume can confirm a trend's strength, while low volume may indicate a lack of conviction among traders. One example is the On-Balance Volume (OBV) technical indicator. Volume analysis can provide crucial insights, especially when used in conjunction with other indicators.
These types of indicators offer valuable data points for making informed trading decisions. Each comes with its own set of strengths and weaknesses, and the most successful Forex traders often use a combination to enhance their trading strategies.
Also Read: The RSI Forex Indicator Complete Guide
Using Indicators for Decision Making

After understanding the types of indicators, the next logical step is to explore how to employ them effectively in your trading decisions.
Buy and Sell Signals
Indicators offer valuable buy and sell signals. For instance, when a short-term Moving Average crosses above a long-term Moving Average, it often signals a good time to buy. Conversely, if it crosses below, it could be a sell signal. The RSI, too, can serve as a signal: below 30 might be a buy, above 70 a sell.
Risk Management
Equally important is risk management. Indicators can help set stop-loss or take-profit levels. For example, you could set a stop-loss below a support level identified by Bollinger Bands. This approach helps you mitigate losses and protect your investments.
Combining Indicators
Using multiple indicators can offer more robust trading signals. However, this comes with both benefits and pitfalls. The advantage is that it can confirm signals, reducing the likelihood of false positives. The downside is the risk of “analysis paralysis,” where conflicting indicators make decision-making difficult.
Real-world Examples
To bring the theory into practice, let's look at some real-world examples where traders have successfully leveraged indicators.
There are numerous instances where traders have used Moving Averages to catch the start of a new trend, optimizing entry points for maximum profit. Similarly, RSI indicators have been effective in identifying ideal exit points, either to secure profits or to minimize losses.
For example, a trader using a combination of Bollinger Bands and RSI may find that an asset price touching the lower Bollinger Band while having an RSI below 30 is a strong buy signal. Acting on this, the trader could make a profitable entry.
However, indicators are not without pitfalls. One common mistake is relying solely on one type of indicator, which can lead to a biased and incomplete view of the market. Another mistake is overcomplicating your strategy with too many indicators, leading to conflicting signals and analysis paralysis. Ignoring trading volume is also a frequent error; volume can offer crucial insights into the strength or weakness of a price trend.
Using indicators effectively can significantly improve your trading strategy, but it's important to be aware of common mistakes and pitfalls. Always remember that indicators are tools, not guarantees. Proper application and continuous learning are key.
How to Choose the Right Indicators

Choosing the right indicators is a pivotal step in crafting a successful trading strategy. How you proceed depends on various factors, including your trading style and objectives.
Your personal trading style plays a significant role in the choice of indicators. For example, if you're a scalper looking for quick trades, you might lean towards using short-term indicators like the 5-period Moving Average. Conversely, if you're a swing trader, you might prefer indicators that work better over longer time frames, such as the 50-period Moving Average or Bollinger Bands.
To select the right indicators, start by identifying your trading goals. Are you looking for quick profits, or are you more concerned with risk mitigation? Next, test various indicators to see how well they align with your trading style. Most trading platforms offer demo accounts where you can test without risking real money. Finally, evaluate the indicator's performance regularly and adjust your strategy as needed.
Remember, there is no one-size-fits-all approach. The best traders often use a combination of indicators to get a well-rounded view of market conditions. But whatever your approach, make sure to choose indicators that align closely with your trading strategies and goals.
Conclusion
In the intricate landscape of Forex day trading, indicators serve as invaluable tools to guide decision-making. We've discussed various types of indicators, from Moving Averages to Bollinger Bands, each with its own strengths and weaknesses. Indicators can offer buy and sell signals, assist in risk management, and be combined for a more nuanced trading strategy. Real-world examples show that these tools, when used effectively, can significantly improve trading outcomes. However, it's important to be mindful of common mistakes like relying on a single indicator or overcomplicating your strategy.
For actionable insights, traders should first identify their personal trading style and goals. Then, they can select and test indicators that align with their strategies using demo accounts. Regular evaluation and adjustment of your trading strategy are crucial for long-term success.
Also Read: 9 Best Day Trading Courses
FAQs
What are the most reliable indicators for Forex day trading?
There's no one-size-fits-all answer, as the reliability of an indicator can vary depending on your trading style and strategy. However, Moving Averages, Relative Strength Index (RSI), and Bollinger Bands are often cited as effective for various types of day trading strategies.
Can I rely solely on indicators for my trading decisions?
While indicators are valuable tools, they should not be the only factor in your decision-making process. It's essential to incorporate other elements like market news, trading volume, and risk management techniques. Indicators are best used in conjunction with other methods to make well-rounded trading decisions.
How many indicators should I use in my trading strategy?
There's no definitive answer, but using too many can lead to analysis paralysis, and using too few could result in a lack of sufficient data. The key is to find a balance that aligns with your trading style and goals. Start with a few that complement each other and then regularly evaluate their effectiveness in your strategy.


