Learn To Trade Forex • Best Forex Trading Course • AsiaForexMentor

  • Best Brokers
    • Choosing Brokers
    • Comparing Brokers
  • Best by Country
    • flags Best Forex Brokers in Taiwan
    • flagsBest Forex Brokers in Singapore
    • flagsBest Forex Brokers in South Africa
    • flagsBest Forex Brokers in Japan
    • flagsBest Forex Brokers in Philippines
    • flagsBest Forex Brokers in Malaysia
    • flagsBest Forex Brokers in Vietnam
    • flagsBest Forex Brokers in India
    • flagsBest Forex Brokers in Thailand
    • flagsBest Forex Brokers in South Korea
    • flagsBest Forex Brokers in China
    • flags Best Forex Brokers in Indonesia
    • flagsBest Forex Brokers in UAE
    • flagsBest Forex Brokers in Dubai
    • flagsBest Forex Brokers in Italy
    • flagsBest Forex Brokers in Spain
    • flagsBest Forex Brokers in UK
    • flagsBest Forex Brokers in US
    • flagsBest Forex Brokers in Australia
    • flagsBest Forex Brokers in Switzerland
  • Brokers Review
  • Ranking List
    • Popular Brokers
      • Pamm Forex Brokers
      • MT4 Forex Brokers
      • MT5 Forex Brokers
      • cTrader Forex Brokers
      • Commodity Brokers
    • By Regulation
      • FCA Regulated Forex Brokers
      • NFA Regulated Forex Brokers
      • NYSE Regulated Forex Brokers
      • ECN Regulated Forex Brokers
    • By Instruments
      • Gold Trading Brokers
      • Oil Trading Brokers
    • By Brokers Types
      • Stp Brokers
      • Market Makers
    • By Prop Trading Firm
    • By Trading Platforms
    • Top 10 Best Forex Brokers
  • Brokers
    • Choosing Brokers Categories
    • Compare Forex Brokers
  • Ranking List
    • Best Forex Brokers
    • Brokers by Country
      • US Forex Brokers
      • UK Forex Brokers
      • Australian Forex Brokers
      • Swiss Forex Brokers
    • Popular Brokers
      • Pamm Forex Brokers
      • MT4 Forex Brokers
      • Commodity Brokers
    • By Regulation
      • ECN Regulated Forex Brokers
      • NYSE Regulated Forex Brokers
      • NFA Regulated Forex Brokers
      • FCA Regulated Forex Brokers
    • By Instruments
      • Gold Trading Brokers
      • Oil Trading Brokers
      • Top 10 Best Forex Brokers
    • By Brokers Type
      • Stp Brokers
      • Market Makers
    • By Prop Trading Firm
    • By Trading Platform
  • Academy
    • Forex Guide
    • Trading Videos
    • Trading Strategies
    • AFM One Core Program
    • Trade Rescue Operation
    • Corporate Training & Advisory
  • Promotions
  • Newsletter
AFM Proprietary Program
  • Best Brokers
    • Choosing Brokers
    • Comparing Brokers
    • Best CFD Brokers
    • Best ECN Brokers
    • Best MT5 Brokers
    • Best MT4 Brokers
    • Best cTrader Brokers
    • Best Spread Betting Brokers
    • Best PayPal Forex Brokers
    • High Leverage Forex Brokers
    • Best Zero Spread Brokers
    • Lowest Spread Forex Broker
    • Best Raw Spreads Brokers
    • Best TradingView Brokers
    • Best Forex Broker for Beginners
    • Best Forex Brokers for Scalping
    • Best Forex Options Brokers
    • PAMM Account Brokers
    • Best Bitcoin Forex Brokers
    • Best Cent Account Forex Brokers
    • Cheapest Forex Brokers
    • Best Commodities Brokers
  • Best by Country
    • flags Best Forex Brokers in Taiwan
    • flagsBest Forex Brokers in Singapore
    • flagsBest Forex Brokers in South Africa
    • flagsBest Forex Brokers in Japan
    • flagsBest Forex Brokers in Philippines
    • flagsBest Forex Brokers in Malaysia
    • flagsBest Forex Brokers in Vietnam
    • flagsBest Forex Brokers in India
    • flagsBest Forex Brokers in Thailand
    • flagsBest Forex Brokers in South Korea
    • flagsBest Forex Brokers in China
    • flags Best Forex Brokers in Indonesia
    • flagsBest Forex Brokers in UAE
    • flagsBest Forex Brokers in Dubai
    • flagsBest Forex Brokers in Italy
    • flagsBest Forex Brokers in Spain
    • flagsBest Forex Brokers in UK
    • flagsBest Forex Brokers in US
    • flagsBest Forex Brokers in Australia
    • flagsBest Forex Brokers in Switzerland
  • Brokers Review

    Forex Brokers

    • AvaTrade
    • Plus500 標誌 Plus500
    • FP Markets
    • TMGM
    • EXNESS
    • XM
    • JustMarkets
    • HTFX
    • Doo Prime
    • Markets4you

    Stock Brokers

    • XM
    • Interactive Brokers
    • Orbex
    • RoboForex

    Crypto Exchanges

    • Binance
    • Coinbase
    • Gemini Exchange
    • Kraken

    Prop Firms

    • iFunds
    • IC Funded
    • The 5ers Logo (2)-svg The 5%ers
    • TopStep

    Binary Brokers

    • IQ Option
    • Pocket Option
    • RaceOption
    • IQCent
  • Ranking List
    • Popular Brokers
      • Pamm Forex Brokers
      • MT4 Forex Brokers
      • MT5 Forex Brokers
      • cTrader Forex Brokers
      • Commodity Brokers
    • By Regulation
      • FCA Regulated Forex Brokers
      • NFA Regulated Forex Brokers
      • NYSE Regulated Forex Brokers
      • ECN Regulated Forex Brokers
    • By Instruments
      • Gold Trading Brokers
      • Oil Trading Brokers
    • By Brokers Types
      • Stp Brokers
      • Market Makers
    • By Prop Trading Firm
    • By Trading Platforms
    • Top 10 Best Forex Brokers
  • Brokers
    • Choosing Brokers Categories
    • Compare Forex Brokers
  • Ranking List
    • Best Forex Brokers
    • Brokers by Country
      • US Forex Brokers
      • UK Forex Brokers
      • Australian Forex Brokers
      • Swiss Forex Brokers
    • Popular Brokers
      • Pamm Forex Brokers
      • MT4 Forex Brokers
      • Commodity Brokers
    • By Regulation
      • ECN Regulated Forex Brokers
      • NYSE Regulated Forex Brokers
      • NFA Regulated Forex Brokers
      • FCA Regulated Forex Brokers
    • By Instruments
      • Gold Trading Brokers
      • Oil Trading Brokers
      • Top 10 Best Forex Brokers
    • By Brokers Type
      • Stp Brokers
      • Market Makers
    • By Prop Trading Firm
    • By Trading Platform
  • Academy
    • Forex Guide
    • Trading Videos
    • Trading Strategies
    • AFM One Core Program
    • Trade Rescue Operation
    • Corporate Training & Advisory
  • Promotions
  • Newsletter
AFM Proprietary Program

How to Trade the Bullish Tri-Star Pattern

Written by

Ezekiel Chew

Updated on

January 21, 2025

i
January 21, 2025 11:30 am No Comments

Trading the Bullish Tri-Star Pattern can be a profitable venture for traders who understand its nuances. This candlestick pattern is a rare but powerful signal in technical analysis, indicating a possible trend reversal from bearish to bullish. By learning how to spot and trade this pattern, traders can enhance their ability to make informed trading decisions across various markets, including the forex, stock, and commodity markets.

Contents

Toggle
  • What is the Bullish Tri-Star Pattern?
  • How to Spot the Bullish Tri-Star Pattern
  • Bullish vs. Bearish Tri-Star Pattern
  • How to Trade the Bullish Tri-Star Pattern
  • Indicators to Use to Confirm the Pattern
  • Common Mistakes When Trading the Bullish Tri-Star Pattern
  • Conclusion
  • FAQs

What is the Bullish Tri-Star Pattern?

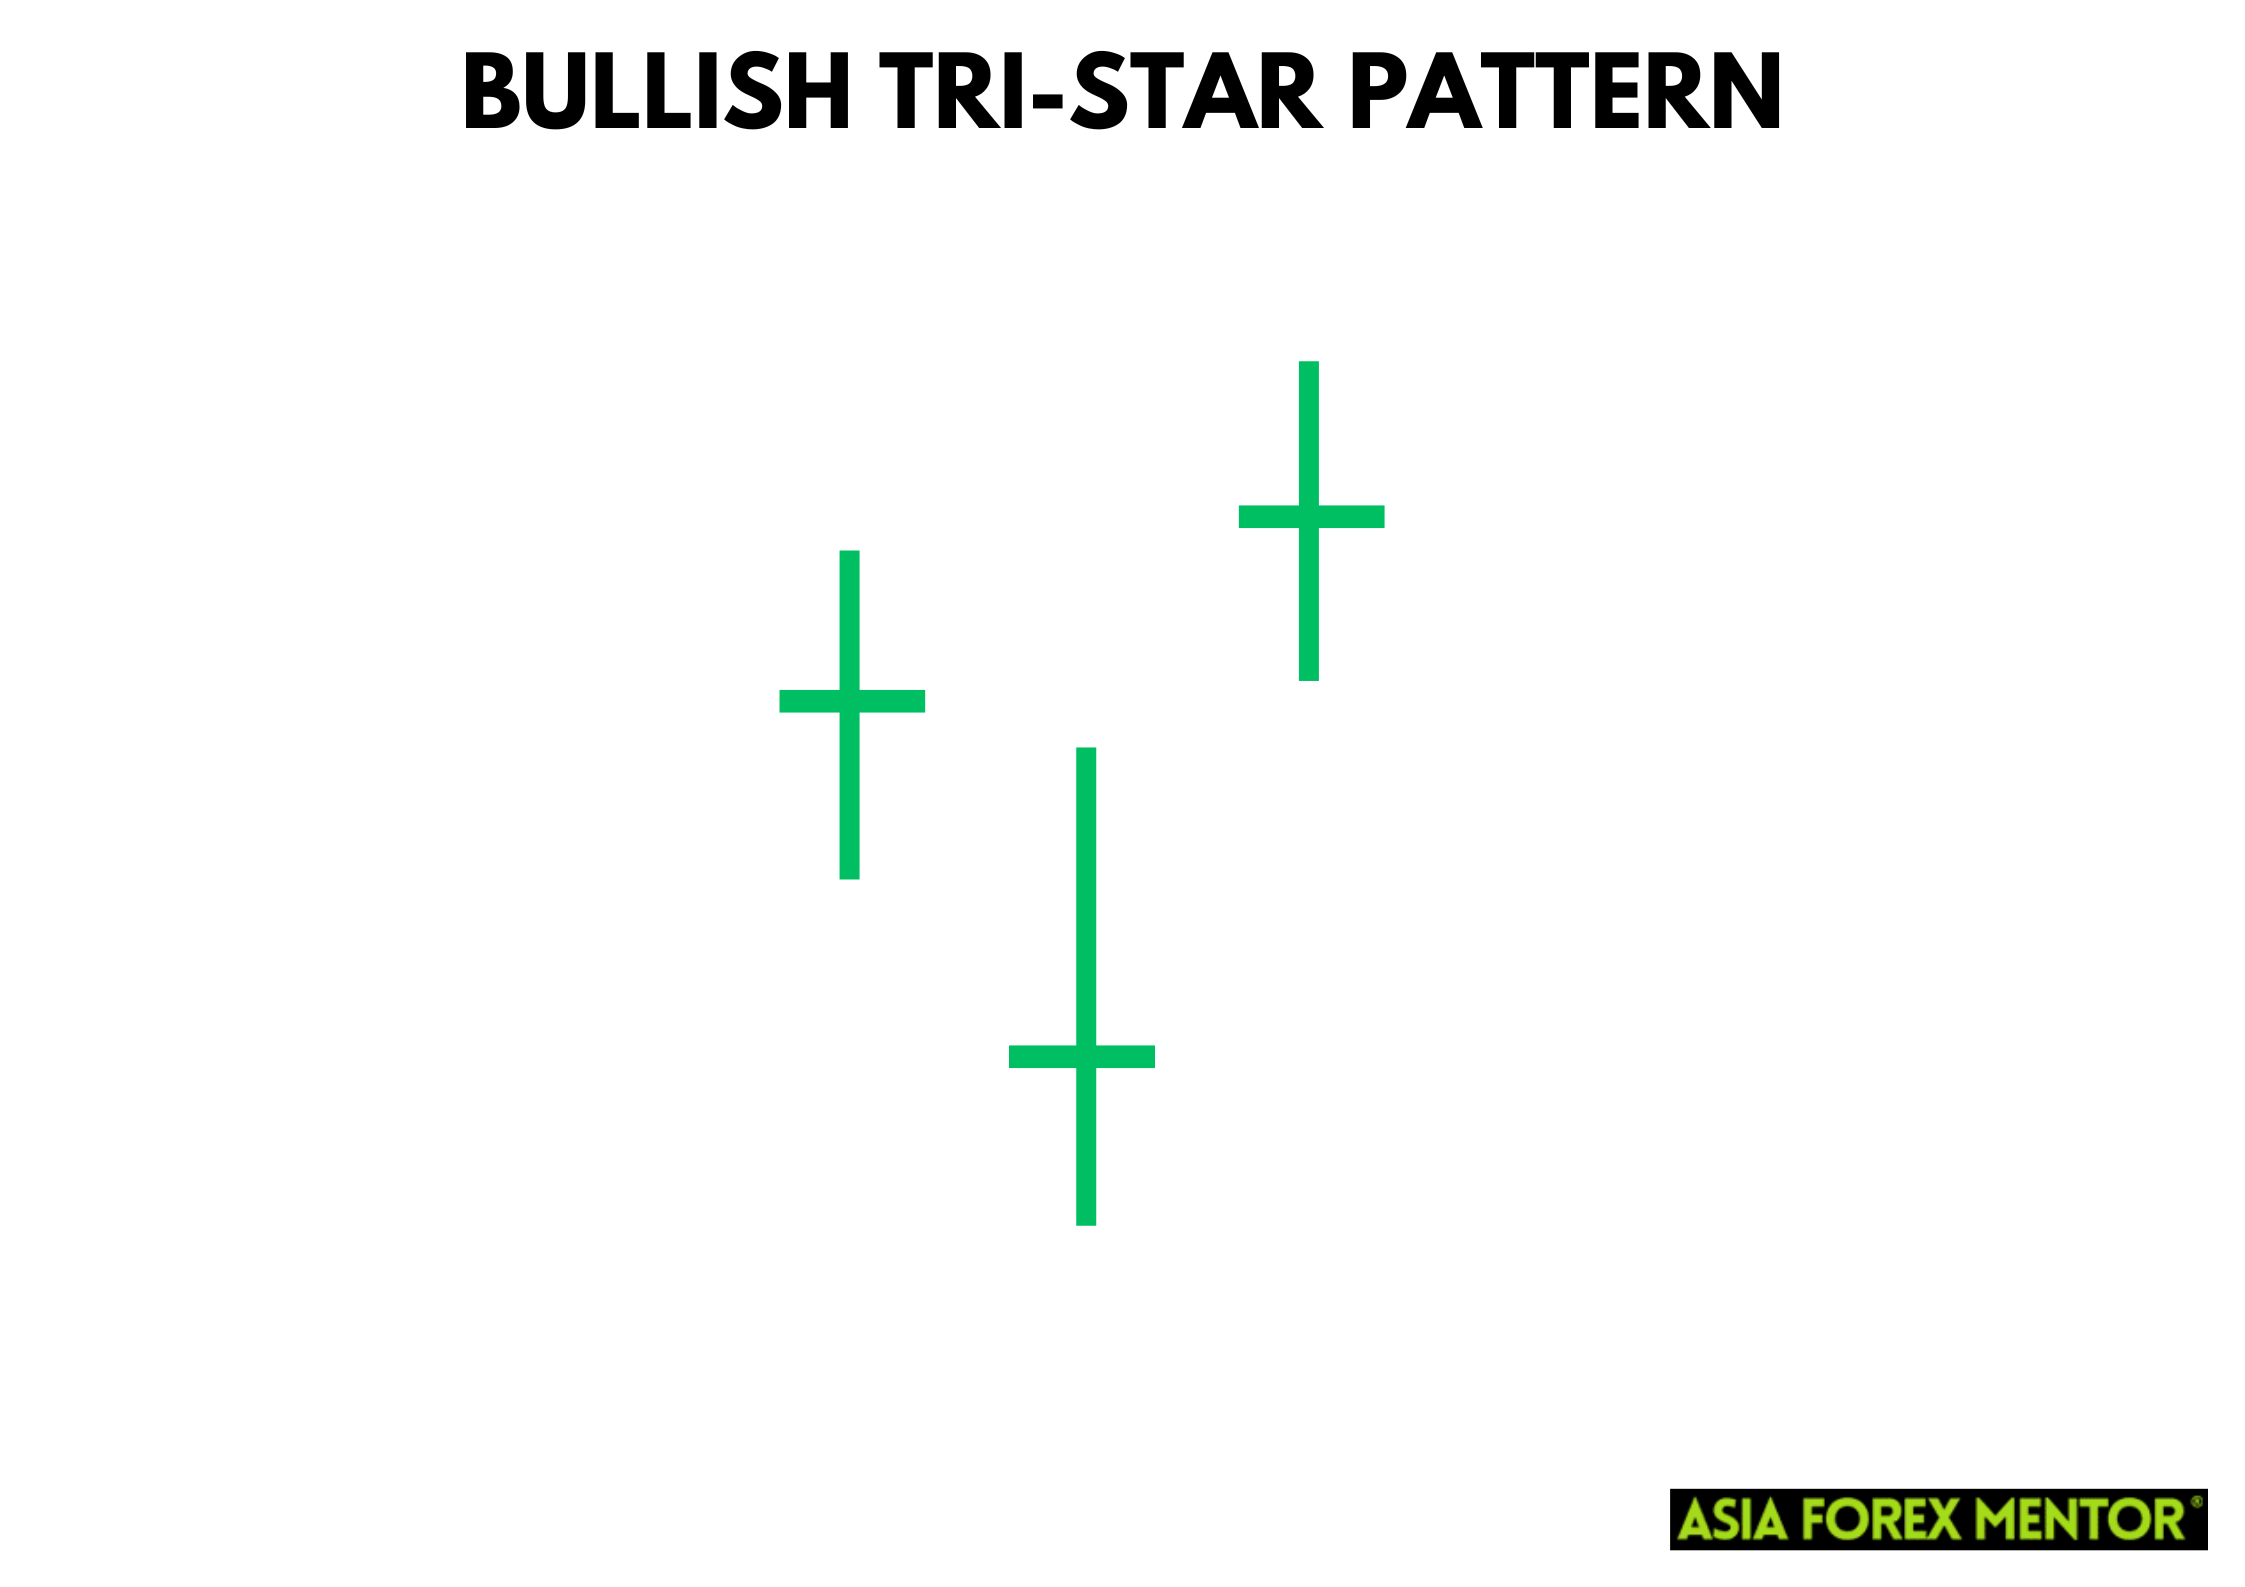
The Bullish Tri-Star Pattern is a bullish reversal pattern that forms after a downtrend, indicating a potential upward price reversal. This pattern is composed of three consecutive doji candlesticks, each representing market indecision.

  1. First Doji: Appears after a downswing, signaling the start of market indecision.
  2. Second Doji: Gaps below the first, continuing the indecision.
  3. Third Doji: Gaps above the second, indicating a shift in market sentiment.

This three-line candlestick pattern signifies that buying pressure is starting to outweigh selling pressure, suggesting a potential bullish reversal.

Detailed Breakdown

  • First Doji: This doji forms after a pronounced downtrend, indicating that the sellers are losing momentum. It marks the beginning of a potential reversal but doesn't confirm it on its own.
  • Second Doji: The second doji gaps down, creating a doji star. This gap shows that there is still uncertainty in the market. The distance between the first and second doji adds to the pattern's significance.
  • Third Doji: The third doji gaps up from the second, forming the final part of the pattern. This gap signifies that buyers are starting to enter the market, showing a potential end to the bearish trend and a shift towards bullish sentiment.

The presence of these three consecutive dojis indicates a strong market indecision followed by a potential trend reversal, making the Bullish Tri-Star Pattern a crucial indicator for traders looking to capitalize on trend reversals. This pattern is often used in conjunction with other technical indicators to confirm the potential reversal and make more informed trading decisions.

Also Read: The 28 Forex Patterns Complete Guide

How to Spot the Bullish Tri-Star Pattern

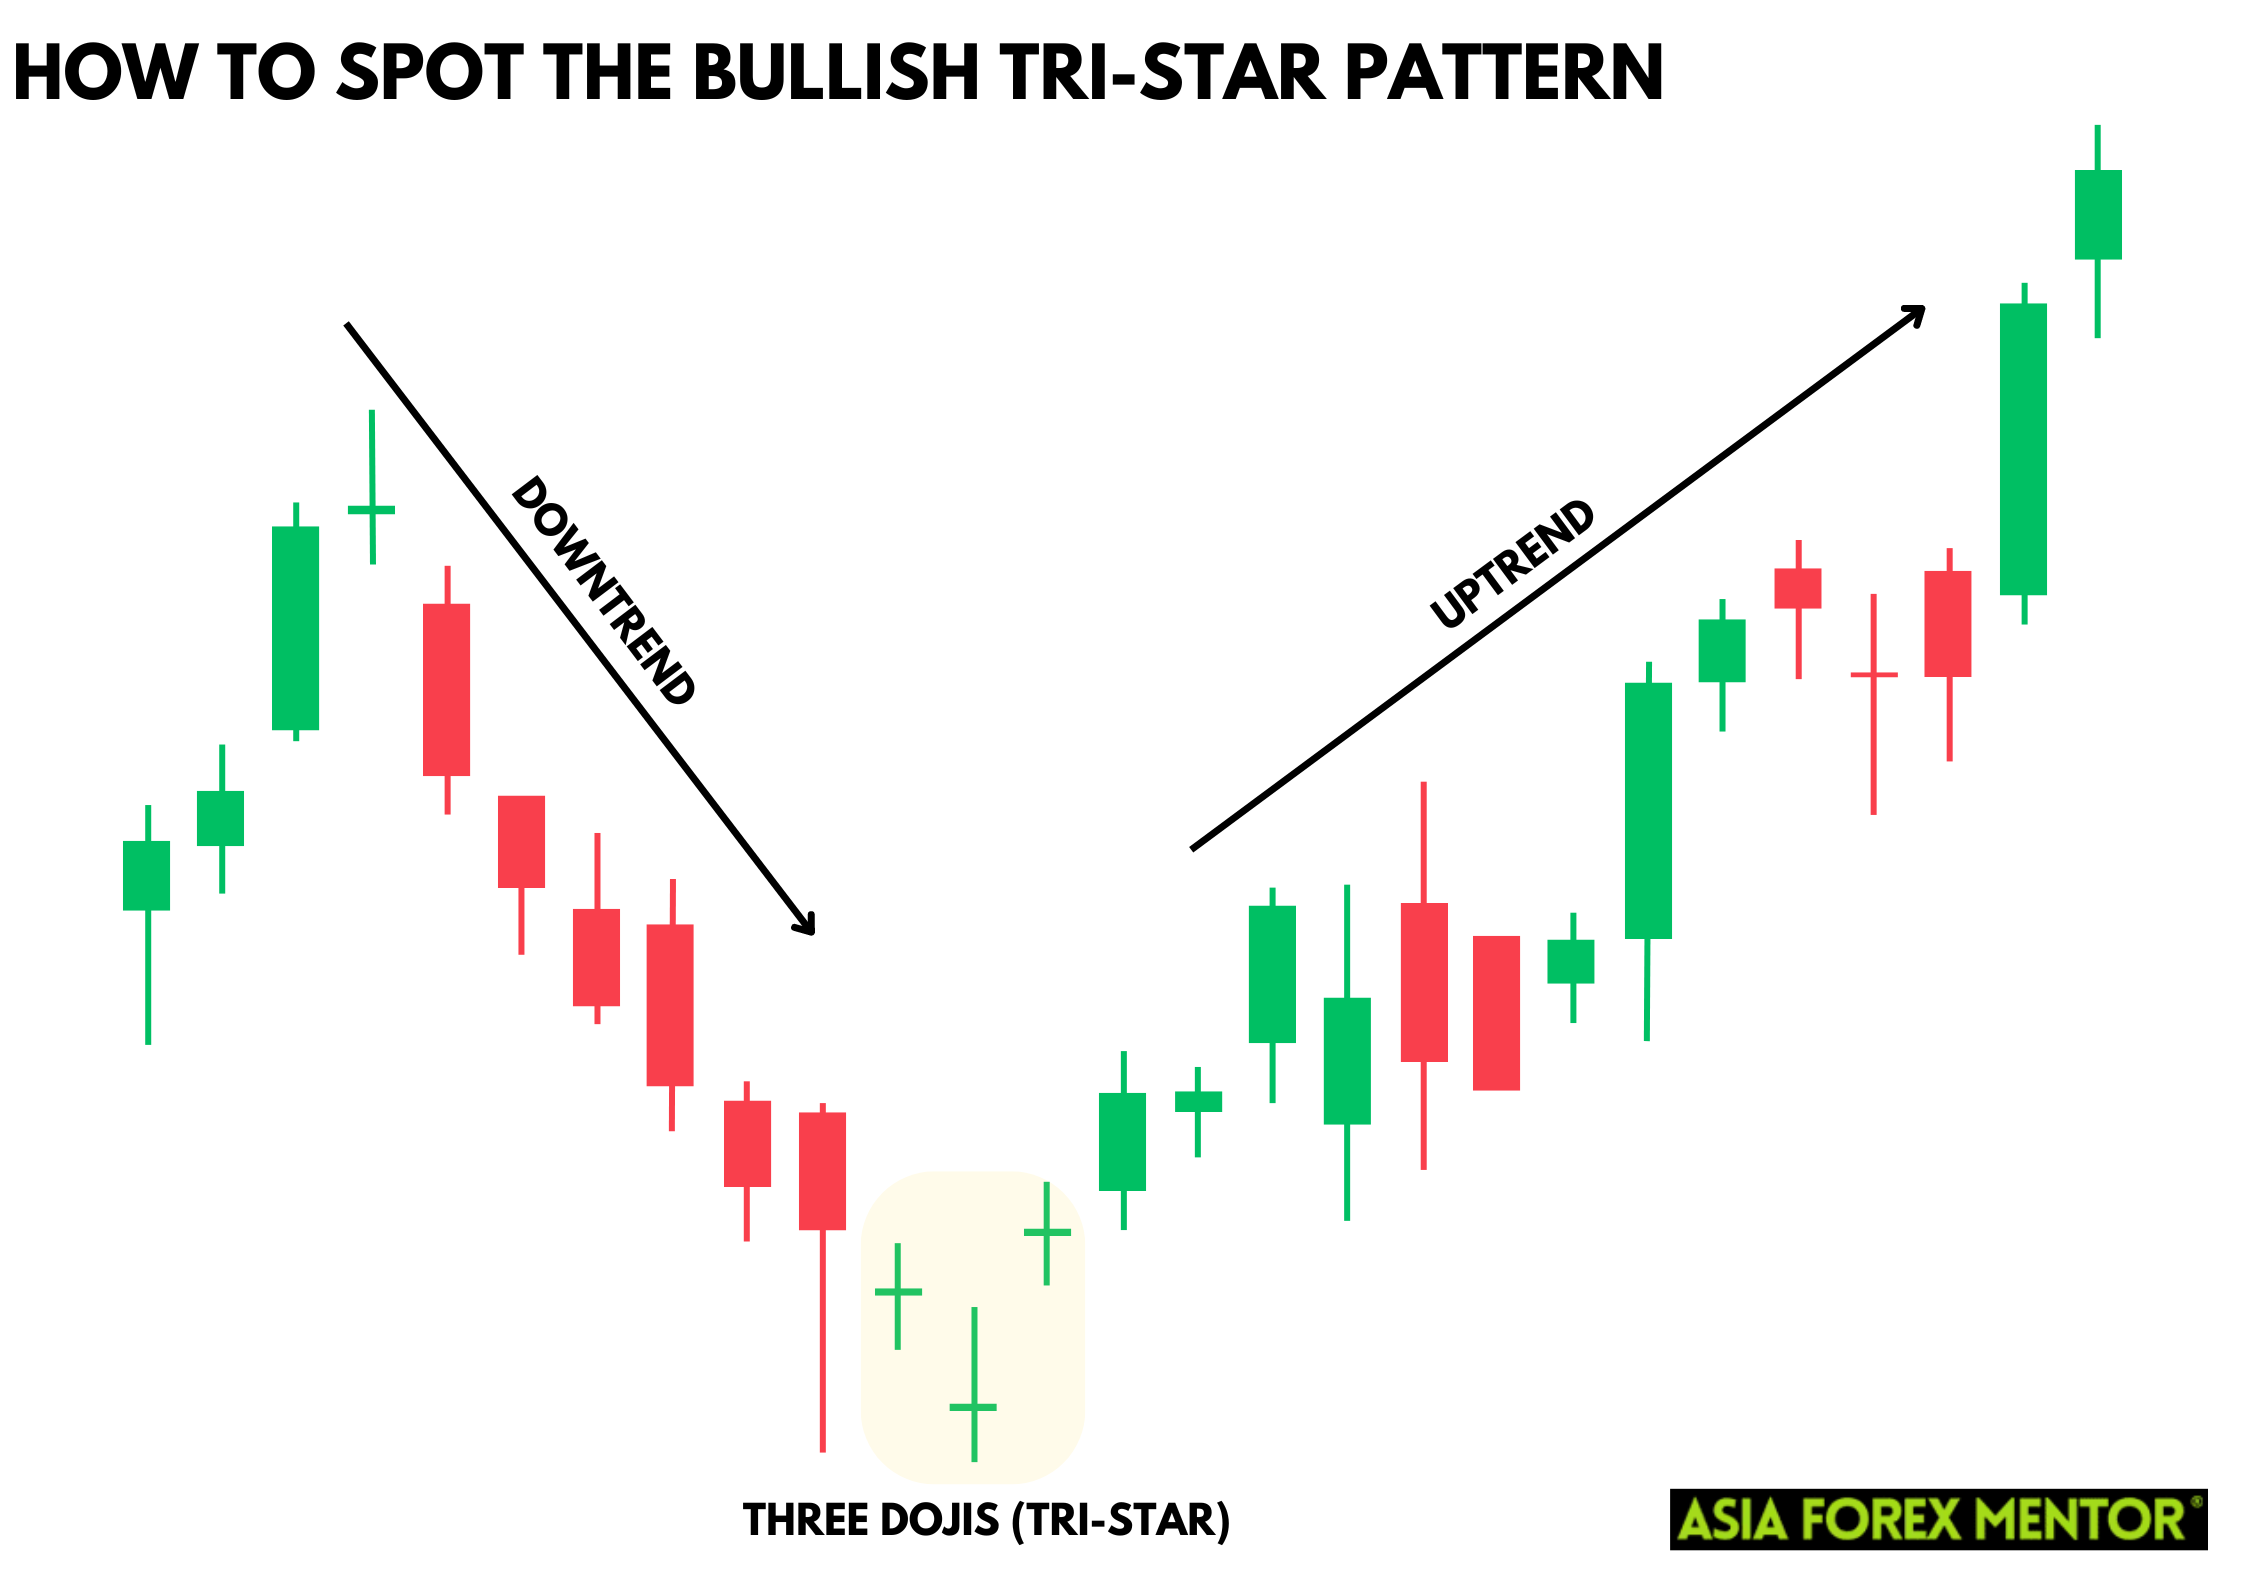
Identifying the Bullish Tri-Star Pattern involves recognizing three consecutive doji candlesticks within a downtrend. Here's a step-by-step approach:

  1. Current Trend: Ensure the pattern appears in a downtrend. This context is crucial as the Bullish Tri-Star Pattern is a reversal signal, indicating a shift from a bearish trend to a bullish one.
  2. Three Consecutive Doji Candlesticks: Look for three consecutive doji candles, which represent market indecision. These doji candlesticks should appear consecutively, each one indicating that neither buyers nor sellers are in control.
  3. Gaps: Check for gaps between the doji candlesticks. Specifically, the second doji should gap below the first, and the third doji should gap above the second. These gaps, known as doji gaps, highlight the significant indecision and potential for reversal.
  4. Doji Characteristics: Each doji should have small or non-existent real bodies with long shadows. This indicates that the opening and closing prices are very close to each other, reflecting market indecision. The long shadows suggest volatility, with prices moving significantly during the period but settling near the opening price.

Bullish vs. Bearish Tri-Star Pattern

Bullish Tri-Star Pattern

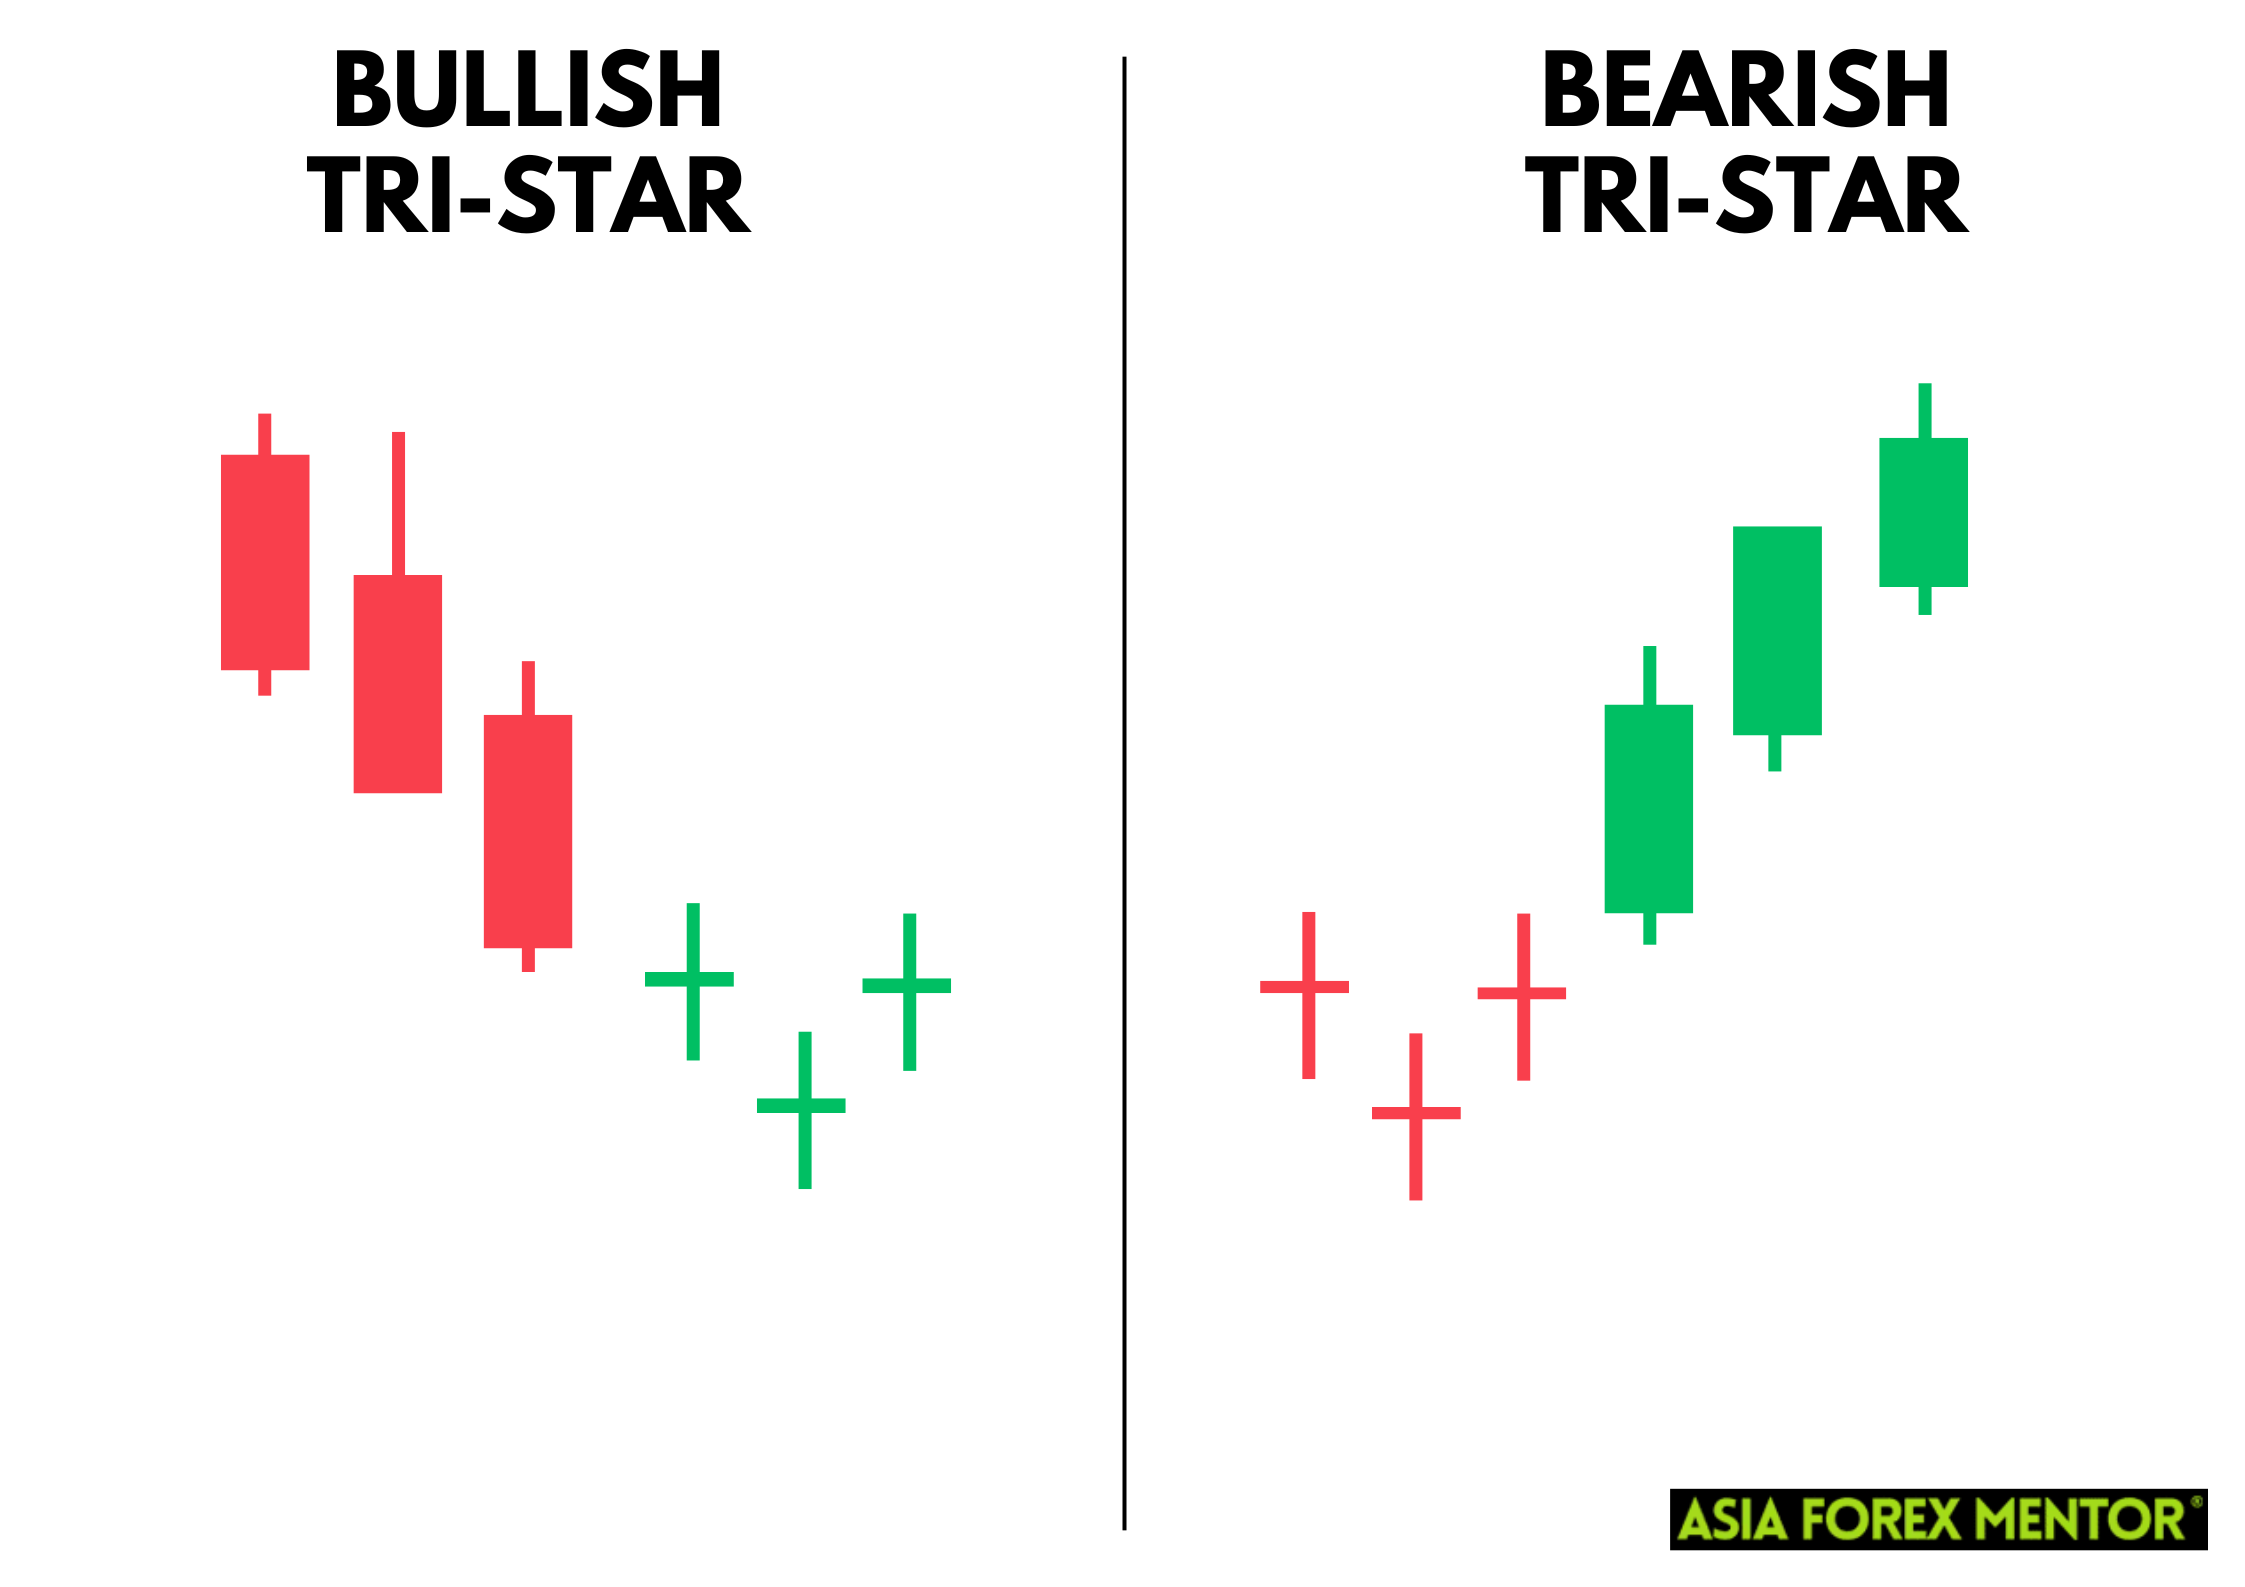
The Bullish Tri-Star Pattern is a rare but powerful reversal signal that appears after a downtrend, indicating a potential shift from bearish to bullish sentiment. This pattern consists of three consecutive doji candlesticks, each representing market indecision. The first doji appears after a downtrend, the second doji gaps below the first, and the third doji gaps above the second. This formation signifies that the selling pressure is decreasing and buying interest is increasing, suggesting a possible upward price reversal.

To effectively trade the Bullish Tri-Star Pattern, traders should wait for the third doji to close and confirm the pattern before entering a long position. Additional confirmation from other technical indicators, such as moving averages, RSI, MACD, and volume, can increase the reliability of this pattern.

Bearish Tri-Star Pattern

In contrast, the Bearish Tri-Star Pattern signals a potential reversal from a bullish to a bearish trend. This pattern also consists of three consecutive doji candlesticks but appears at the top of an uptrend. The first doji follows an uptrend, the second doji gaps up from the first, and the third doji gaps down from the second. This formation indicates that the buying pressure is weakening, and selling interest is starting to dominate, suggesting a potential downward price reversal.

Trading the Bearish Tri-Star Pattern involves entering a short position after the third doji closes, confirming the pattern. Like the bullish version, additional confirmation from other technical analysis tools can improve the pattern's reliability. Traders often use trend lines, support and resistance levels, and other indicators to validate the signal and make informed decisions.

Key Differences

  • Market Trend: The Bullish Tri-Star Pattern appears at the end of a downtrend, signaling a potential upward reversal, while the Bearish Tri-Star Pattern appears at the end of an uptrend, indicating a potential downward reversal.
  • Doji Gaps: In the bullish pattern, the second doji gaps down, and the third doji gaps up. In the bearish pattern, the second doji gaps up, and the third doji gaps down.
  • Sentiment Shift: The bullish pattern indicates a shift from bearish to bullish sentiment, whereas the bearish pattern signifies a shift from bullish to bearish sentiment.

Both patterns are valuable tools for traders looking to identify potential trend reversals. However, due to their rarity and the potential for false signals, they should be used in conjunction with other technical indicators and within the context of broader market conditions to maximize their effectiveness.

How to Trade the Bullish Tri-Star Pattern

Entry Point

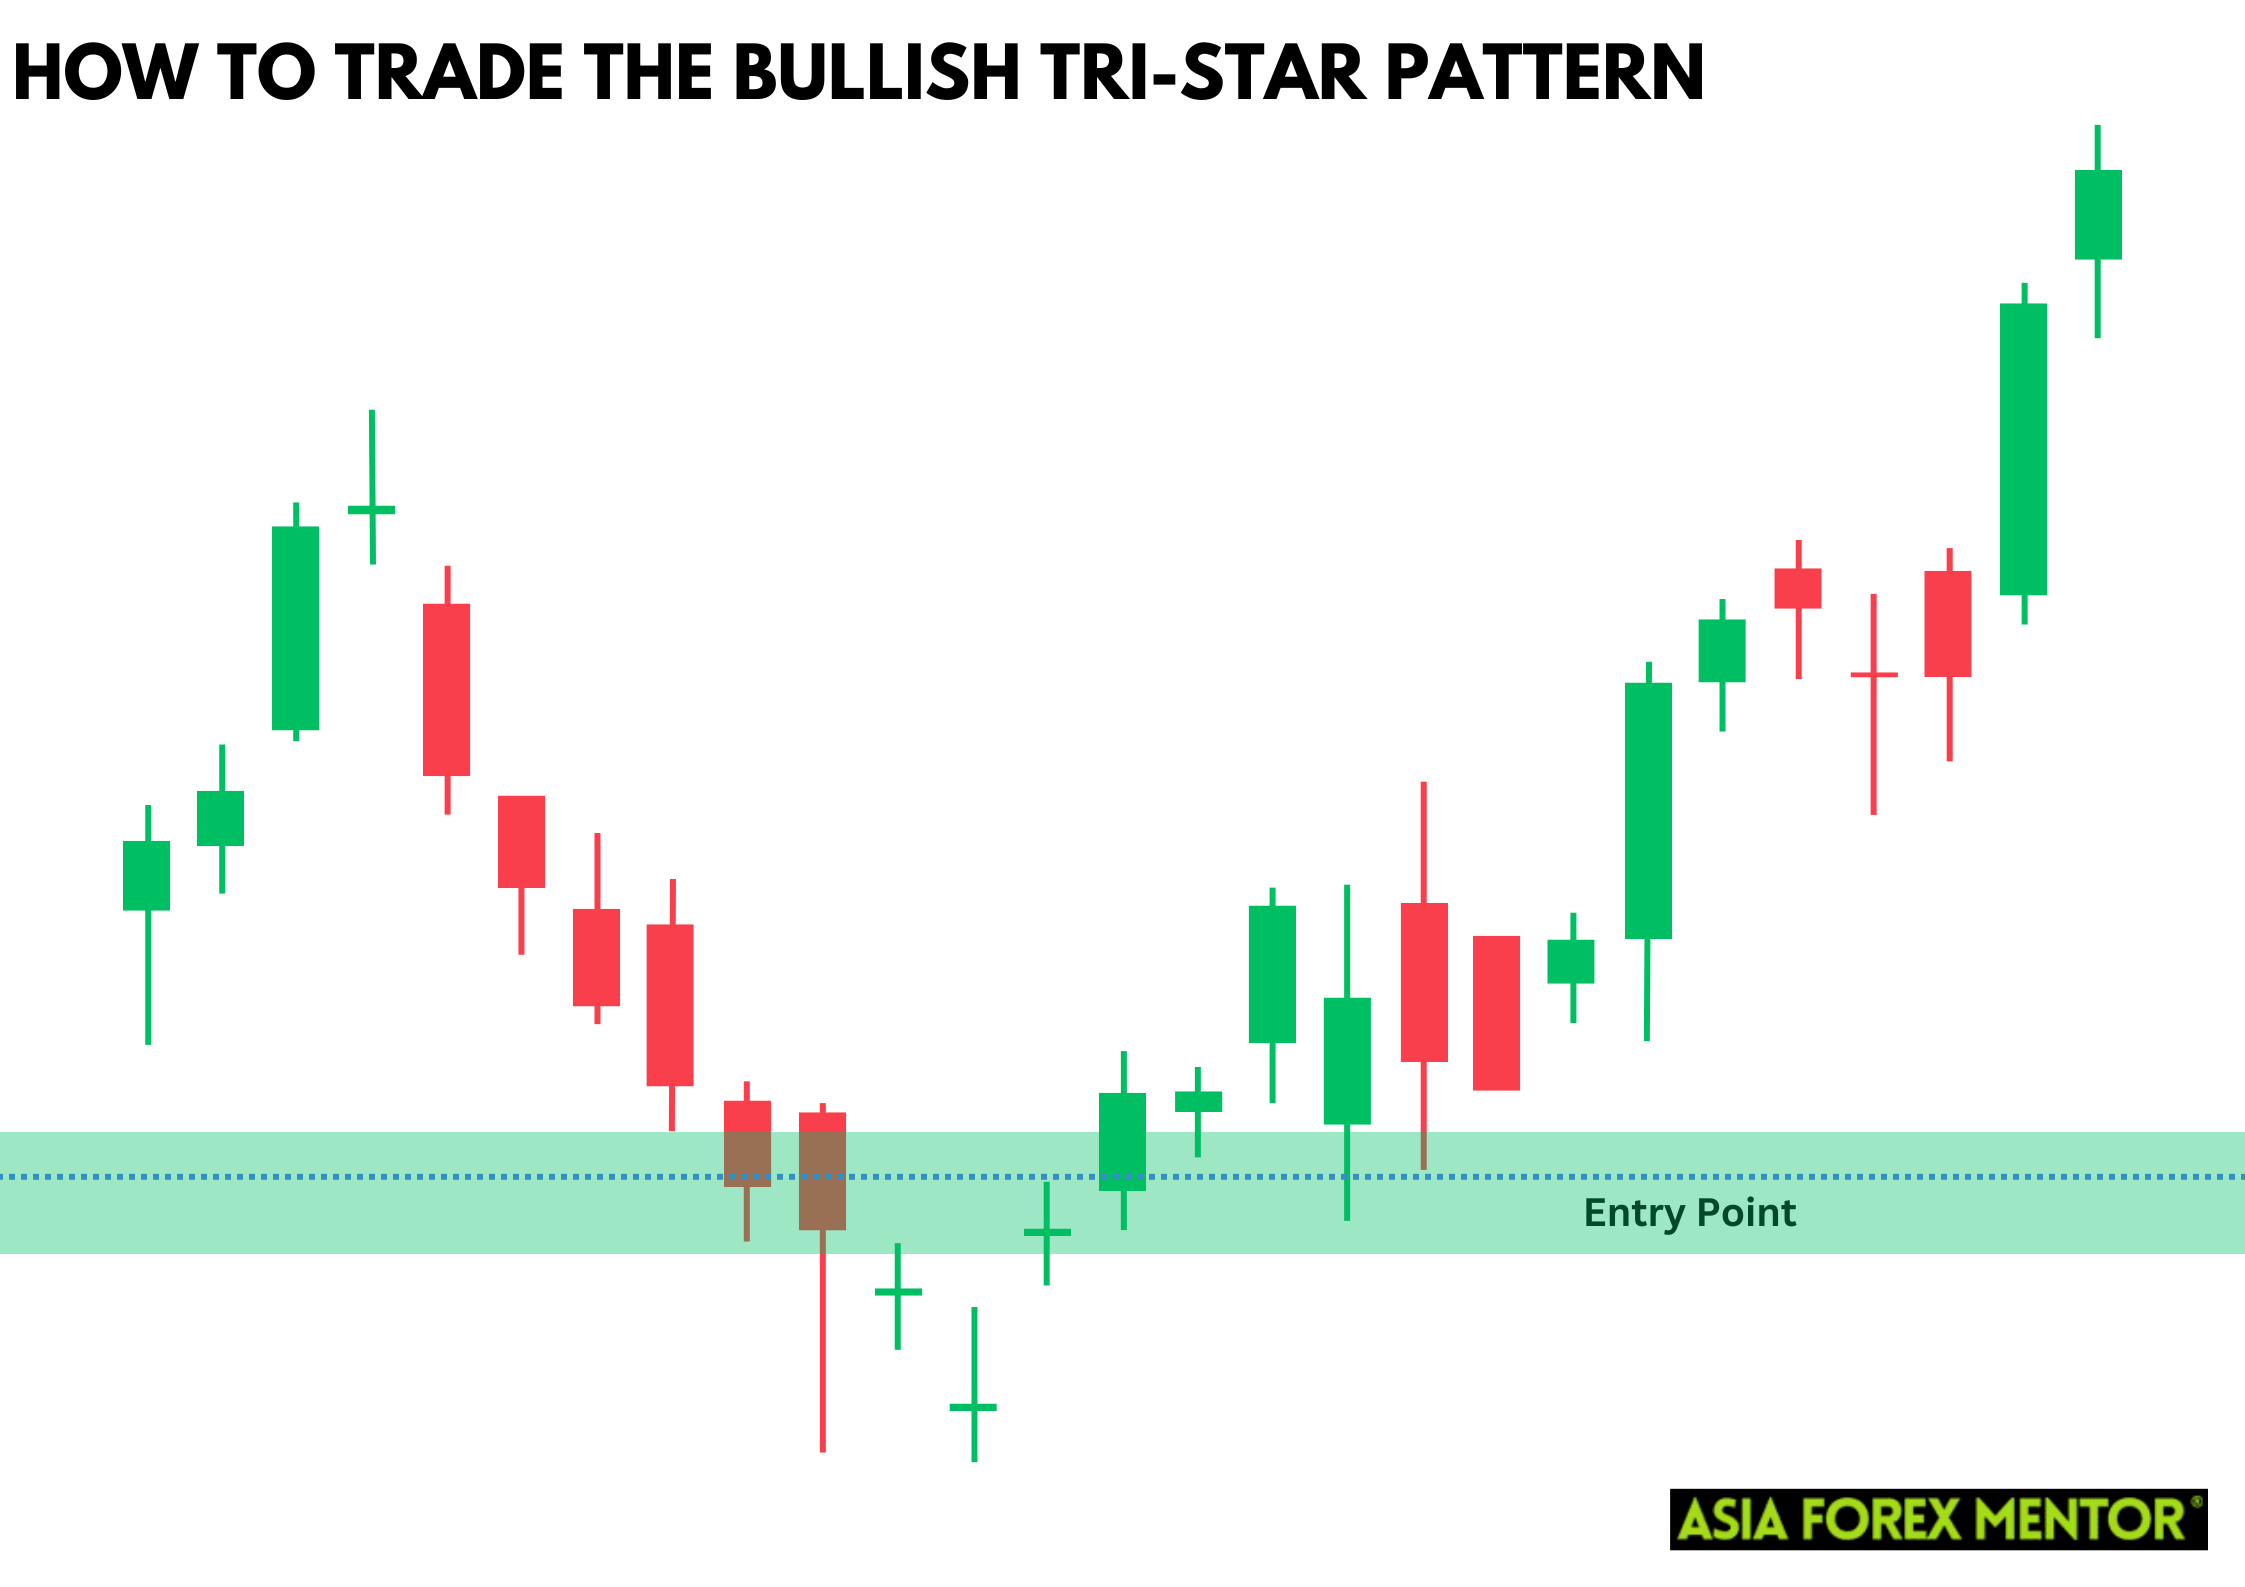
The ideal entry point for trading the Bullish Tri-Star Pattern occurs after the third doji closes, confirming the pattern. Traders can enter a long position when the price breaks above the high of the third doji. This break signifies that buying pressure is increasing and the market sentiment is shifting towards bullishness.

Once the third doji closes, confirming the pattern, wait for the price to break above the high of the third doji before entering a long position. This confirmation reduces the risk of entering on a false signal.

Stop Loss

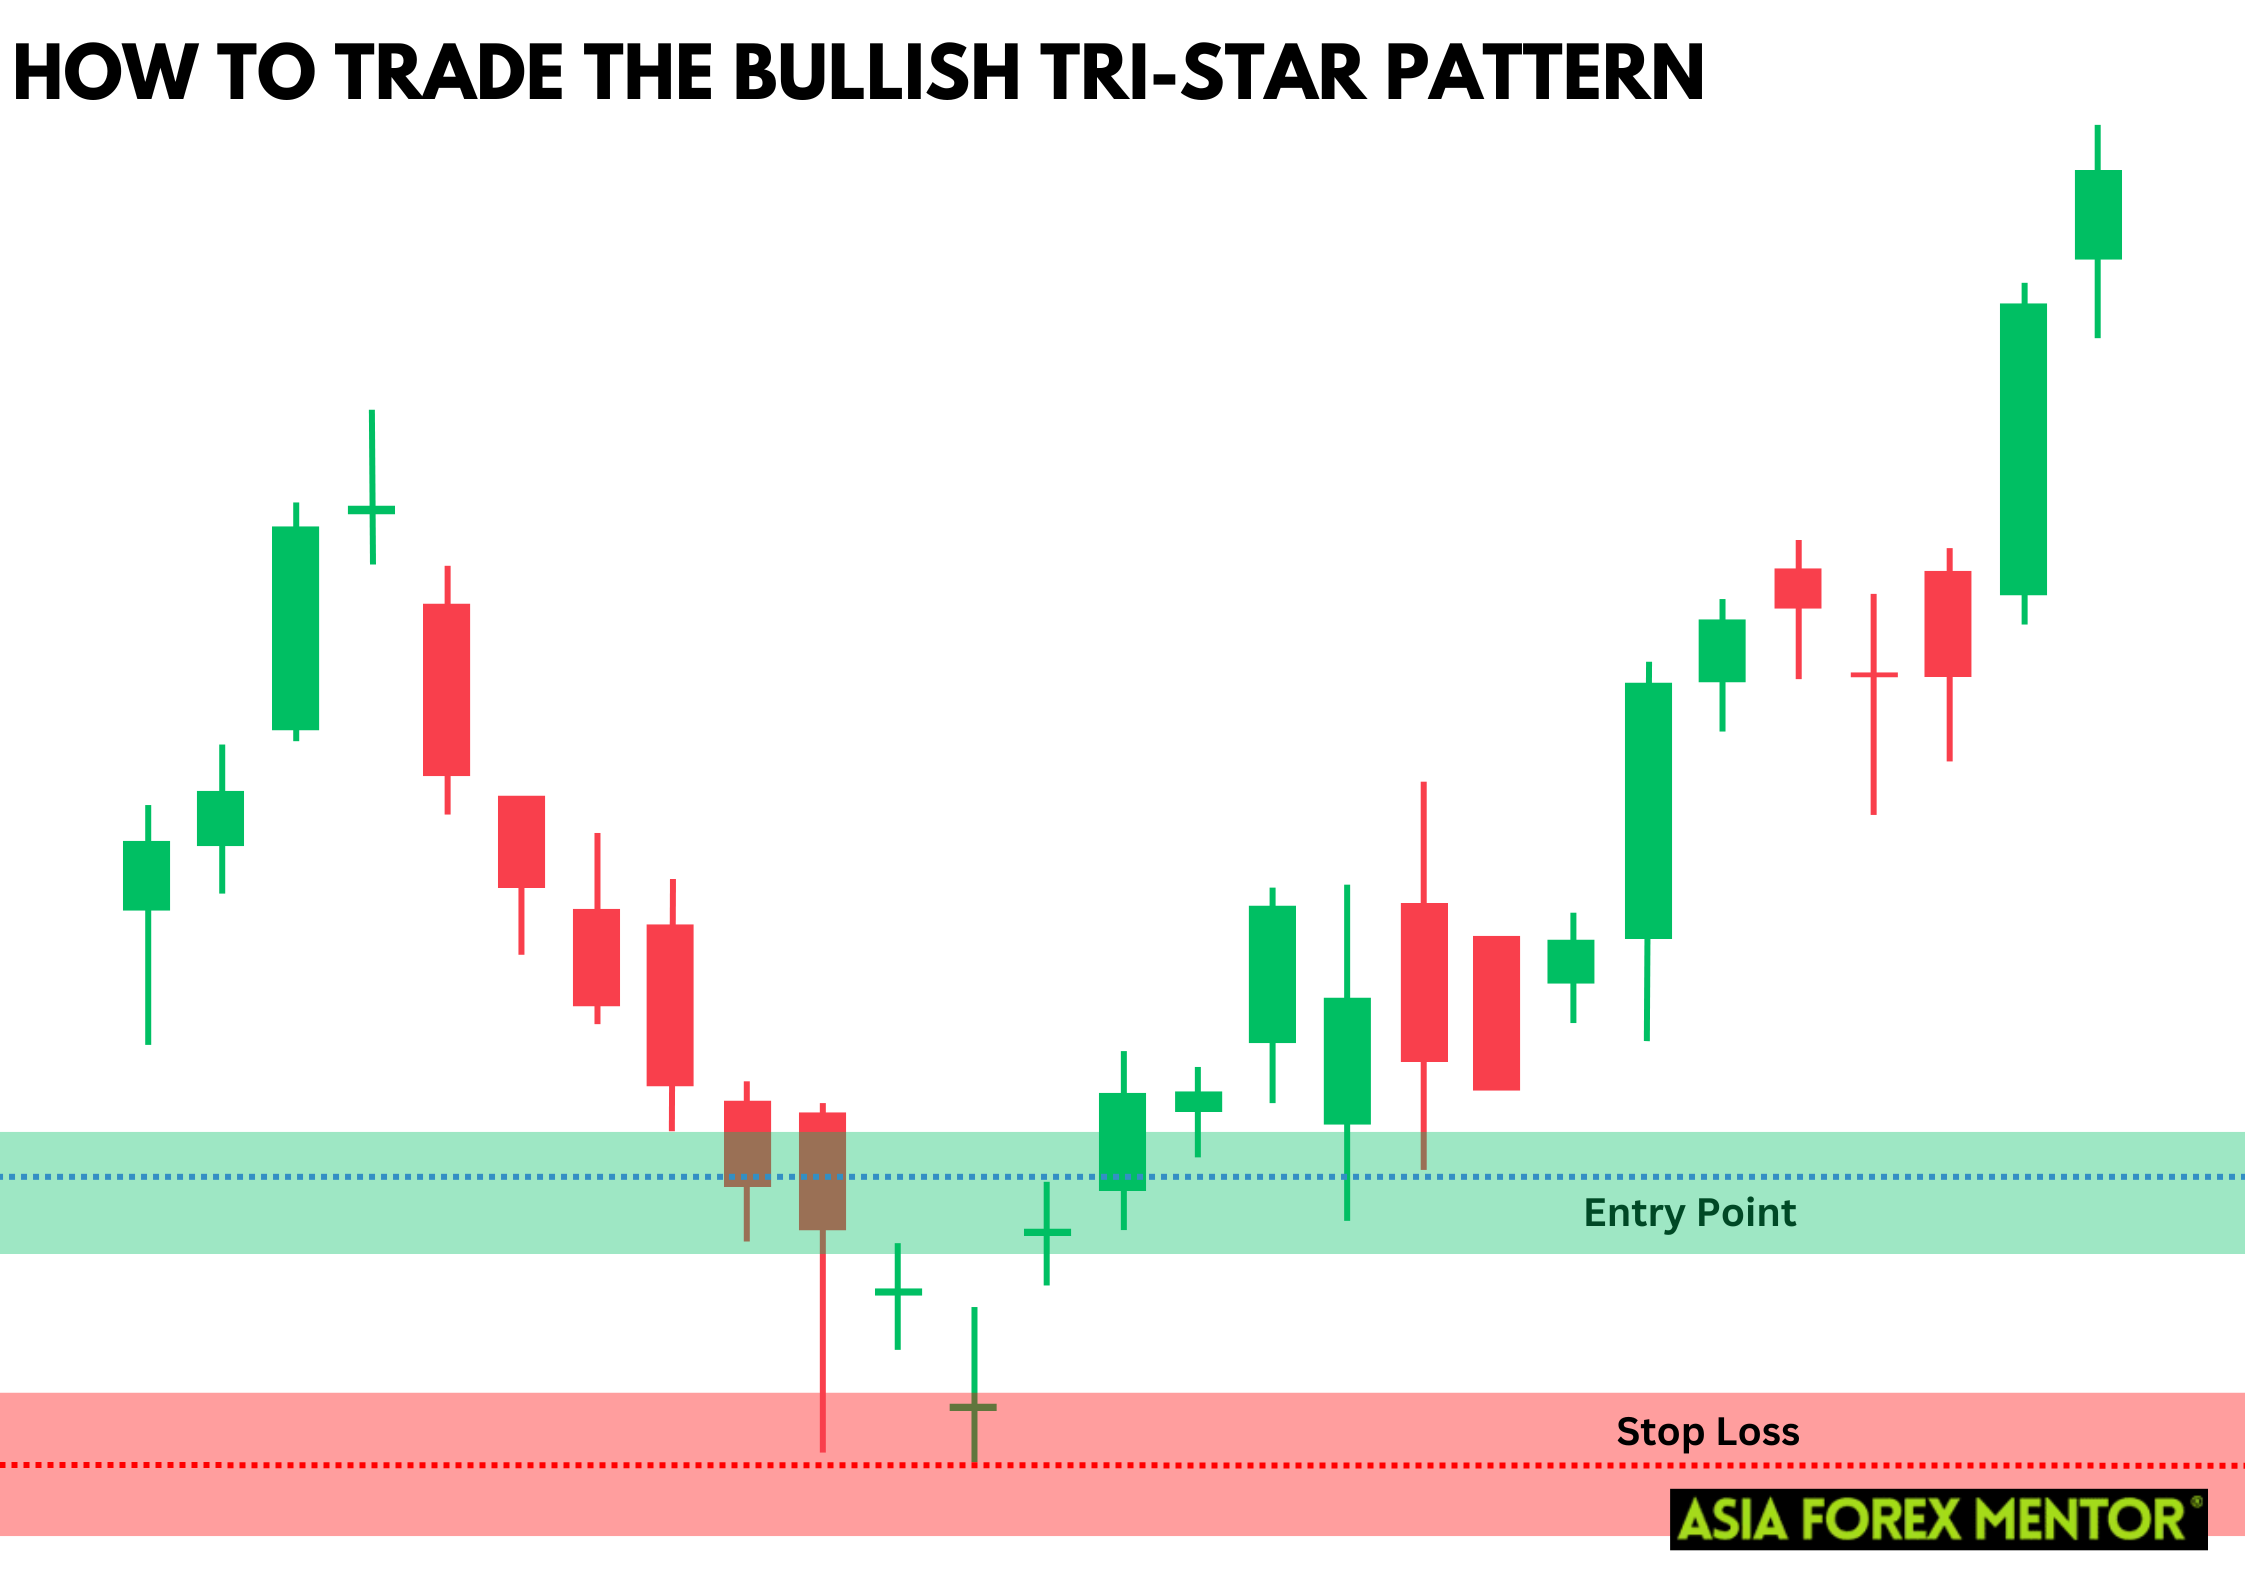
To manage risk and protect against false signals, set a stop-loss order below the lowest point of the three doji candlesticks. This level acts as a safety net, ensuring that if the price moves against the trade, losses are minimized.

Place the stop-loss order just below the lowest point of the three doji candlesticks. This level is critical because if the price falls below this point, it indicates that the bullish reversal has failed, and the downtrend may continue.

Profit Target

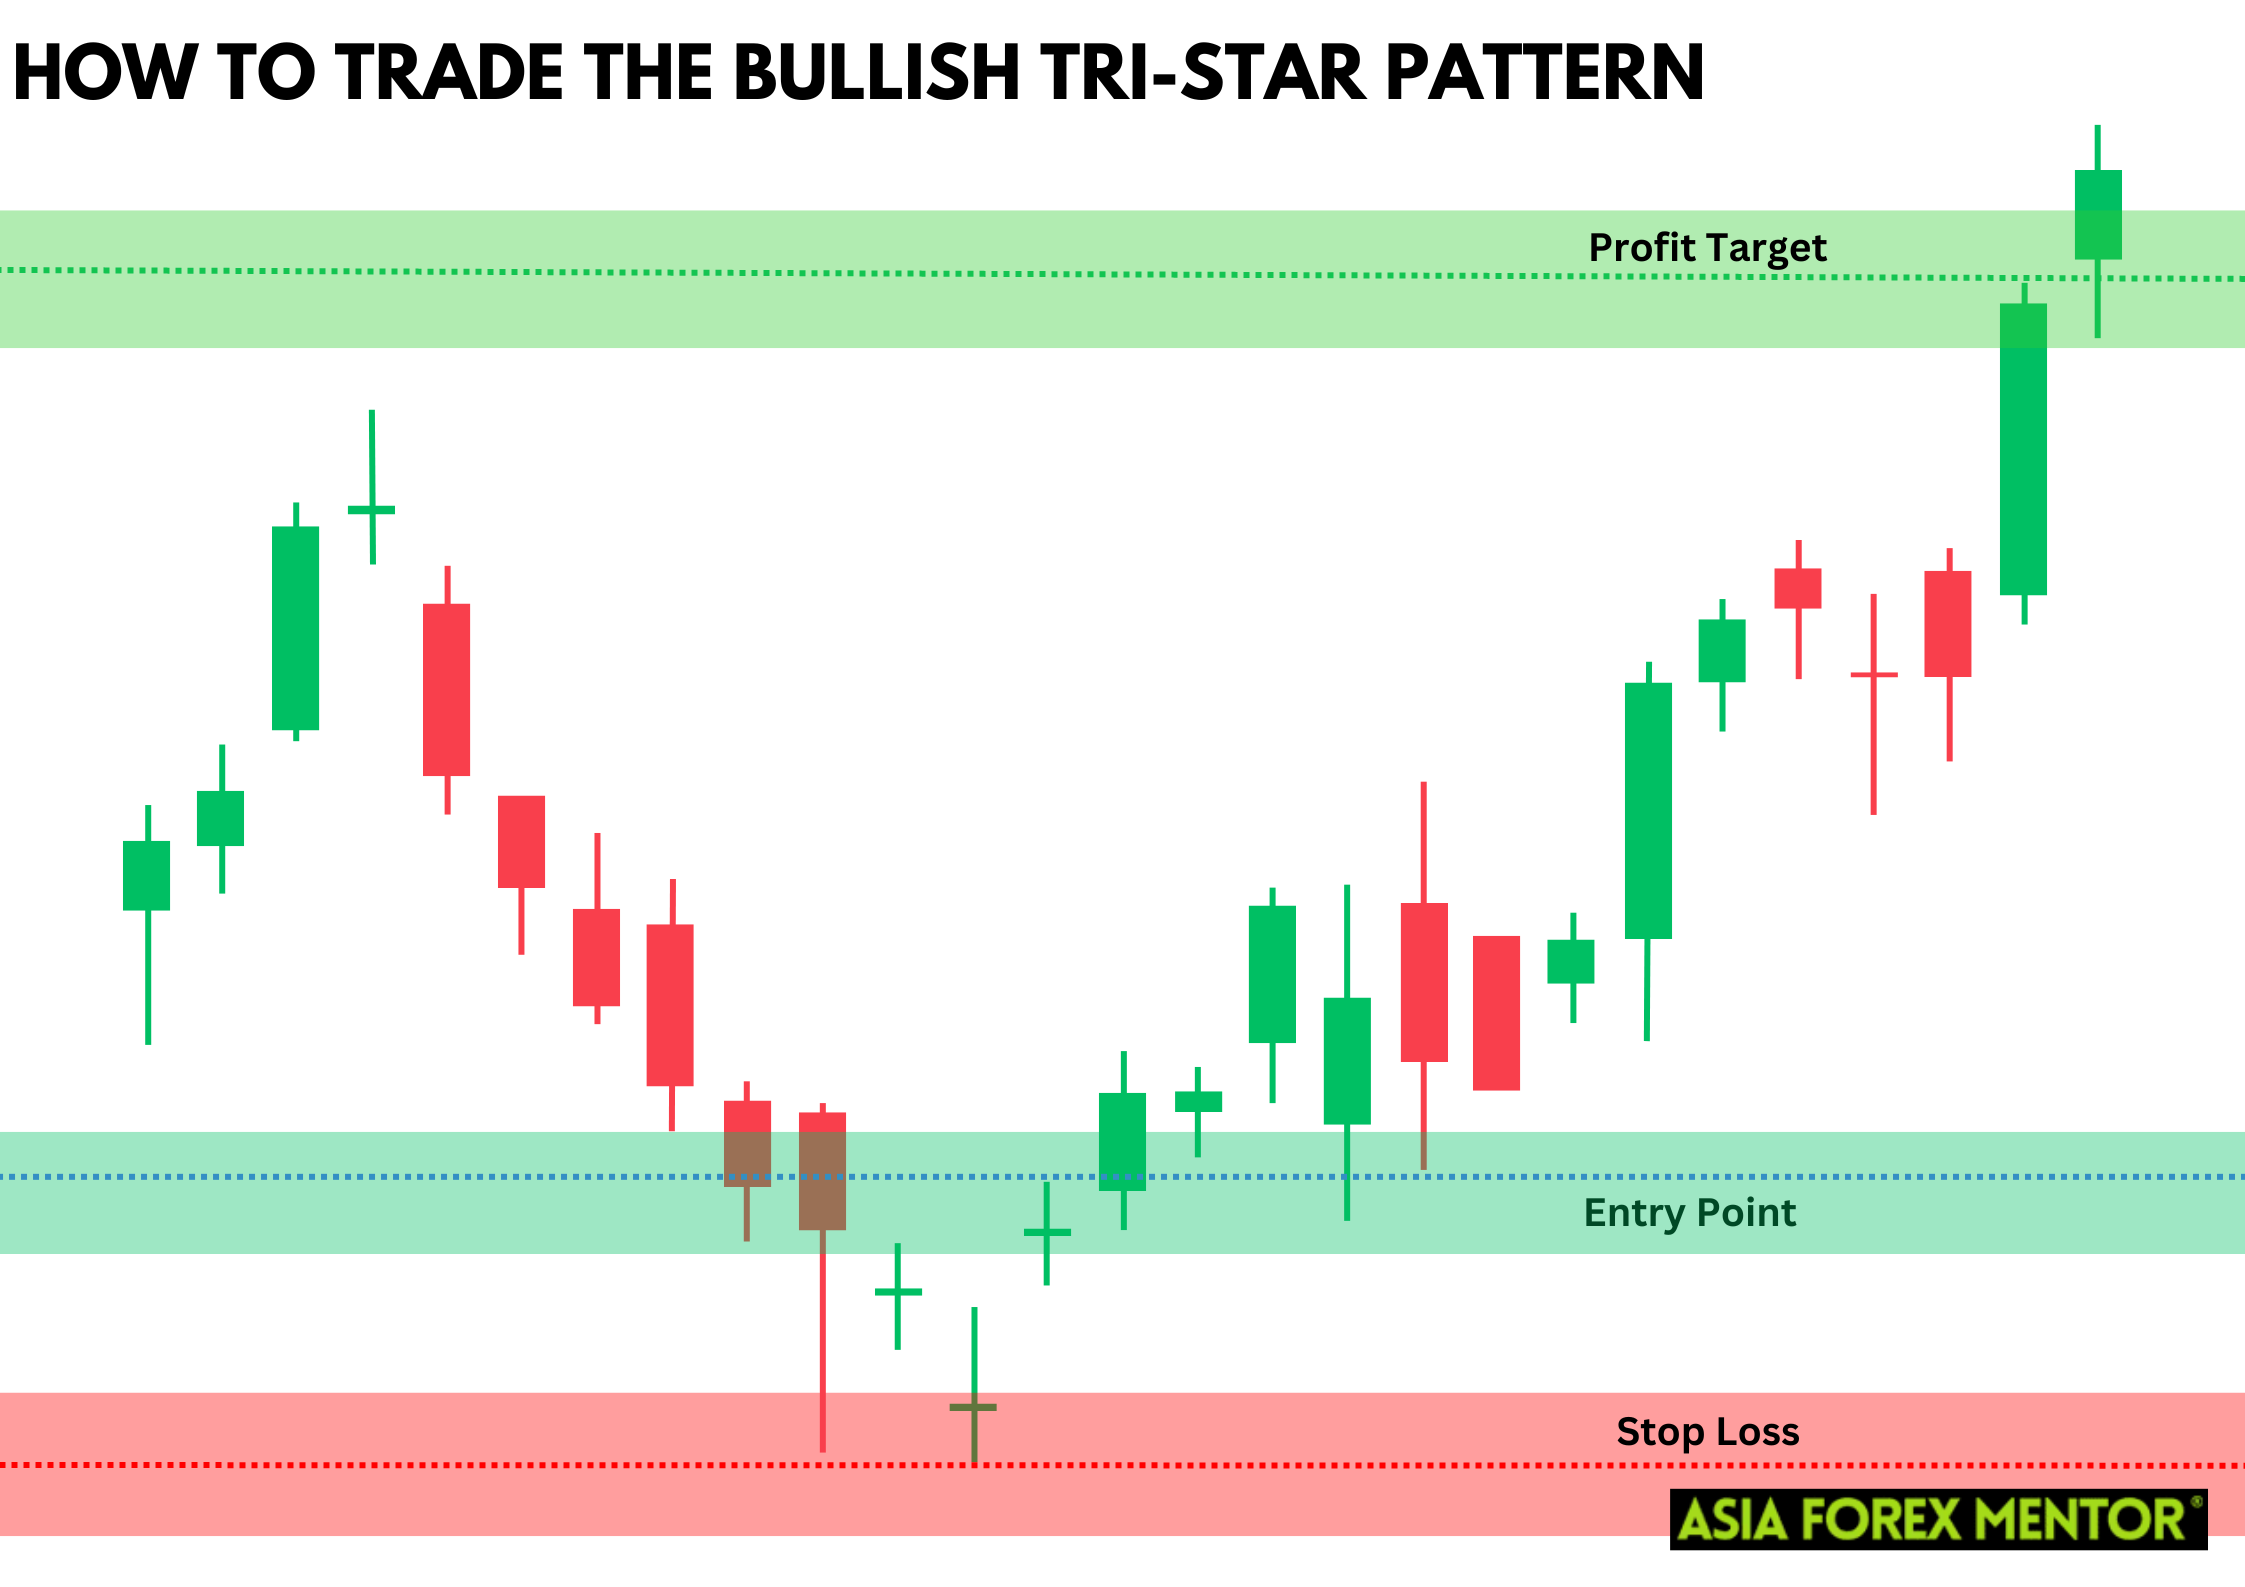
Aim for a risk-reward ratio of at least 1:2 when setting a profit target. This means that the potential reward should be at least twice the amount risked. Set the profit target at a level where previous resistance exists or based on other technical indicators suggesting a strong bullish move. This approach helps in maximizing gains while maintaining a disciplined trading strategy.

Determine your profit target based on key resistance levels or other technical indicators. For example, if the price has previously encountered resistance at a specific level, this could be a logical target for taking profits. Additionally, using indicators such as moving averages or Fibonacci retracement levels can help in identifying potential profit targets.

Pros and Cons of the Bullish Tri-Star Pattern

Pros

  • Indicates a significant shift from bearish to bullish sentiment
  • Provides clear guidelines for entry, stop-loss, and profit targets
  • Effective in various markets, including forex, stocks, and commodities

Cons

  • The pattern is rare, reducing the frequency of trading opportunities
  • Like all technical patterns, it can produce false signals, especially in volatile markets

Indicators to Use to Confirm the Pattern

To enhance the reliability of the Bullish Tri-Star Pattern, traders should use other technical indicators for confirmation:

Moving Averages

A bullish crossover in moving averages, such as the 50-day moving average crossing above the 200-day moving average, can confirm the Bullish Tri-Star Pattern. This crossover indicates that the short-term price trend is gaining strength relative to the long-term trend, reinforcing the likelihood of a reversal.

Relative Strength Index (RSI)

When the RSI rises from the oversold region (below 30) towards higher values, it signals increasing buying pressure. This movement supports the Bullish Tri-Star Pattern by indicating that the bearish momentum is waning and bullish sentiment is strengthening.

MACD

A bullish crossover on the MACD (Moving Average Convergence Divergence) line, where the MACD line crosses above the signal line, provides additional confirmation. This crossover suggests a shift in momentum from bearish to bullish, aligning with the reversal indicated by the Bullish Tri-Star Pattern.

Volume

High trading volume during the formation of the Bullish Tri-Star Pattern suggests a stronger potential reversal. Increased volume indicates significant market interest and participation, lending credibility to the pattern and the likelihood of a sustained bullish reversal.

Common Mistakes When Trading the Bullish Tri-Star Pattern

Ignoring Market Context

One common mistake traders make is ignoring the broader market context. The Bullish Tri-Star Pattern is most effective when it appears in a well-established downtrend. Failing to consider the overall market trend can lead to false signals and unsuccessful trades.

Overlooking Volume Confirmation

Volume is a critical factor in confirming the strength of the Bullish Tri-Star Pattern. Traders often overlook the importance of high trading volume during the pattern's formation, which can validate the potential reversal. Low volume may suggest a weak or unreliable signal.

Neglecting Stop-Loss Strategies

Proper risk management is essential, and neglecting to set a stop-loss order below the lowest point of the three doji candlesticks can result in significant losses. A disciplined stop-loss strategy helps protect against unexpected market movements.

Misinterpreting Doji Candles

Accurately identifying doji candles is crucial. Traders sometimes mistake other candlestick types for dojis, leading to incorrect pattern identification. Ensuring that the doji candles have small or non-existent real bodies with long shadows is vital for correct interpretation.

Relying Solely on the Pattern

Relying exclusively on the Bullish Tri-Star Pattern without using additional technical indicators for confirmation can be risky. Combining the pattern with indicators such as moving averages, RSI, MACD, and volume helps validate the signal and increase the likelihood of a successful trade.

Conclusion

The Bullish Tri-Star Pattern is a potent tool in technical analysis for identifying potential trend reversals. By understanding how to spot and trade this pattern, and using additional technical indicators for confirmation, traders can make more informed and potentially profitable trading decisions. However, due to its rarity, it's essential to remain patient and wait for clear signals before executing trades.

Also Read: How to Trade the Bullish Belt Hold Pattern

FAQs

How reliable is the Bullish Tri-Star Pattern?

While the pattern is considered a strong reversal signal, it is rare and should be confirmed with other technical indicators to improve reliability.

Can the Bullish Tri-Star Pattern be used in all markets?

Yes, the pattern is applicable across various markets, including forex, stocks, and commodities. However, market-specific factors should always be considered.

What are the key risks associated with trading this pattern?

The main risks include false signals and market conditions not reversing as expected. Using proper risk management strategies, such as stop-loss orders and position sizing, is crucial.


Top 5 Forex Brokers Ranked by Traders in 2025

« Previous
Next »
Leave a Reply

Click here to cancel reply.

GET THE PROPRIETARY ONE CORE PROGRAM
The same system I use to make 6 figures a trade with

5 PART SYSTEM TO MAKE REALLY BIG MONEY IN TRADING

FREE TRAINING

We have generated over millions of dollars via trading with the 5 part system outlined in this free training. Download it now before this page comes down or when I decide to stop mentoring.
 

Services

  • AFM One Core Program
  • Corporate Forex Training
  • Trade Rescue
  • Speak At Your Event
  • AFM One Core Program
  • Corporate Forex Training
  • Trade Rescue
  • Speak At Your Event

Resources

  • Forex Trading Strategies
  • Forex Blog
  • Forex Vlog
  • Download Trading Platform
  • Forex Position Size Calculator
  • Forex Brokers Review & Rating
  • Forex Trading Strategies
  • Forex Blog
  • Forex Vlog
  • Download Trading Platform
  • Forex Position Size Calculator
  • Forex Brokers Review & Rating

Company

  • Who is Asia Forex Mentor
  • Asia Forex Mentor Reviews
  • Contact Us
  • Affiliate Program
  • Advertise with us
  • Best Crypto Broker
  • Who is Asia Forex Mentor
  • Asia Forex Mentor Reviews
  • Contact Us
  • Affiliate Program
  • Advertise with us
  • Best Crypto Broker

Address

6 Raffles Boulevard, #03-308,
Singapore 039594

Whatsapp Text: +65 8786 8319

Disclaimer: Any Advice or information on this website is General Advice Only – It does not take into account your personal circumstances, please do not trade or invest based solely on this information. By Viewing any material or using the information within this site you agree that this is general education material and you will not hold any person or entity responsible for loss or damages resulting from the content or general advice provided here by ECG Pte Ltd, it’s employees, directors or fellow members. Futures, options, and spot currency trading have large potential rewards, but also large potential risk. You must be aware of the risks and be willing to accept them in order to invest in the futures and options markets. Don’t trade with money you can’t afford to lose. This website is neither a solicitation nor an offer to Buy/Sell futures, spot forex, cfd’s, options or other financial products. No representation is being made that any account will or is likely to achieve profits or losses similar to those discussed in any material on this website. The past performance of any trading system or methodology is not necessarily indicative of future results.
High Risk Warning: Forex, Futures, Stocks, Indexes, Commodities, Crypto and Options trading has large potential rewards, but also large potential risks. The high degree of leverage can work against you as well as for you. You must be aware of the risks of investing in forex, futures, and options and be willing to accept them in order to trade in these markets. Forex trading involves substantial risk of loss and is not suitable for all investors. Please do not trade with borrowed money or money you cannot afford to lose. Any opinions, news, research, analysis, prices, or other information contained on this website is provided as general market commentary and does not constitute investment advice. We will not accept liability for any loss or damage, including without limitation to, any loss of profit, which may arise directly or indirectly from the use of or reliance on such information. Please remember that the past performance of any trading system or methodology is not necessarily indicative of future results.

AFM

#1 FOREX MENTOR IN ASIA

©2025 ASIA FOREX MENTOR. All Rights Reserved.

| Disclaimer – Terms of Use | Privacy Policy | Cookie Policy | Privacy Policy – Europe GDPR

English | Français | Deutsch

Facebook-f Youtube Instagram Tiktok Linkedin
Scroll to top

I consent to receiving emails and/or text message reminders for this event.

REGISTER FOR THE MASTERCLASS!