
It sounds serious when you hear that a Death Cross has formed. And for brokers, it is a scary indicator, that marks a shift from a bull market to a bear market. The technical chart pattern shows when a moving average crossover happens. It points to a rapid shift in price, compared to the long-term performance of a stock, cryptocurrency, and other markets.
Investors are aware that there are a lot of variations in the stock market. They try to have access to relevant news and data that will help them while trading. That’s why they are always on the lookout for new tools in the form of technical analysis, that can give them a heads up on market trends.
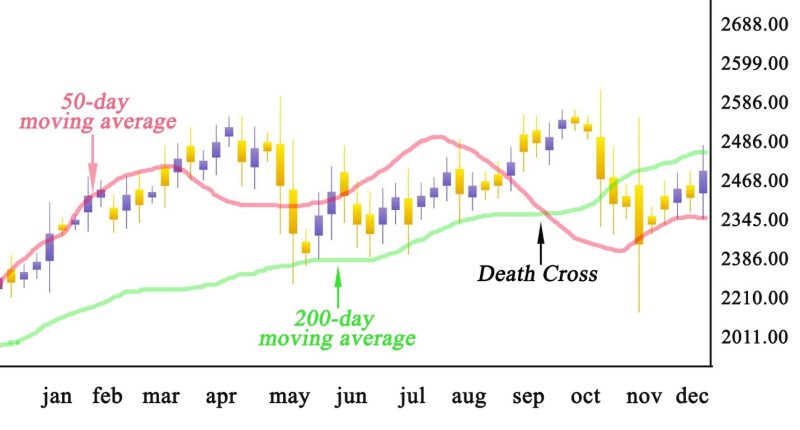
One of these tools is the Death Cross. This technical analysis indicator is used to show a negative crossover of short-term moving average to a long-term moving average. When identifying the pattern, it’s important to remember that it happens when the 50-day moving average (DMA) crosses the 200-DMA. Their convergence can cause an increase in selling pressure, and the price can stay low for months.
Contents
- Connection with the Golden Cross
- Three Phases of the Death Cross
- The Death Cross Pattern is a Negative Signal
- Opportunity for a Long Position
- Conclusion
- FAQ
Connection with the Golden Cross
Everything that goes up must come down. That’s why Death Cross and the Golden Cross go in pairs. If the Golden Cross occurs it is a positive reversal. In this situation, a short-term moving average moves in an upward direction compared to the long-term moving average. This momentum creates positive sentiments. This in turn drives the price in the subsequent sessions. When planning a strategy, it is important to take into account both indicators in the chart patterns.
When several moving averages are converging together it is interpreted as a strong signal of a sell-off. In this case, the downward trend is going to gain strength.
The price may hold around the same moving averages. But when the price goes below the moving averages. Then the selling pressure will increase. If this happens, any corrective moves will cause strong resistance at higher levels. The selling pressure declines as these moving averages start turning upward.
Three Phases of the Death Cross
There are three stages in the formation of the pattern. The first stage presupposes the present uptrend of the asset. When it reaches its peak the buying momentum starts to decline. Then the price falls, and sellers gain the upper hand in the market.
The second stage is the down trend in the price of the securities. This is the point where the Death Cross occurs. The downside shift of the 50-day average signals a bearish long-term trend in the market.
The final phase is the downward trend in the market. The new trend needs to continue developing for a real Death Cross have occurred. If the momentum is short, and the stock changes direction and goes up, then it is a false signal.
The Death Cross Pattern is a Negative Signal
The indication of a possible Death Cross comes when the charts show the moving averages get closer. The rising of stock prices is signaling selling pressure and is representing higher levels of resistance. This aspect enables short-sellers to register a change in the trend.
You can also see, that all other technical patterns show negative signals in their parameters. The deference in the stock trajectory will be obvious from the market chart.

The Death Cross Occurs for Bitcoin
Since the beginning of the summer, analysts have been watching to see if Bitcoin would form a Death Cross. Investing in cryptocurrency was lucrative for years. But the news was not positive for investors on June 21. Confirmation that the threshold was passed, created waves in the markets.
Bitcoin’s 50-day moving average crosses below its 200-day moving average, triggering a Death Cross. This caused a reason for concern to some traders. For a short period, the price briefly fell below $29,026. In effect erasing the gains, it made in 2021, before climbing back above $32,000.
Restriction on Crypto
Many factors may have contributed to the decline. China placed restrictions on crypto mining. It also banned financial institutions from offering crypto services.
The new situation has motivated some investors to sell their shares. While others think this is a good opportunity to buy. Trading with the pre-existing strategy can bring benefits when the trend reverses.
For Bitcoin, this isn’t its first run-in with the Death Cross. It experienced a drawdown in March 2020. But by the time the Death Cross emerged on the charts. Bitcoin had already moved past its lows. The price rallied shortly thereafter. That time the price movement brought confidence back in crypto, but this time it might be different. Especially if outside factors make continued pressure on digital assets.
Opportunity for a Long Position
The Death Cross is an indicator of what has already happened. It is not a precise signal for bearish movements in the future. Periods of decline can also be followed by intense gains or even a Golden Cross.
That’s why crypto investors are used to market swings. Some see a downturn as an opportunity for investing in their long-term positions.
Conclusion
Technical analysts look for many indicators. The Death Cross is a lagging indicator. It can predict a large bear market, but it frequently produces false signals.
If it occurs it should always be confirmed with other indicators before trading. The Death Cross pattern preceded the crash of 1929. Four months before the 2008 crash, a Death Cross occurred in the S&P 500 Index. That’s why more investors search for news and market variation, which can help in determining when the short-term average crosses below a long-term average trendline.
FAQ
How long does Death Cross last?
It depends on many factors. There have been cases when it is a daily phenomenon. But it can also last for months sometimes a year.
What is Death Cross in Crypto?
In crypto, it is an indicator that a process of decline has begun. The market is losing confidence in the cryptocurrency that is being traded and the price is declining.
How do you trade a Death Cross?
Investors use it when trading to make a prognosis about what moves they need to make. Time frames help traders to focus on the type of price action they need to make. Day traders focus on lower time frames. While position trader focuses on higher time frames.
Is gold in a Death Cross?
The Death Cross is an indicator of a market trend. The asset that brokers are trading can be anything, including gold.


