Have you ever wondered how the Fibonacci Circle helps explain why prices stop or reverse at certain points on a chart?
It’s built on the Fibonacci sequence and golden ratio , guiding traders through market dynamics and future price movements. Each circle is drawn between two extreme points along a trend line, marking potential support and resistance levels. The circles are drawn at separate levels in association to Fibonacci Ratios of 23.6%, 38.2%, 61.8%, and 78.6%. This indicator based on the Fibonacci ratios highlights key Fibonacci ratios that align with Fibonacci retracement levels. Used with other technical analysis tools, fib circles reveal potential reversal points and help manage risk. They transform mathematical beauty into practical insights for financial markets.
What is Fibonacci Sequence
The Fibonacci sequence began with the Italian mathematician Fibonacci, who discovered a simple pattern with deep meaning. Each Fibonacci number is the sum of the two before it, forming a natural sequence that appears everywhere, from flower petals to DNA strands. Many flowers have petals that follow Fibonacci numbers, while sunflower seeds grow in spiral patterns shaped by the golden ratio. This divine proportion, represented by phi (Φ ≈ 1.618), creates balance and beauty in nature and art. Even honeybee families and nautilus shells grow in patterns close to the Fibonacci spiral, showing how mathematics reflects life’s perfect design.
In geometry, the Fibonacci sequence forms the base for the golden rectangle and golden spiral—two icons of mathematical beauty. When quarter circles are drawn inside squares with side lengths matching Fibonacci numbers, a golden spiral emerges. This design appears in many corporate logos and works of art, where harmony and proportion attract the human eye. Just like market prices on a price chart, nature follows balance through this ratio. While prices generally fall and rise, the same rhythm appears, patterns, symmetry, and structure that work vice versa across all market conditions.
How to Calculate the Fibonacci Arcs
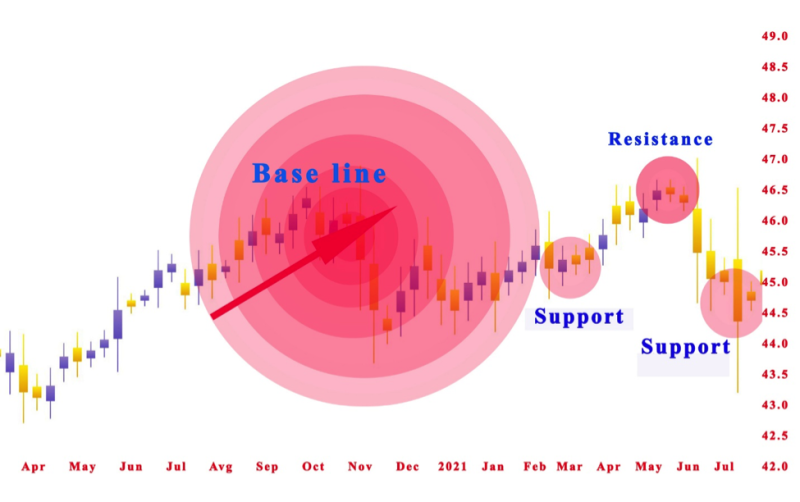
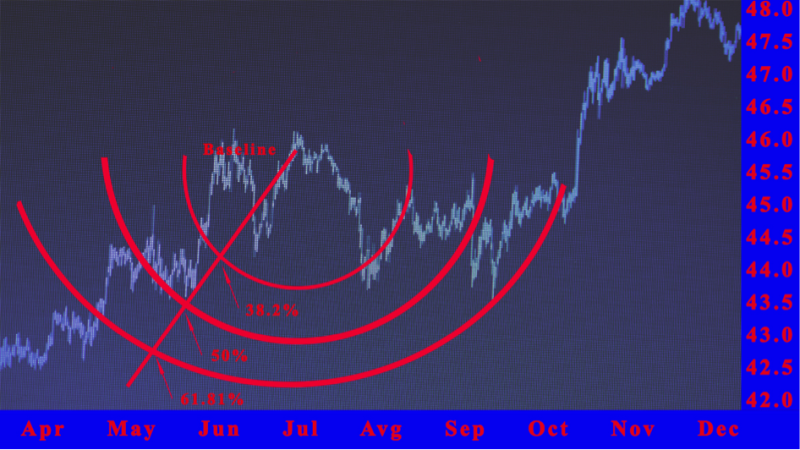
Step 1: Begin by identifying two starting points on the price chart, a recent swing low and a swing high. These two extreme points create the baseline, which becomes the foundation of your Fibonacci arcs. Most charting software can draw these arcs automatically, but understanding the manual process builds skill and confidence.
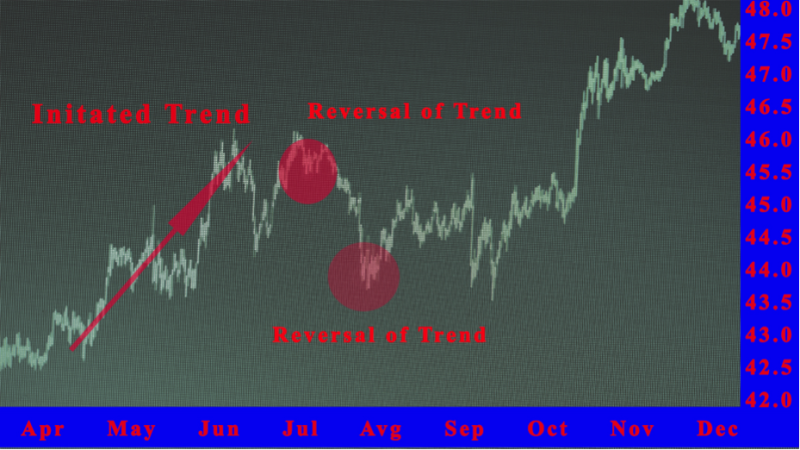
Step 2: When an uptrend appears, connect the forceful previous swing low to the new swing high. This trend line acts as the guide for measuring the move’s full value. The line helps traders visualize where potential reversal levels may occur as prices generally fall or rise.
Step 3: The charting tool will then draw arcs that bisect the baseline at 23.6%, 50%, and 61.8%, the key Fibonacci ratios. Each arc represents a potential support level or resistance zone. These arcs expand outward, forming smaller circles and a higher circle depending on the trend’s strength.
Step 4: When an arc crosses a Fibonacci level, create a circle using point A as your anchor. Begin the drawing from the 23.6% level, ensuring the circle reaches up to point A. Use the same method for the remaining percentage levels, adjusting as market conditions shift.
Step 5: For a downtrend, connect the swing high to a swing low to form the opposite direction baseline. Measure the same Fibonacci percentages and add them to point A to locate crossing points. Then, draw arcs from that anchor, noting how each lower circle reacts as price remains or prices break through the levels.
Trading with Fibonacci Circles
Trading with Fibonacci Circles begins by identifying important arc levels on the price chart. These levels, based on the golden mean, show where price action might slow or reverse. Traders study how the market behaves when prices move closer to each arc, observing patterns that often lead to strong signals.
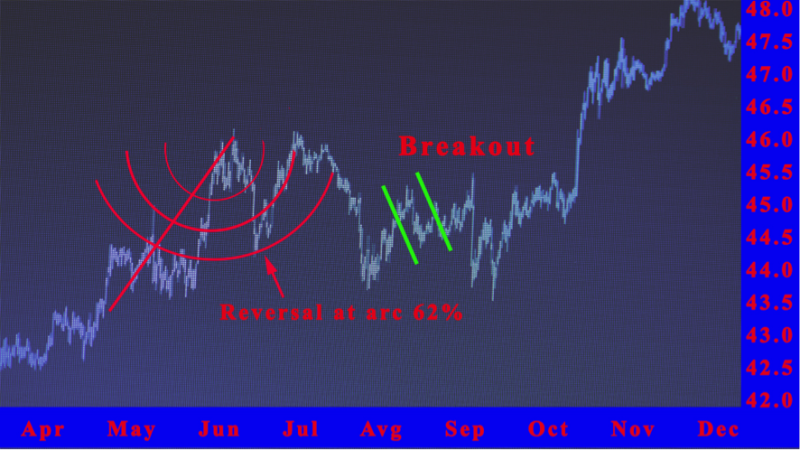
When prices rise and break above a key Fibonacci arc resistance, such as 38.2%, 50%, or 61.8%, traders may consider buying. The next higher arc becomes a possible profit target or an area to sell. This method helps traders understand price reversals and plan their entries with discipline.
A common strategy involves waiting for a collapse or pullback near these arcs. Because arc levels are rarely tracked by most traders, they act as hidden support and resistance zones. For example, if prices fall under the 61.8% arc and close below the reversal bar, traders may enter short positions while confirming signals with moving averages or other tools.
Fibonacci Arc vs. Fibonacci Retracements
Fibonacci Arcs and Fibonacci Retracements both come from the Fibonacci sequence and share the same baseline for accuracy. When drawn on a price chart, they intersect at the same point where the Fibonacci Circle crosses the trend line. The retracement tool uses horizontal lines that mark support and resistance levels, while the arcs curve across time and price. Both tools help traders identify potential reversal areas in financial markets, but they display them in different patterns.
The main difference lies in how they move with price action. Fibonacci retracements stay fixed, providing consistent reference points for support and resistance levels. In contrast, Fibonacci circles adjust with the changing arc radius, making them dynamic and time-sensitive. Together, these tools offer a balanced view of price behavior, helping traders anticipate price reversals and manage entries when prices break or react near key Fibonacci ratios.
Disadvantages of Fibonacci Arcs
Fibonacci arcs can be helpful, but they come with several challenges traders must understand. They only suggest probable support and resistance areas, not guaranteed price reactions. Because there are many arcs, it is difficult to know which one will actually influence the price. Sometimes, price may pass through several arcs before reacting, creating confusion for new traders. Many use Fibonacci arcs with other technical analysis tools to confirm signals, but relying only on arcs can cause false expectations when price remains quiet or suddenly moves before confirmation.
The Golden Ratio in Fibonacci Circles
In trading, Fibonacci circles apply the same harmony seen in nature. The arcs created between price swings reflect the same proportions found in a golden rectangle or Fibonacci spiral. Traders use these fib circles to identify balance points, potential support levels, and turning zones on the price chart. Whether in art, nature, or markets, the golden ratio remains a timeless guide. It shows that the patterns shaping flower petals also shape price behavior, connecting mathematics and market psychology into one elegant sequence.
Fibonacci Circles with Other Technical Analysis Tools
• Using Fibonacci Circles with Trend Lines
Fibonacci circles work best when combined with a clear trend line connecting significant highs and lows. The circles highlight potential turning points that align with trend direction. This pairing helps traders confirm when price action respects natural balance guided by the golden ratio.
• Pairing Fibonacci Circles with Moving Averages
Moving averages smooth out price movement, while Fibonacci circles reveal hidden timing zones. When both tools align near a support or resistance level, reactions often become stronger. This combination gives traders confidence in identifying balanced entries during different market conditions.
• Combining Fibonacci Circles with Support and Resistance Levels
Support and resistance zones mark where prices often pause or reverse. When Fibonacci circles overlap with these levels, traders gain extra confirmation of potential reversals. The overlap reflects harmony between price behavior and the natural rhythm of the Fibonacci sequence.
• Applying Fibonacci Circles with Price Patterns
Traders can use fib circles to analyze breakout points within different patterns like triangles or flags. When a price reaches the curve edge, momentum often shifts direction. This visual approach makes recognizing trend continuation or reversal easier for beginners learning technical analysis.
• Integrating Fibonacci Circles with the Golden Ratio Concept
Every Fibonacci circle is rooted in the golden ratio, creating symmetry that helps visualize timing and proportion. When circles expand between higher and lower swings, they reflect market energy cycles. Traders using this insight can read the market’s rhythm more naturally and make thoughtful decisions.
Also Read: Fibonacci Trading Strategy Full Verdict
Conclusion
The Fibonacci Circle shows how mathematics and market behavior can work together in perfect rhythm. It teaches traders to see structure within uncertainty and balance within volatility. Though not always exact, its patterns help identify potential support and resistance zones with better timing. Like the Fibonacci sequence in nature, price movements often repeat in measured and predictable ways. When used with patience and other technical analysis tools, Fibonacci circles become a guide for understanding market psychology. Traders who learn to read these curves can manage risk wisely and move with the natural flow of price action.
FAQs
How do You Read a Fibonacci Circle?
Fibonacci Circles are drawn at 11 different levels according to the key Fibonacci Ratios. The half-circle arcs display where the price can locate support or resistance in the future.
How does Fibonacci Spiral Work?
Traders create the Fibonacci spiral by choosing a starting point and then constantly rising the width of points along the Fib spiral by engaging a Fibonacci ratio.
How are Fibonacci Spiral Created?
The Fibonacci spiral is created by building arcs that relate the points of squares established on the Fibonacci sequence that are assembled in a spiral pattern.
How do You Draw Fibonacci Arcs?
Fibonacci arcs are drawn with associating important price points, such as a swing high and a swing low. Then a baseline is drawn amid these two points and then the arcs displays where the price could backtrack or bounce off.