

Technical indicators are among some of the best trading tools you can employ as a trader to improve your trading results. When used correctly they can be the difference between a profitable trader and a struggling trader. For this reason, it is important to understand what indicators are, which one's fit into your trading strategy, and how you can use them to your advantage.
Technical indicators are tried and tested trading tools that help traders predict the price action or market movement of a specific underlying asset. In this article, we will take you through one such indicator known as the fisher transform indicator.
Here you will learn what the fisher transform indicator is and how to use it to improve your trading results.
Also Read: How Do You Trade With A Volatility Indicator?
Contents
- What is the Fisher Transform Indicator?
- How is the Fisher Transform Indicator Applied?
- Conclusion
- FAQs
What is the Fisher Transform Indicator?
The fisher transform indicator is a technical analysis indicator that is characterized by two horizontal lines which oscillate between the -2 to 4 values. The first line is referred to as the fisher while the second line (signal line) is referred to as the trigger. This indicator gives traders trading signals as they can identify when an asset has been overbought or oversold.

Traders also watch for the fisher to cross/intersect the trigger as an indication of the formation of a new trend. The fisher transform indicator works within the same concept as other technical indicators which concentrate on price distribution. Examples of such indicators include the Moving Average, MACD indicator, and Bollinger Bands.
This indicator was discovered by John F. Ehlers, hence the name Fisher. John Ehlers was a renowned academic and trader who had specialized in several financial markets.
While using the fisher transform indicator could be considered relatively easy, it is not very popular among traders. This could be attributed to the fact that it is not inbuilt (available) in most trading platforms. To use it, you would have to download separately then add it to your trading platform.
As it is a price distribution indicator, the fisher transformation can be used to trade stocks, forex, or even commodities. Due to the volatility of these markets and the leading nature of the fisher transform indicator offers numerous trading opportunities to traders. Leading indicators predict future prices while lagging indicators analyze past prices and trends.
Below is an image of the fisher transform indicator on the GPB/JPY 4-hour chart. It is located on the bottom pane and marked as Fisher 9. This is because the default calculation of the fisher transform indicator is usually 9 periods.
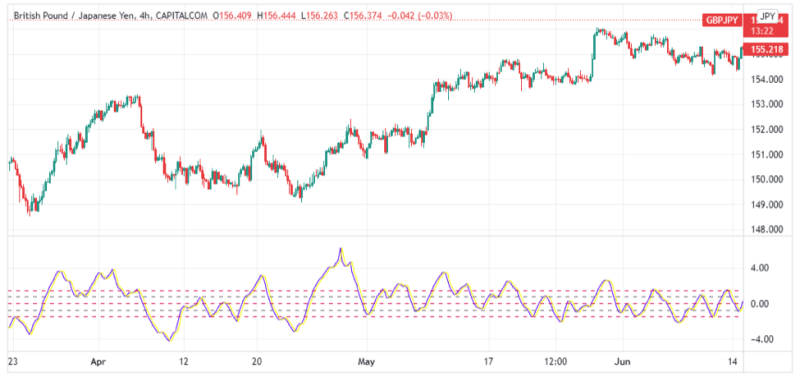
The fisher transform indicator translates an asset’s price into the Gaussian normal distribution. Simply put, it enhances (makes clear) an asset’s price by showing the turning points in the form of a bell curve. This alone makes it easier and more convenient for traders to spot both market trends and market signals for a price reversal. It can thus be used both as a continuation strategy or a reversal strategy.
Usually, asset prices are not normally distributed and can vary between the two extremes. When such price moves happen, due to the nature of a bell curve, the fisher transform indicator might not give an accurate price impression.
How is the Fisher Transform Indicator Applied?
As mentioned above the fisher transform indicator can be used either as a trend continuation strategy or as a reversal strategy.
· Fisher Transform reversal strategy
As a price reversal strategy, the key areas to watch would be either of the extremes i.e., 4 or -2 depending on current market direction and the 0.00 midpoint.
Bullish Reversal
In the case of a bullish reversal, the fisher transform indicator would have to be trading consistently above the 0.00 midpoint and close to or above the 4.00 mark. These readings signify potential trend reversals, and in this case, can be considered as sell signals. When the two lines intersect at this point, followed by a sharp change in direction, it is a strong indication of a bearish price movement.
As a confirmation, prices should have been continuously rising above the D midpoint signaling that the underlying security has indeed been overbought giving traders a sell signal. Below is an illustration of the fisher transform strategy in the GBP/JPY 4-hour chart.
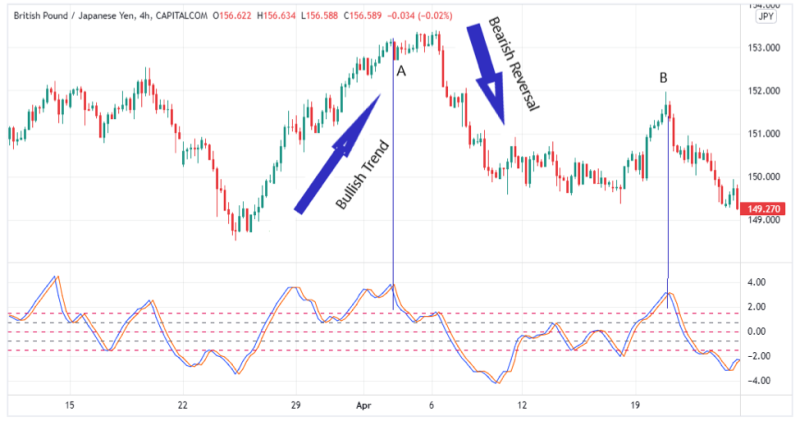
In the figure above, compare regions marked A and B. Note that in both regions the Fisher reading was close to the 4.00 mark. This is the first indication of a price reversal. The second indication is the two fisher transform lines crossed at this point confirming a bearish reversal.
However, you will note that in region A the reversal did not happen immediately while in region B the reversal was instant. For this reason, it is advisable to use the fisher transform indicator together with other indicators such as the Moving Average, Relative Strength Index, and Bollinger Bands for better results.
Bearish reversal
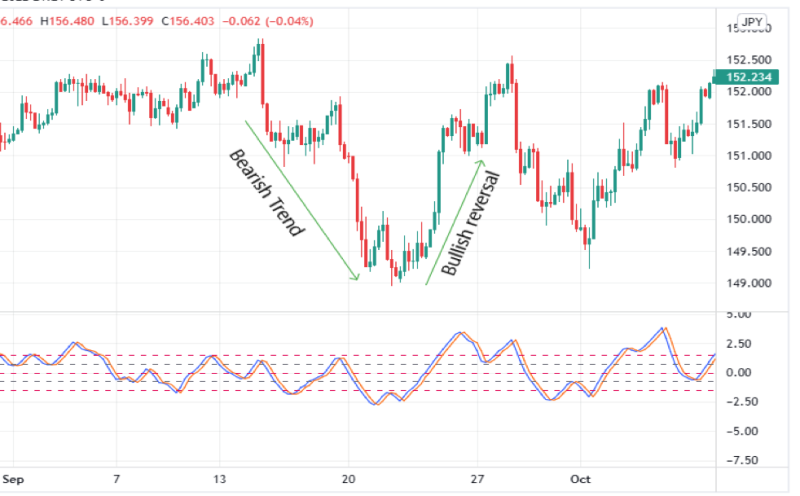
The image above illustrates a bearish price reversal. Note that the price changed direction from a bearish trend to a bullish trend after the fisher transform indicator lines crossed each other close to the -2.0 mark.
When using the fisher transform indicator to indicate potential trend reversals, it is important to note that buy orders (long trades) ideally occur when the fisher indicator reading is negative. The inverse is also true, sell orders (short trades) ideally occur when the fisher indicator reading is positive. This is because these two values indicate overbought and oversold markets thus helping traders decide on entry and exit points.
· Fisher transform as a continuation strategy
When the market is in a clear trend, the fisher transform indicator can be used to find ideal entry positions along the trend line. This is possible as it indicates the overbought and undersold levels of a specific asset. When a market is overbought, the reading should be close to the 4.00 mark.
For instance, when in a clear uptrend, the fisher transform can be used to find clear buys and sells as the prices of an asset continue increasing. While in a clear downtrend, the fisher transform will assist you open short trades (clear sell signals) that align with a down-trend market.
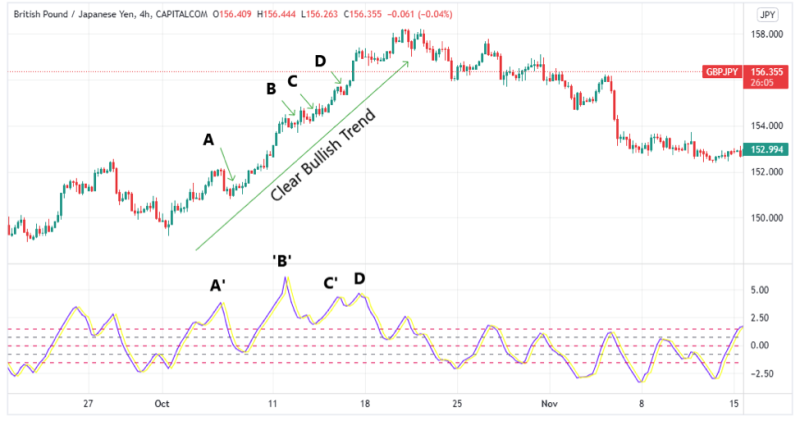
The above image clearly illustrates how to use the fisher transform indicator to identify buys and sells along with a trend. Note the regions market A, B, C, and D. These regions are present potential reversal zones. However, the fisher reading does not go below the 0.00 midpoint and hence the market continues on the uptrend presenting numerous buy options for traders.
Note that the fisher transform indicator behaves in a similar way to the market, i.e., followed the direction of price. Since it is a leading indicator, it would have helped traders identify these buy and sell opportunities in a bullish trend.
Also Read: Best Forex Strategy For Consistent Profits
Conclusion
Using the fisher transformation to transform prices to a Gaussian Normal Distribution helps traders identify turning points more conveniently as opposed to using candlesticks. This strategy allows more traders to be profitable in the long run. As mentioned above it is advisable to use two indicators (or more) for better results.
It is important that usually, assets prices are not normally distributed, and hence transforming the prices to a normal distribution might offer flawed results.
The information provided in this article is meant for educational purposes and thus should not be considered as financial advice.
FAQs
What is inverse Fisher transform?
The inverse Fisher transform applies mathematical functions in the form of constants to a weighted moving average of the relative strength index of the closing price to calculate its oscillator position. It is different from the fisher transform in that it allows you to input data such as the close price.
What is the difference between the fisher transform and stochastic indicator?
While these two indicators work in the same way, they differ in how they are calculated. The stochastic indicator is calculated by subtracting the lowest low from the current close and then subtracting the lowest low from the highest high. The Fisher transform is calculated as the 3-day SMA of the stochastic indicator.


