Have you ever wondered how the Gann Square of 9 helps traders predict turning points in the financial markets? This classic analysis tool, created by William Delbert Gann, connects price, time, and geometry in a simple yet powerful way. It shows how natural cycles and numerical relationships influence price levels and market shifts.
Using the Gann calculator , traders can find key support, resistance, and sell levels based on cardinal and ordinal crosses. Whether used for intraday trading , futures, or stocks, the Gann Square of Nine helps identify when the current market price aligns with critical angles and time windows. Once understood, this method turns complex price action into a clear trading guide grounded in Gann theory.
The Mind Behind Gann’s Square of 9
William Delbert Gann was a trader who saw the market differently. He believed numbers and time had a rhythm. His idea of squaring price came from studying how price and time often move together at geometric angles. When a price reaches a specific angle, it often reacts or slows down. That reaction forms key levels that may act as potential support or resistance.
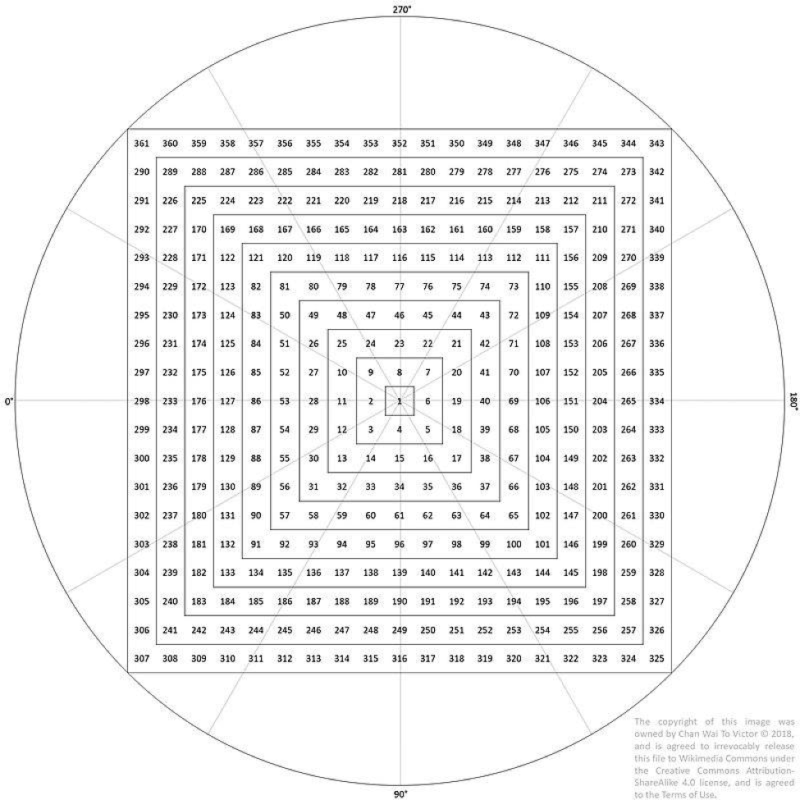
Gann’s method used simple calculations like square roots and degrees to find repeating key numbers. He noticed these numbers move in a spiral form from the center of the Square of 9. Every pivot and swing on a chart could be measured precisely using Gann angles and time analysis. Even now, many traders in forex, stocks, and commodities still watch these angles. They use them to spot shifts in market momentum that most other indicators often miss.
What Exactly Is the Gann Square of Nine (Square of 9)?
The Gann Square of Nine, also called the Square of 9, is one of the simplest yet most powerful trading tools. It helps traders understand how price and time connect within the market. The idea is to find natural turning points where price may slow down, reverse, or gain strength. This method gives traders a clear way to see support and resistance levels without relying too much on complicated indicators or formulas.
The Gann Square of 9 Calculator makes this method easy for beginners to use. It doesn’t require deep math or technical knowledge. You simply enter the last traded price or the average traded price, and the calculator works out the Gann angles for you. These angles show where potential support or resistance may appear as the price moves. It’s like having a trading map that helps you plan your next step with confidence.
Once the Gann Square of Nine Calculator finishes its calculations, it gives clear buying and short selling levels with suggested targets and stop losses. Traders also use it to define stop-loss levels based on these calculated points. This helps manage risk and protect profits more effectively. The best part is that everything is already laid out, so even new traders can follow it easily and trade with a structured plan in mind.
Understanding Gann Theory
Gann theory explains how the market follows natural order through price, time, and movement. Gann’s work showed that prices move in measurable patterns, not random ones. He believed that when the current price aligns with a specific angle, the market reacts. These angles, called Gann angles, form the base of Gann’s Square of 9. Traders use them to identify key levels of support and resistance levels based on time and value. Gann also taught that cycles begin again each time the market opens, helping traders sense momentum and structure in every move.
How the Gann Calculator Works
Step 1: Input the Price Value
Enter the current price or last traded price into the Gann calculator. This is the starting point for every calculation. It acts as the first square or the center from which other key numbers are measured.
Step 2: Calculate Gann Angles
The calculator uses degrees to form Gann angles, mapping out how far the price may rise or fall. Each angle connects to a cardinal cross on the chart, helping traders predict reaction zones with more accuracy.
Step 3: Identify Resistance and Support
After calculation, the Gann calculator marks potential resistance levels based on the angles drawn. These help traders find pivot zones where price could shift direction. It gives a clear sense of when the market may pause or move again.
Step 4: Check for Accuracy and Errors
The Gann calculator ensures every angle and number is measured precisely to reduce error in analysis. This keeps every reading as accurate as possible, even when applied across forex, stocks, or commodities.
Step 5: Apply and Review the Results
Traders study the generated key levels before entering the market. They look for how these numbers align with other indicators or the cardinal cross. The goal is to form a clear conclusion about market direction that feels structured, logical, and confident, just as Gann intended.
The Cardinal Cross and Ordinal Cross Explained
The Cardinal Cross and Ordinal Cross are at the heart of the Gann Square of 9. They help traders understand how price reacts to movement and time. The Cardinal Cross represents the strongest turning points, where price often finds support or resistance. Think of it as the market’s main compass, pointing to north, south, east, and west. These four directions reflect the key levels that guide market behavior around important angles.
The Ordinal Cross sits between those main directions, marking smaller but still powerful reactions. While not as strong as the Cardinal Cross, it helps traders spot short-term pauses or reversals in the market. Together, both crosses create a balance, showing how the market flows between major and minor levels. Traders often watch these points carefully because they can signal upcoming shifts in momentum or trend.
To make this clearer, let’s look at an example. Imagine the market moving upward and touching a point on the Cardinal Cross, this may create resistance before the price slows down. If it continues, the next Ordinal Cross might act as the next pivot or breakout zone. Around the world, traders use these patterns to read the market’s rhythm and make better decisions based on what they see unfold.
Can You Use the Gann Square of Nine for Intraday Trading?
Yes. The Gann Square of Nine can be used for intraday trading, but it works best when applied with patience and structure. It helps traders find short-term support and resistance levels, giving a clearer view of daily market movements.
-
Wait for the Market to Open
Before using the Gann calculator, allow the market to settle after the market opens. This gives time for early price swings to balance. Once the chart forms structure, the readings become more accurate and reliable. -
Find the Current Price Level
Use the current price as your base when applying Gann’s Square of 9. This helps the tool calculate intraday turning points. It also shows where traders might see potential support or resistance within the same trading day. -
Watch the Gann Angles Closely
As the day progresses, monitor the Gann angles to see how price reacts. These angles often signal where short-term momentum might shift. A strong reaction to an angle may hint at an upcoming buy or sell opportunity. -
Compare with Other Indicators
Combine your Gann Square of Nine readings with simple indicators like moving averages or trendlines. This gives a more complete picture of market direction. It also reduces error, helping traders confirm entries with more confidence. -
Manage Risk with Stop-Loss Levels
Always define clear stop-loss levels based on Gann’s calculations. This protects profits when price moves unexpectedly. With discipline and practice, intraday trading using Gann’s method can become a precise and rewarding strategy.
Common Mistakes Beginners Make with the Gann Square of 9
-
Using It Without Understanding the Basics
Many beginners jump into the Gann Square without learning how it really works. They treat it like a magic formula instead of a structured tool. To use it well, traders must first understand how price and time connect through Gann’s simple logic. -
Ignoring the Current Market Context
Some traders forget that the Gann Square works best when the current price and trend are clearly defined. They apply it blindly to any chart. Always remember, the market must first show structure before applying Gann’s calculations. -
Misreading Angles and Levels
New users often mistake random points as Gann angles or key levels. This leads to confusion and wrong decisions. Every angle must be drawn carefully to match the true price movement on the chart. -
Expecting Instant Results
Many beginners want fast profits using Gann’s work right away. But this method rewards patience and observation, not speed. Learning how to read price reactions around angles takes time and experience. -
Skipping Confirmation with Other Tools
Some traders rely only on the Gann Square, ignoring other indicators that confirm the trend. Gann himself used multiple tools to verify his readings. Always combine it with simple methods like support, resistance, or volume checks to stay safe.
Also Read: How to Trade Futures – A Beginner’s Guide
Conclusion
The Gann Square of 9 is not just a trading tool, it is a guide to understanding how the market truly moves. It helps traders see how price and time work together in repeating patterns. With practice, it becomes easier to spot key levels where the market might slow down, reverse, or find strength. Learning to read these patterns brings confidence and structure, even in fast-changing conditions.
Mastering Gann’s work takes patience, observation, and consistent study. Each calculation and angle teaches a lesson about rhythm and timing. The goal is not only to predict but to understand. Over time, you will see that trading is not about guessing, it is about listening to what the market is quietly telling you through the Gann Square of Nine.
FAQs
1. What is the main purpose of the Gann Square of 9?
The Gann Square of 9 helps traders find possible support and resistance levels in the market. It uses numbers, angles, and time to show where the price may react. Beginners can use it to plan entries, exits, and manage risk more clearly.
2. Do I need advanced math to use the Gann calculator?
No. The Gann calculator is beginner friendly and does the calculations for you. You just enter the current price, and it shows key levels like buying, selling, and stop-loss points. It makes using Gann theory simple and practical for daily trading.
3. Can I use the Gann Square of Nine for intraday trading?
Yes, but it needs patience and practice. The Gann Square of Nine works best after the market opens and settles. It helps traders see short-term support and resistance zones, making intraday trading more structured and less confusing for beginners.