
GBP/USD experienced a decline due to renewed US Dollar (USD) strength, losing 0.7% over the past week. The pair is currently trading within a narrow range during the European morning session, and the technical outlook indicates that the bearish sentiment remains dominant.
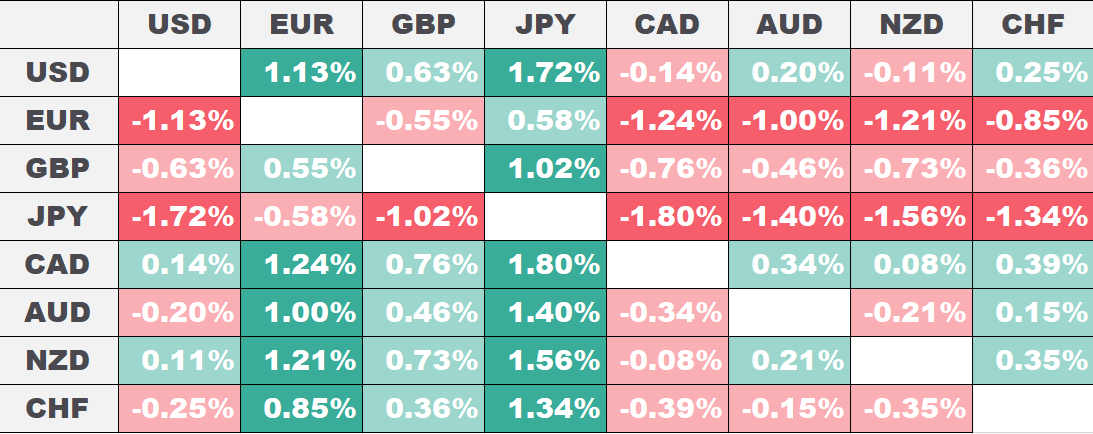
Positive macroeconomic data from the US bolstered the USD in the latter half of last week. On Friday, the Bureau of Economic Analysis reported that the core Personal Consumption Expenditures (PCE) Price Index, the Federal Reserve’s preferred measure of inflation, increased by 0.2% month-over-month, matching expectations. This data helped the USD continue its recovery through the weekend.
The economic calendar for Monday lacks any significant data releases likely to impact GBP/USD movement. Additionally, with US financial markets closed for the Labor Day holiday, the pair may continue to trade sideways.
Later this week, the ISM will release the Manufacturing and Services PMI data for August. The focus will also be on Friday’s August jobs report from the US Bureau of Labor Statistics, which will include key figures such as Nonfarm Payrolls, the Unemployment Rate, and wage inflation.
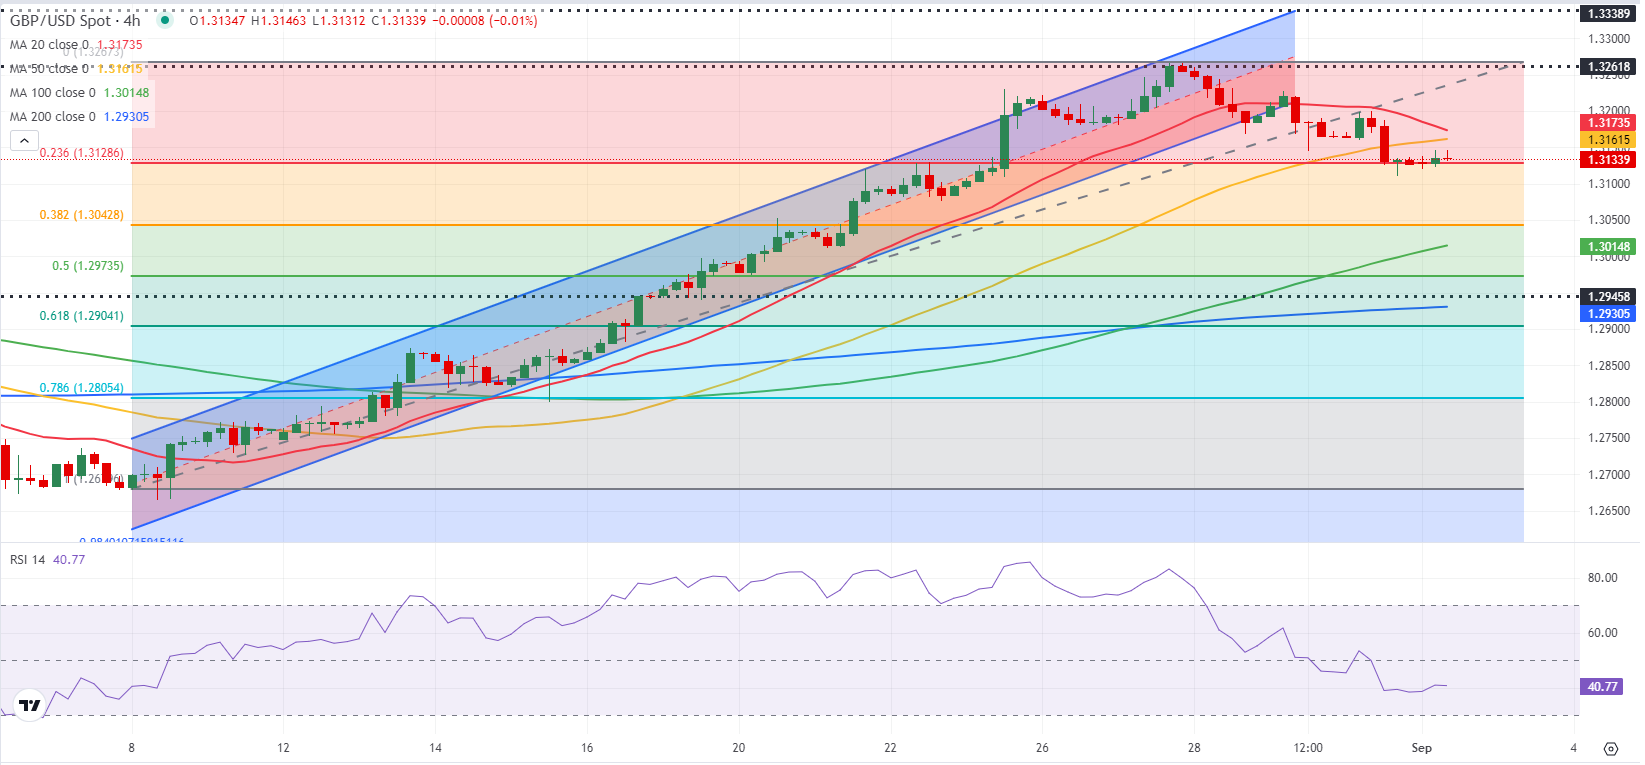
GBP/USD remains below both the 20-period and 50-period Simple Moving Averages (SMA) on Monday. Meanwhile, the Relative Strength Index (RSI) hovers around 40, suggesting limited potential for a recovery.
On the downside, immediate support is seen at 1.3130 (Fibonacci 23.6% retracement of the recent uptrend). A break below this level and subsequent use as resistance could see the pair targeting 1.3100 (static level) and then 1.3050 (Fibonacci 38.2% retracement).
On the upside, the first resistance zone is found between 1.3160-1.3170 (50-period SMA, 20-period SMA), followed by 1.3200 (static level, psychological level) and 1.3260 (end-point of the uptrend).