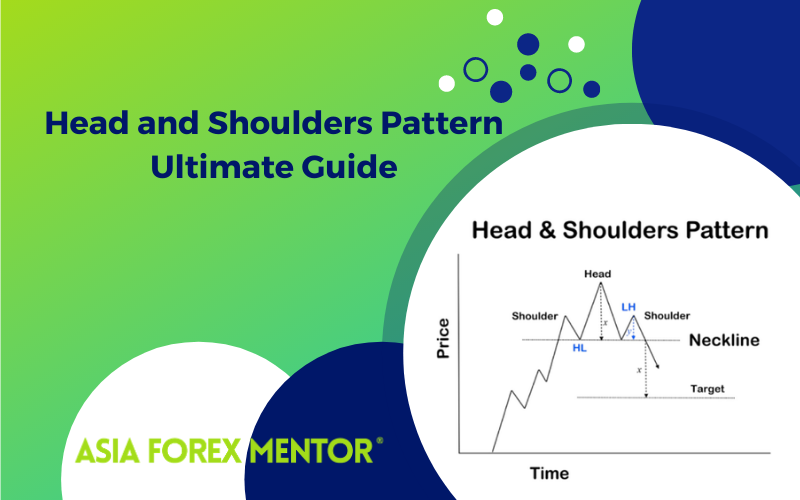
Head and Shoulders Pattern
A head and shoulders pattern is a chart formation that appears as a baseline with three peaks, the outside two are close in height and the middle is highest. In technical analysis, a head and shoulders pattern describes a specific chart formation that predicts a bullish-to-bearish trend reversal. On the other hand, the inverse head and shoulders is a formation that appears at the summit of an uptrend, also with three bottoms, with the outside two being close in depth as well and the middle being the lowest amongst them. This chart reversal pattern is usually used frequently by traders everywhere in predicting a trend reversal as it is one of the strategies of highest probability in terms of speculating the end of a trend. In this article, the convers in all the explanations of the head and shoulders can be applied to the inverse head and shoulders patterns as well.
Head and Shoulders Pattern – Quick Setup Tutorial
Content
- Head and Shoulders Pattern Identification:
- Economic Theory of the head and shoulders:
- How to trade the Head and Shoulders Pattern:
- Head and Shoulders Pattern Pros and cons:
- Head and Shoulders Pattern Analysis:
- Conclusion:
- Info:
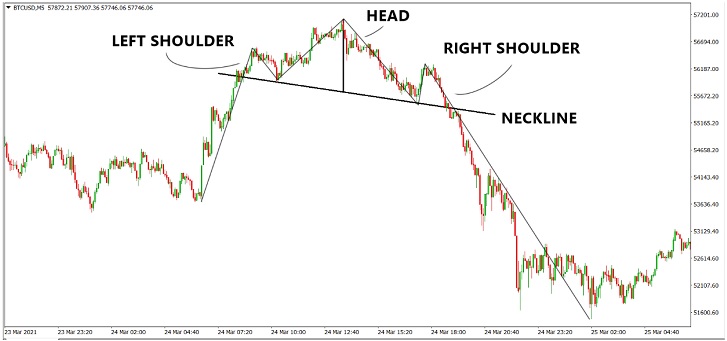
Head and Shoulders Pattern Identification:
To identify the head and shoulders and the inverse head and shoulders pattern, there are a few requirements in the checklists: a neckline, a left shoulder, a right shoulder and a head. Usually, the end of an uptrend is recognised when the price action is unable to break the previous high, hence forming a right shoulder. Once the right shoulder’s peak is formed, traders would standby and plan for a reversal trade. A neckline is then identified at the from the valley between the head and the left shoulder to the valley between the head and the right shoulder as shown below. Conversely, the identification for the inverse head and shoulders pattern is true.
Economic Theory of the head and shoulders:
In the economical point of view the head and shoulders is formed when the bearish momentum outweighs the bullish momentum market. At the peak of the head, the number of sellers in the market increases, leading to a greater increase in the supply of the currency pairing, or the speculative asset. Meanwhile, the number of buyers decrease, causing the demand for the speculative asset to increase but at a lower rate. As a result, the price decreases, leading to a pullback in the market. However, to a certain price point, the turnover rate from sellers to buyers increased as traders believed that it was a reasonable price for an investment in the speculative asset. This in turn causes the number of sellers to decrease while at the same time, the number of buyers to increase. Because of that, the demand for the speculative asset increases at a higher rate as compared to the increase in the supply for the speculative asset leading to a decrease in price. However, this increase in price does not have a strong enough momentum to break the high of the head. As it approaches towards the head, at a certain point the selling pressure outweighs the buying pressure once again. Ultimately, the price breaks below the neckline of the head and shoulders formation and leading to an even greater increase in bearish selling pressure as this is a signal of a head and shoulders break out in terms of technical analysis. Therefore, the price of the asset decreases greatly over a period of time, causing a reversal. This decrease is usually measured in an approximate one is to one ratio with the distance between the peak of the head of the pattern to the neckline in terms of pips. However, this is dependant on the momentum and it has the potential to generate a larger degree of reversal if strong enough.
How to trade the Head and Shoulders Pattern:
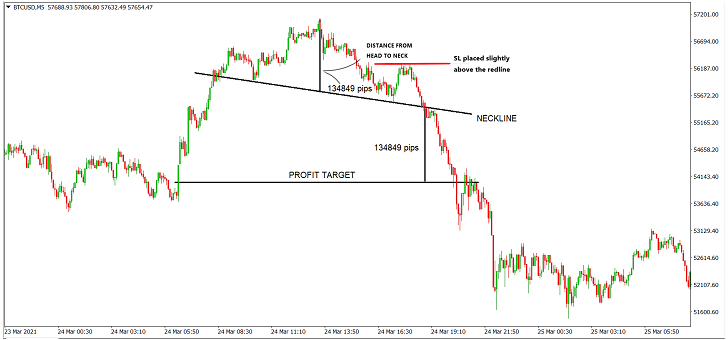
Now, we will explore the common rules and set ups for trading the head and shoulders pattern. Once the head and shoulders pattern is to be identified along with the neckline upon the halfway completion of the right shoulder, the risk and reward can then be recognised as well. Generally, the risk is identified by placing a stop loss just above the peak of the right shoulder, while the reward is to be identified by a one is to one ratio to the distance between the peak of the head to the neckline in terms of pips.

As for the entry, the trade can be taken when the price breaks the neckline. It is crucial for the price to break the neckline as this serves as a confirmation of the chart pattern formation. However, there also other ways to enter a head and shoulders trade. With the help of other indicators, a more aggressive entry can be taken by placing an order right after the formation of the peak of the right shoulder. However, the risk of taking this entry is that without the confirmation neckline break, the market could just be in a short consolidation for a trend continuation causing that aggressive entry to be stopped out. On the other hand, a more conservative approach to this strategy whereby there is a chance of the market breaking the neckline followed by a retest before going any lower. Should that be the case, an entry can be found when the price bounces off the neckline rejection and heads lower. Nevertheless, there is risks of taking this approach despite it being termed a more “conservative approach”. The risk is that if the break down the neckline is strong enough, the price may not retest the neckline but instead plunge straight down strongly to nearing the profit taking level, causing the nice head and shoulders trade to be missed. Most importantly, it is important to see which trading style you belong to before executing the trades as well as to backtest to find out the characteristics of the asset you are trading.
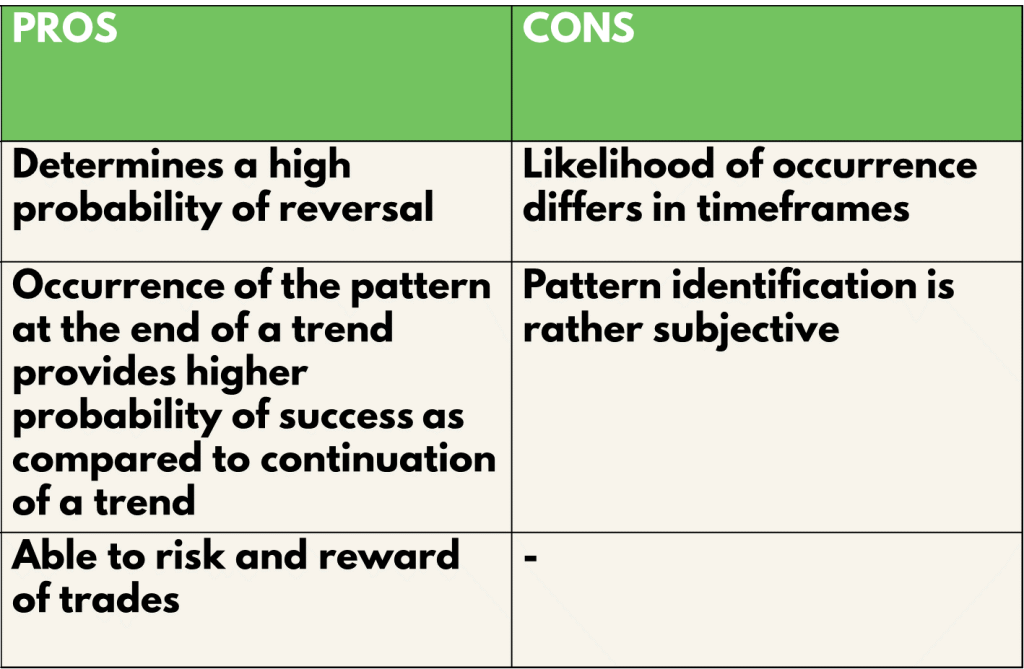
Head and Shoulders Pattern Pros and cons:
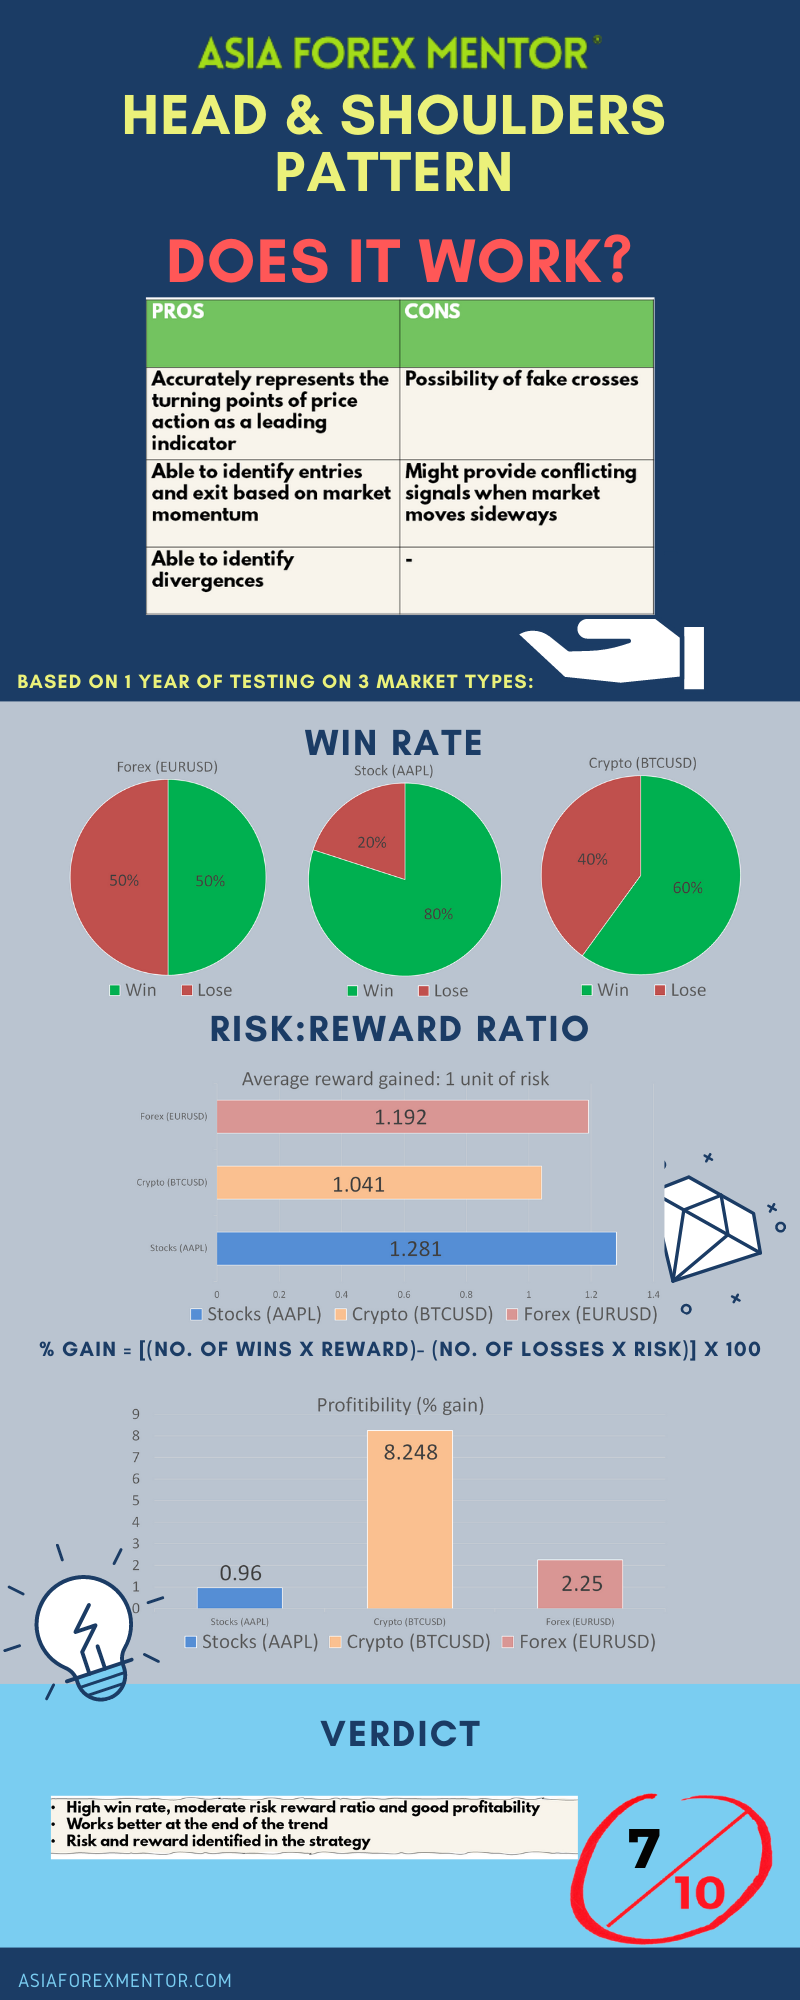
In this section, we will be looking at the pros and cons of using the head and shoulders strategy. It is advantageous to use this strategy in your trading as it is one of the most powerful reversal patterns available with a high probability rate. On top of that, the occurrence of the pattern in different timeframes will also determine their likelihood of success and the degree of impact it will exert on the market. For example, head and shoulder patterns in the higher timeframes are bound to impact the market for a longer period of time and in a larger magnitude as compared to if the pattern occurs in the lower timeframes. Lastly, this strategy allows the measurement of the risk and reward expectations to take in the trade. However, the likelihood of occurrence varies from one timeframe to another. The formation of the head and shoulders pattern occurs more frequently in the lower timeframes as compared to the higher ones mainly due to the fact that the pattern takes a shorter time to form in the lower timeframes. Also, the identification of chart patterns in general are very subjective. In a lot of other education sources, the head and shoulders pattern have a horizontal neckline. However, in reality, this is misleading as the neckline can take the form of trendlines as well. Hence, it is crucial to not just understand the theories of trading but to apply it in backtests as well as trading concepts really come in all sorts of different shapes and sizes.
Head and Shoulders Pattern Analysis:
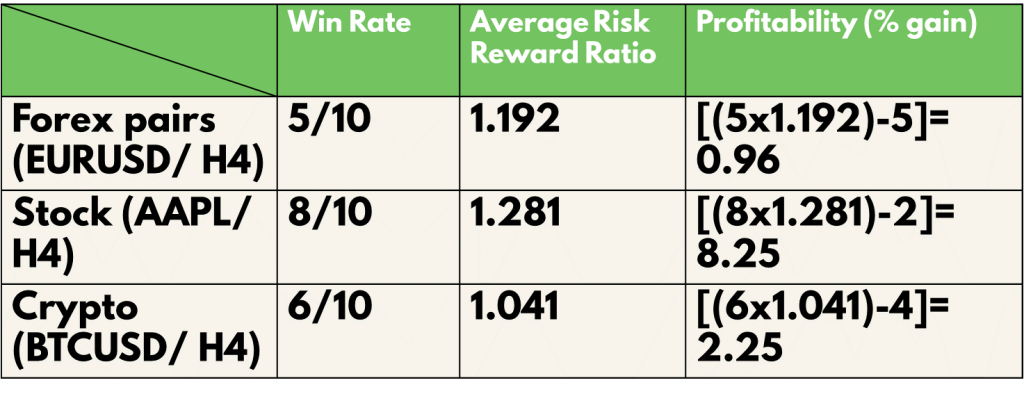
To find out the profitability of the head and shoulders chart pattern strategy, we decided to do a back test based on the past 10 trades from 09 Apr 21 on the H4 timeframe. The rules for entry will be the same as what was mentioned above. We will be back testing this throughout 3 types of trading vehicles, namely, EURUSD for forex, AAPL for stocks and BTCUSD for cryptocurrency. For simplicity, we will assume that all trades taken have a risk of 1% of the account.
Definitions: Avg Risk reward ratio= ( Total risk reward ratio of winning trades/ total no. of wins) Profitability (% gain)= (no. of wins* reward)- (no of losses* 1) [ Risk is 1%]
An example of the application of the strategy is as shown:
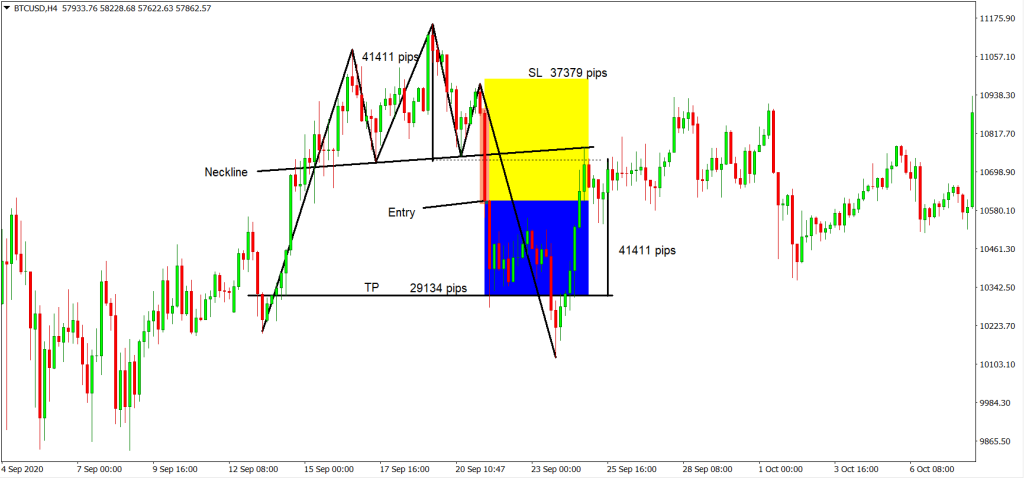
For the Backtest results, trades with blue and yellow zones indicate an overall win with the blue zone as reward and the yellow zone as the risk taken.
As shown in our backtest, the win rate of this strategy for EURUSD (Forex) is 50%, AAPL (Stocks) is 80% and BTC (Crypto) is 60%
The average risk reward ratio of this strategy for EURUSD (Forex) is 1.192, AAPL (Stocks) is 1.281 and BTC (Crypto) is 1.041.
The profitability of this strategy for EURUSD (Forex) is 0.96, AAPL (Stocks) is 8.25 and BTC (Crypto) is 2.25.
Conclusion:
Overall, the head and shoulders/ inverse head and shoulders chart pattern gives an above-average win rate and profitability, but the average risk to reward ratio per trade is slightly below the ideal of 1.5. However, with more experience and indicators, these factors measured can definitely be increased. In hindsight, it is important to understand that while it is more common and powerful to spot a head and shoulders or an inverse one at the end of the trend, it is also possible to find the formation of these patterns in the midway of a trend continuation pullback. Especially when it is a sharp one. Also, it is important to understand that these patterns are only able to identify the likelihood of the direction in the market. For more in-depth identification on whether it is a pullback or a reversal in trend, timeframes are the key factor to take note of. Remember, the pattern tends to be more powerful in the higher timeframes, which means that the occurrence in lower timeframes may have a higher probability of being just a pull back in the higher timeframes as compared to when it occurs in the higher timeframes.
Info: