

If you have taken part in various financial markets before, you must have come across the term volatility. Volatility is said to be a statistical measure of the size of price changes of an underlying security over a specified period of time. Mostly volatility is directly proportional to risk. Markets with high volatility are considered high-risk markets while markets with low volatility are considered low-risk markets.
There are two main types of volatility measures that traders use to speculate a market movement. These include historical and implied volatility. In this article, we have discussed what historic volatility is, how it works and how it influences your daily returns. As a bonus, we have included a section on how to use historical volatility as a trading strategy.
Also Read: How Do You Trade With A Volatility Indicator?
Contents
- What is Historical Volatility?
- Historical Volatility and What it Means While Trading
- Historical Volatility vs Implied Volatility
- Why is it Important for Investors to Understand Historical Volatility?
- How Do You Calculate Historical Volatility?
- FAQs
What is Historical Volatility?
Historical volatility refers to the measure of an asset's price deviation from its previous or average price within a given period or set time frame. Some define it as a statistical indicator that measures the price distribution of an asset over a specified time period.
As the name suggests historic volatility mainly focuses on the last traded prices of a specific security. To get the historical volatility of a specific security, you calculate the average price deviation of the security from its average price.
As mentioned above, historic volatility is a statistical indicator. This is because the calculation of historic volatility involves the use of standard deviation. While there is a standard deviation mathematical formula for calculating historic volatility, it is non-essential to traders. Today any decent trading platform comes inbuilt with a historic volatility indicator. Look for it in the indicator section of your trading platform.
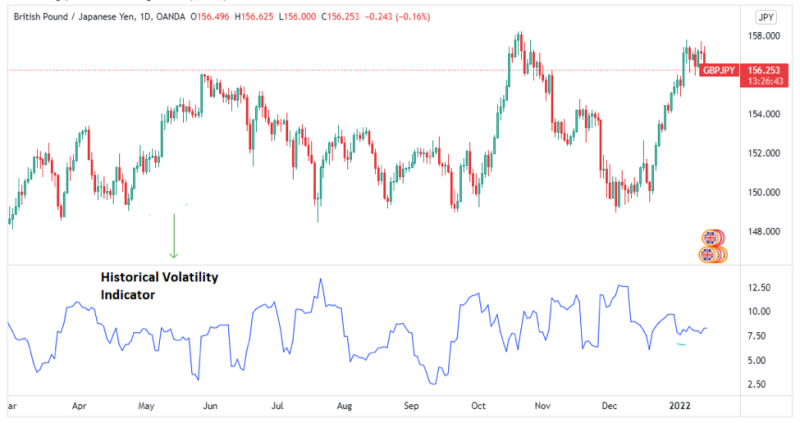
Below is an example of a historical indicator on Trading View for the GBP/JPY daily chart. It is on the bottom pane labeled ‘Historical Volatility Indicator'.
Historical Volatility and What it Means While Trading
Historical volatility as an indicator is used to speculate how far an asset's price deviates from its average price within a given time frame. A higher historical volatility measures and signifies a larger deviation of prices from their averages while lower historic volatility signifies a small standard deviation in prices.
Ideally, a larger deviation of price from its average implies a huge change in the price action of an asset while a smaller deviation of price from its average implies a smaller change. For this reason, historical volatility is used to measure expected profit or loss before taking trades. To minimize the chances of loss as it does not indicate market direction traders are advised to put in a protective stop loss.
When the current volatility of an underlying asset is high compared to its average volatility, this could signify a large market move in either direction. In such a case price would deviate to extreme ends and away from the normal price range. When the volatility is low, this means that the market is moving in a sideways manner (consolidating) and hence the price experiences mild to average deviation.
For traders using historical volatility, high historical volatility means that there are viable trading opportunities while low historic volatility means that there are minimal trading opportunities. Higher volatility implies higher risk while lower volatility implies lower risk.

Therefore, the historical volatility indicator could be used to speculate huge or significant market moves. It is important to note that the historic volatility of a financial instrument can only help predict future price action but not market direction.
For this reason, the historical volatility indicator is often used along with other indicators such as Bollinger Bands, Moving Average Indicators, and Relative Strength Indicators (RSIs) to help in speculating market direction.
Historical Volatility vs Implied Volatility
The main difference between historical volatility and implied volatility is that historical volatility focuses on the past performance of stocks or any other underlying securities while implied volatility focuses on the price of an underlying instrument (future volatility). This price is then used to calculate or predict the future/expected volatility of the asset.
Implied volatility is mostly popular among options traders. This is mainly because options trading is mostly driven by supply and demand. By following the lows of demand and supply i.e. When demand is high then supply is low and vice versa, options traders can price options contracts based on the implied volatility of these options.
Both historical and implied volatility are key tools that help investors measure and define volatility trends. After establishing the volatility trend through a volatility technical analysis for a specific stock, asset, or commodity, traders can then decide on whether to take trades or not.
Why is it Important for Investors to Understand Historical Volatility?
Generally, traders need to understand any indicator especially if they intend to use it. Volatility indicators are core indicators in that they work well across any market index, security, or asset. Statistical volatility helps traders scope out the highly volatile securities as they offer a chance for substantial gains.
For example, if the price for a specific stock is volatile, this means that a lot is going on around that specific stock. The trader would then use this information to get more data on what is influencing the stock’s price at that particular time. With this data, he can determine whether to trade on the specific stock or not.
Also Read: How Market Conditions Affect Your Trading

How Do You Calculate Historical Volatility?
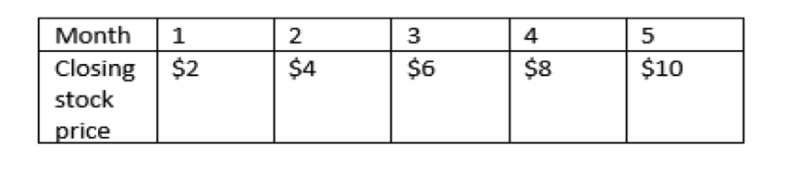
Historical volatility is calculated by first calculating the variance and then the standard deviation of an asset's price or value. Mathematically standard deviation is the square root of variance. To illustrate how to calculate historic volatility assume the following closing prices.
To calculate variance:
- Find the mean of the data set above.
Mean = (2 + 4 + 6 +8 + 10 ) / 5
Therefore, the mean is equal to 6.
- Calculate the deviation (difference between each data value and mean)
(10-5), (8-5), (6-5, (4-5), (2-5). To eliminate the negative values, square all the deviation values.
In this case, you will get 5, 3, 1, -1, and -3. Square this to get 25, 9, 2, 1 and 9
- Add the square deviations together.
25 + 2 + 9 + 1 + 9
The Sum of deviations is equal to 40.
- Divide the sum of squared deviations with the number of data values.
40/5
Variance is therefore 8.
The standard deviation (historic volatility) for the stock price above is, therefore, $2.83 which is the square root of 8.
FAQs
Is high market volatility good or bad?
Generally, high volatility offers more opportunities for traders to turn a profit as it suggests larger market movement. However, a high volatility volume also presents a high risk as there is an uncertainty of the market direction.
What is the historical volatility percentile?
This is an indicator that shows you a percentage of the number of days the current volatility has been lower than the historical volatility of a specific security.


