
The inside bar pattern is used by traders to identify breakout and reversal patterns in the market. The two bar patterns can be found in upward and downward trending price movements.
Inside bars are a sign of market consolidation. Ideally, the trader will spot the pattern in a daily chart. Daily charts are better because they reduce the amount of noise and fake signals in the chart.
Also Read: What is an Outside Bar?
Contents
- Inside Bar Candlestick Pattern
- Trading Inside Bars
- Inside Bar Trading Strategy
- Pinocchio Bar Pattern (Pin Bar Pattern)
- Strategy for Trading Inside Bars and Pin Bars
- Conclusion
- FAQs
Inside Bar Candlestick Pattern
This is a two bar candlestick pattern. The first bar (on the left) is called the mother bar (mb) and the second bar is called the inside bar (ib).
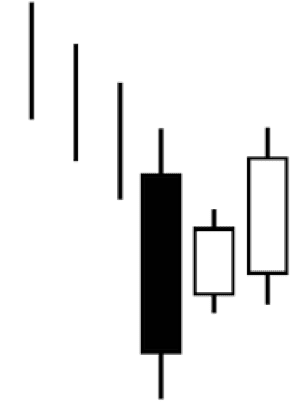
The inside bar is engulfed by the mother bar. That means that the inside bar's high and low values are within the range of the mother bar's high-low values. It can be positioned at the top, middle, or bottom of the mother bar.
Inside Bar candle pattern
The smaller the inside bar, the better the single. If the inside bar is about 25% of the mother bar, then the signal is a strong one. However, if the inside bar's high and low prices are equal or almost equal to the range of the mother bar, then the inside bar is not considered an inside bar. In essence, its large range means that this pattern should not be used to predict market trends or price movements.
Continuation Trend
Inside bars are consolidations of the market. They are a sign that the buyers and sellers in the market are fighting for market dominance.
Selling
If the inside bar is in a downward moving price trend, the inside bar is a sell signal. Its presence means that there has been a pause in the prevailing trend and there is a fight for power amongst the buyers and the sellers. If the inside bar has a strong signal, short bar, then the trader should short the asset.
Buying
If the inside bars are formed in an upward trending price movement, the trader should buy the asset or go long on it. Since it’s a consolidation trend, it only signals that buyers and sellers are vying for power in the market. Provided the inside bar signal is moderate to strong, the current market trend will continue after the period of consolidation.
Multiple Inside Bars
Inside bar patterns can have more than 2 bars. There will only be one mother bar. However, there can be more than one inside bar. It is not rare to see one to four inside bars. It is even possible to see more than four bars, although such instances are rare.
When there is more than one inside bar, and they are all within the range of the mother bar, the signal is stronger than if there was only one inside bar. The pattern that best makes this point is the coiled inside bar pattern.
Coiling Inside Bar Pattern
If there is an inside bar pattern with multiple inside bars, it may be a coiling inside bar. A coiling inside bar has a succession of inside bars, with each additional bar smaller than the bar that came before it. The succession of smaller inside bars represent a contraction of the market. The more the market tightens, the greater the explosion of the price when the market finally rebounds.
Inside Bar Breakout Pattern
Inside bars in upward/downward moving trends in which the price hits the resistance/support line may indicate a reversal trend.
Bullish inside bar pattern
The asset price can have an upward or downward trend. When the price movement falls to the support line and an inside bar forms, that is a signal that there will be a bullish trend reversal. This means that the price is going to move in the opposite direction. Traders who identify this pattern in a bear market are going to begin buying the asset or going long on it.
Bearish inside bar pattern
The asset's price is trending upward towards the resistance line and at the resistance line, an inside bar is a signal that there will be a bearish trend reversal. Traders who identify this inside bar pattern will begin to sell their assets or short the asset.
Inside Bar Breakout Pattern
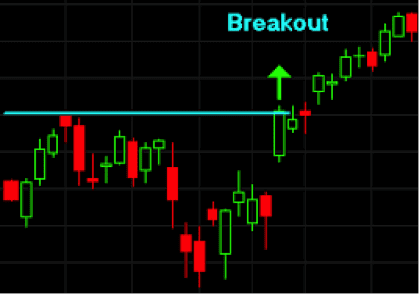
The inside breakout can be found in downward and upward trending price movements. In both cases the price will meet the key chart level, resistance or support line, and there will be an inside bar signaling a continuation of the trend. This trading signal is not a sell or buy signal, but a trend breakout signal. It shows that the dominant players in the market are pushing past their counterpart’s resistance.
The inside bar signaling a continuation of the trend means that the price will break through the key support level and a new key support level will be established. Traders observing these trends will take the same actions as traders who identify the sell and buy signals using inside bar indicators.
False Breakout
The false breakout pattern has many different variations. One version is when the inside bar is outside the range of the mother bar and the second inside bar is within the range of the mother bar. The other pattern is when the inside bar is a false indicator.
In all instances of the false breakout, the price breaks away from the current trend and then quickly reverses itself. The reversed trend continues the prior dominant trend.
The fake breakout tricks a lot of investors and causes many to lose many. False breakouts are common in the forex market. Forex traders who can identify them can set up trades that are profitable when the market reverses itself. Trading fake breakouts is for experienced traders, not novices. It is a risky trading strategy that can be very rewarding if successful.
Trading Inside Bars
Trading Inside Bars in a Downward Trending Market
If you spot the inside bar setup in a down trending price movement, it's a sell signal. In this scenario, traders will short the stock and/or place a buy order for when the asset price drops to an advantageous lower price.
Trading Inside Bars in an Upward Trending Market
If you spot the inside bar setup in an upward trending price movement, it's a buy signal. With this signal, traders will place a buy order at the top or bottom of the mother bar or go long on the asset.
Trading Inside Bars Against the Market Trend
If you have identified an inside bar trend reversal signal, traders will want to place a buy stop or sell stop at the high or low price point of the mother bar. When the price breaks through the mother bar's opening or closing price, the entry order is filled by the broker responsible for executing the order.
Bearish Trend
In an upward trending market, the inside bar will be located at the key resistance level. When the inside bar is on the resistance line, it's a bearish trend reversal signal. When this signal is observed in the market, traders begin selling the asset, shorting the asset, or placing buy orders for when the asset price falls to an advantageous purchase price level.
Bullish Trend
In a downward trending market, the inside bar setup will be located at the key support level. When the inside bar is on the support line, it's a bullish trend reversal signal. When this signal is observed in the market, traders begin buying the asset, or going long on it.
Inside Bar Trading Strategy
Avoid trading on inside bars when the mother bar is very large and the inside bar is large.

They are difficult to trade because they have a lot of false signals. Moreover, since they are unreliable technical indicators, it is difficult for traders to manage risk when using them.
Traders must learn to filter out the noise from the real signals. Inside bars signals across all timeframes. It is generally advised that traders using this strategy trade using daily charts, because the daily charts have less noise in them.
Pinocchio Bar Pattern (Pin Bar Pattern)
A pin bar is a reversal or continuation signal. It appears as a single candle with a long tail, also referred to as a wick or shadow, and a small body (relative to its tail). The body is within the range of the high and low price of the prior candle.
For pin bars, the assumption is that the asset price will move in the opposite direction of the pin bar's tail. A bearish pin bar has a long upper tail, whereas the bullish pin bar has a long lower tail.
Also Read: Prevent a failing pin bar
Strategy for Trading Inside Bars and Pin Bars
Pin bar and inside bar are both price action strategies that show market resistance. The pin bar indicates a trend reversal is imminent, and the inside bar signals a price consolidation and that a price breakout is imminent.
Together, they are a potent price action combination signal. The most reliable and profitable inside bar setup is when the pin bar and the inside bar are the same bar. The body of the combined pin bar + inside bar is within the mother bar's opening and closing price range.
To find the pin bar and inside bar combination, look for the pin bar in the daily charts. The daily charts have less noise than the shorter time frame chart. They make it easier to find this inside bar breakout pattern. Note, the pattern with the combined pin bar and inside bar signals a winning trade. This pattern is the strongest identifying trend reversal.
Conclusion
The inside bar trading strategy is easy for novice and experienced traders to use. It is a proven, reliable technical indicator when paired with another technical indicator, like the pin bar price action strategy.
The inside bar trading strategy is best implemented by studying daily charts. The daily charts filter out the noise and make it easier to spot the patterns and confirm them.
This strategy is best used in combination with other technical indicators. The strategies must be combined because an inside bar pattern is not determinative of what will happen with the price movement. This pattern can indicate a trend continuation, reversal, or breakout. The meaning of the signal depends on where the inside bar is located in the chart and the prevailing trend at the time of its formation.
FAQs
Is the inside bar indicator reliable?
The inside bar indicator is very reliable when paired with at least one other technical indicator. The other technical indicator will confirm the inside bar signal. Two technical indicators which give the same market signal will give traders confidence that the observed signal isn't noise or being misunderstood.
Which technical indicator is most often paired with the inside bar indicator?
The pin bar technical indicator is most often paired with the inside bar indicator. When these two indicators give traders the same signal, traders can be confident that trades made based on them will be profitable.
Is the inside bar technical indicator recommended for intraday traders?
No, the inside trading bar strategy is not recommended for intraday trading. Traders using this strategy should review an asset's daily chart. By observing the price movements of the asset over an entire trading day for several days, the trader can filter out the noise and find the inside bar patterns that reflect future price movements.


