Ever struggled to find an indicator like QQE that filters market noise and shows clean signals for your trading strategy? The QQE indicator, short for Quantitative Qualitative Estimation, might just be the missing piece in your chart setup. It builds on the RSI and adds two lines to help traders spot overbought and oversold levels with better accuracy. Unlike other indicators, the QQE smoothing factor reduces false alerts and helps detect trend reversals early and effectively.
This guide will help beginners understand how the QQE works, how to read its lines, and how to set it up for different trading styles. Whether you trade forex , stocks, or crypto, the QQE can generate early buy or sell signals that fit your strategy. By learning how its smoothed RSI and volatility-based calculations connect, you’ll gain a clearer view of the market and improve your trading decisions with confidence.
What Is QQE
The QQE, or Quantitative Qualitative Estimation, is a technical analysis tool that helps traders detect market trends and momentum shifts. It expands on the Relative Strength Index (RSI) by adding a smoothing factor and two lines that act as volatility filters, giving traders clearer and more reliable signals. These lines respond to price movements while reducing market noise, making the QQE more stable than traditional oscillators. When you see the QQE lines crossing specific levels, they help reveal possible buy or sell signals that align with market strength or weakness.
In simple terms, the QQE translates raw RSI data into a smoother, more readable form that helps you determine market direction with better precision. It highlights overbought and oversold levels while identifying potential trend reversals earlier than many other indicators. Whether your trading style focuses on swing, day, or forex trading, the QQE indicator helps enhance your strategy by showing clearer signals and improving decision-making with confidence.
QQE Indicator Calculation
Every indicator in trading is built from a mathematical formula, and the QQE indicator is no different. While some indicators are simple, others, like the QQE, require more detailed calculations to create accurate signals. Most platforms handle this process automatically, but understanding how the QQE works helps traders use it with purpose. Knowing what happens behind the scenes lets you trust the lines you see on your chart and make better trading decisions.
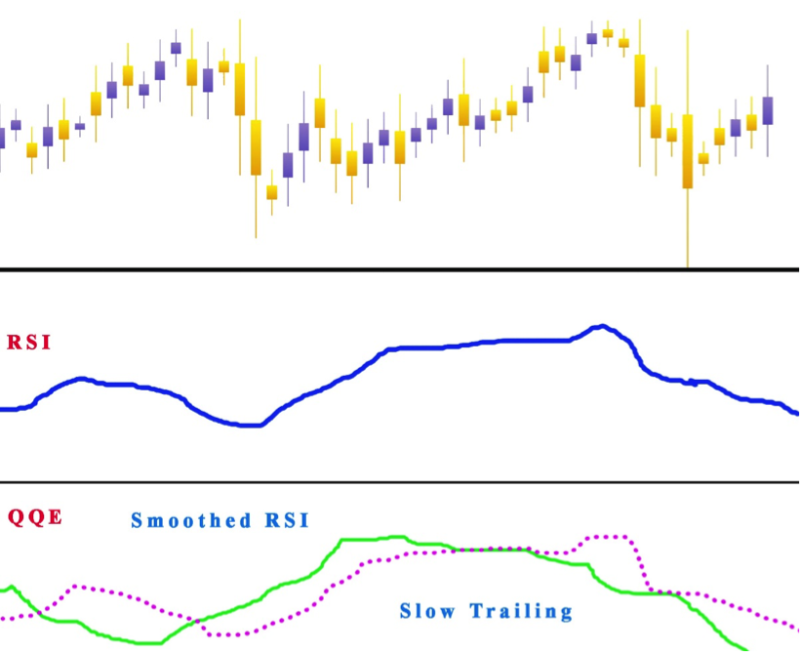
The QQE starts by estimating a 14-period RSI, which forms the base of the indicator. That RSI is then smoothed using a 5-period EMA, creating what’s known as the smoothed RSI. Next, the absolute value of the bar’s change is measured to identify volatility shifts. A 27-period EMA is then applied twice to smooth these values further, filtering short-term market noise. Finally, the slow trailing line is created by multiplying the last result by 4.236. This line helps reveal trend strength, overbought conditions, and possible buy signals, making the QQE a reliable tool for different trading strategies.
Quantitative Qualitative Estimation
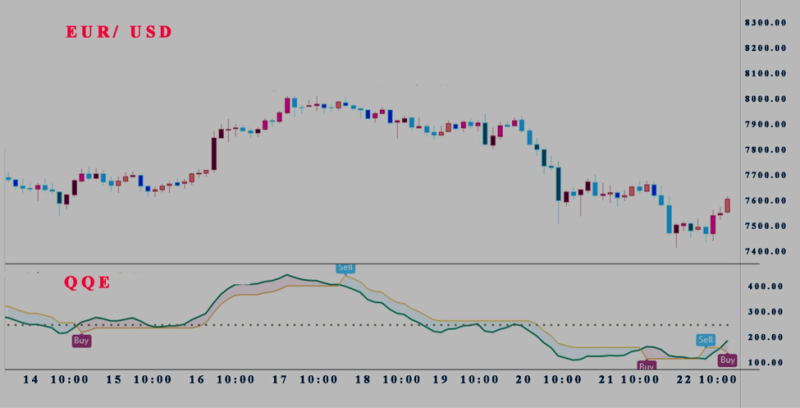
The Quantitative Qualitative Estimation is more than just a technical indicator; it is a refined tool that balances momentum and volatility. Its true strength lies in the smoothing factor, which filters market noise by applying a moving average to the RSI for clearer signals.. This process helps traders focus on the real market direction rather than short-term price fluctuations. On the chart, the QQE displays two lines that move smoothly, allowing users to read signals with clarity and confidence.
In the QQE indicator, signals are generated when the main line crosses specific levels, particularly around the fifty mark. When the blue line moves upward and crosses the other line while both are below the fifty level, it can suggest a possible buy setup. On the other hand, a downward cross below the same level can signal a sell entry. These interactions between the lines provide early visual cues for potential market direction, helping traders adapt their strategy quickly.
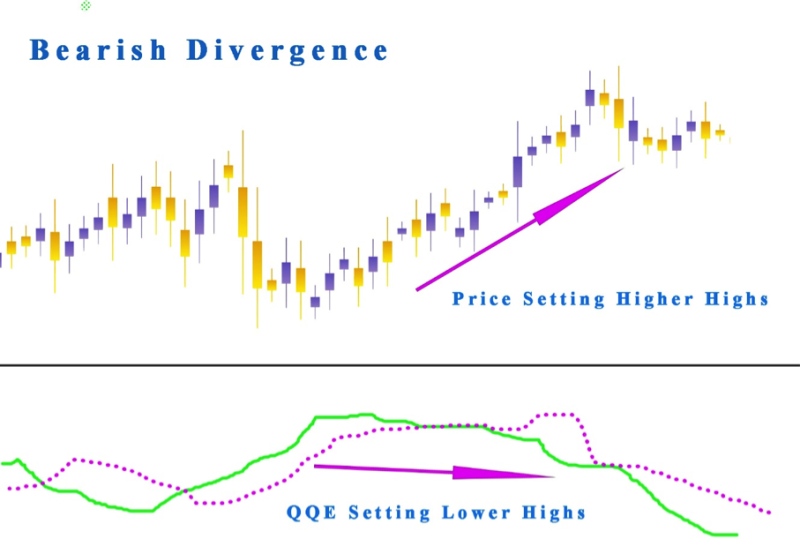
Another useful aspect of the QQE is its ability to show divergences between price action and the indicator. A bullish divergence occurs when the price forms lower lows while the QQE line forms higher lows. This pattern hints at a potential reversal to the upside. Conversely, a bearish divergence appears when the price makes higher highs while the QQE forms lower highs. Recognizing these divergences allows traders to anticipate trend changes and fine-tune their quantitative trading strategies for better results.
Interpreting QQE Signals
The QQE indicator gives traders several ways to read market signals and adjust their strategy with precision. Each line movement or level crossover provides a unique clue about price behavior and potential trend direction. Traders who learn to read these signals can spot overbought or oversold levels and predict reversals more accurately. Each QQE setup appears differently on the chart and helps traders make smarter, well-timed decisions in their trading journey.
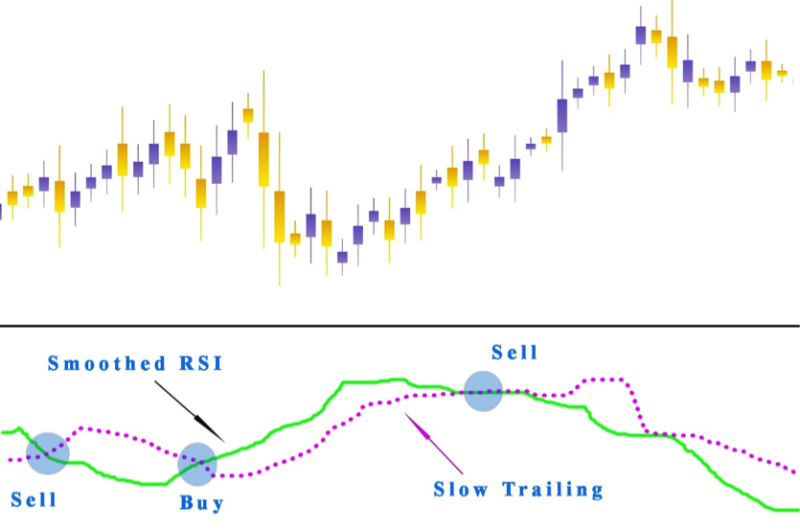
Smoothed RSI Crosses the ATR
When the smoothed RSI crosses the ATR trailing lines , it gives traders a clear view of changing market momentum. If the RSI line moves above the fast or slow ATR line, it often signals growing bullish strength and can be seen as a possible buy signal. This means the price may start trending upward, showing an opportunity to enter a long trade. On the other hand, if the RSI drops below the fast or slow ATR line, it can indicate weakening momentum and a potential sell signal. This setup helps traders align their strategy with current market direction and avoid trading against the prevailing trend.
Divergences Amid the QQE indicator and Price Action
There are two main types of divergences seen in the QQE indicator, regular and hidden. A regular divergence often signals a possible trend reversal, while a hidden divergence suggests the continuation of an existing trend. Understanding these differences helps traders make better decisions and adjust their strategy with confidence.
When price forms lower lows while the QQE makes higher lows, it shows that sellers are losing strength, signaling bullish divergence. If price reaches higher highs but the QQE creates lower highs, it warns that buying momentum is fading, forming bearish divergence. When price creates higher lows and the QQE forms lower lows, it hints the uptrend may continue, showing hidden bullish divergence. But when price forms lower highs and the QQE shows higher highs, it suggests the downtrend could persist, signaling hidden bearish divergence.
RSI cross of the 50 levels
When the RSI line crosses the 50 level on the QQE indicator, it gives traders a quick clue about market direction. If the RSI moves above the 50 level, it suggests growing bullish momentum and can signal a potential buy setup. On the other hand, when the RSI falls below the 50 level, it indicates bearish strength and may reveal a possible sell opportunity. This simple crossover helps traders confirm whether the market trend is shifting upward or downward before entering a trade.
ATR Trailing Line Crossover
When the fast ATR trailing line moves above the slow trailing line, it usually signals growing bullish momentum and suggests a long setup. This crossover shows that buyers are gaining control and the price might continue moving upward for some time. When the fast ATR line moves below the slow trailing line, it shows growing bearish pressure and a possible short opportunity. Watching these crossovers helps traders follow the market direction and avoid entering trades too early against the trend. It is best to wait for confirmation from other indicators or chart patterns before taking action to ensure better accuracy. Doing so helps reduce trading risks and supports more confident, well-timed decisions that align with the overall market movement.
How Is the QQE Indicator Used?
The QQE indicator works best when used with the dominant trend on higher timeframes. Traders often find better results by buying near support and selling near resistance. Since the QQE shares many features with the RSI, it can be used in similar ways to confirm momentum strength and identify strong trading setups.
Locate Overbought or Oversold Levels
When the QQE indicator shows values above 70, it signals an overbought condition, meaning the market might be ready to pull back. When values fall below 30, it indicates oversold levels, suggesting a possible price recovery. Traders often use these levels to plan their trades, entering long positions when the QQE line moves above thirty and considering short setups when it drops below 70.
Detect Short-Term Momentum
The QQE indicator helps traders identify short-term momentum by observing the smoothed RSI line and the slow trailing line. When the smoothed RSI moves above the slow line, it shows bullish momentum and suggests possible long trades. When the smoothed RSI drops below the slow line, it signals bearish momentum and possible short trade setups.
Trend Detection
QQE indicator can also serve as a reliable trend detection tool for traders. When the QQE values move above the fifty mark, it signals a bullish market where long positions can be considered. If the values drop below fifty, it points to a bearish market where short positions may be more suitable. In this way, the QQE works as a simple yet effective trend filter, helping traders stay aligned with the dominant market direction and avoid unnecessary counter-trend trades.
Spot Price & Momentum Divergence
Momentum often drives price, and when it weakens, it can signal early signs of a reversal. The QQE indicator helps spot this by showing divergence between its lines and actual price movement. A bearish divergence happens when the price reaches higher highs, but the QQE forms lower highs, suggesting a downward reversal ahead. A bullish divergence appears when the price creates lower lows, but the QQE shows higher lows, signaling an upcoming upward reversal.
Also Read: The RSI Forex Indicator Complete Guide
Conclusion
The QQE indicator continues to stand out as a dependable companion for traders seeking balance and clarity in their decisions. Its design allows free access to insights that reduce confusion and help traders act with focus. Over time, it builds confidence through repetition and understanding, giving traders the experience they need to interpret market behavior clearly. Whether analyzing charts or backtesting past movements, this tool allows traders to grow their knowledge with patience and purpose.
To make the most of the QQE, consistency is needed. Traders should choose to practice reading its lines daily until it becomes second nature. The length of your learning journey may vary, but the effort will pay off in the end. By mastering this, you build a stronger connection with market movement and learn to respond calmly with focus and control. This steady approach helps you avoid emotional reactions and move closer to lasting success in your trading journey.
FAQs
What is the QQE indicator used for?
The QQE indicator helps traders identify trend direction, momentum changes, and possible reversals by combining RSI data with volatility filters.
Is the QQE indicator good for beginners?
>>>>>>>>>>>>>>>>>>>>>>>>>>Yes, the QQE is beginner friendly because it gives clear buy and sell signals through visual line crossovers and smooth movements on the chart.
Which markets can I use the QQE indicator in?
You can apply the QQE to different markets such as forex, stocks, and crypto. It adjusts well to various trading styles and timeframes.