

There are various ways you can use to improve your trading strategy to achieve better results. One of the most popular ways to improve your trading is through the use of technical indicators. Technical indicators are complex instruments or technical analysis tools which depend on mathematical calculations of the historic price and volume that help forecast future price movement. One such technical indicator is the Rate of Change (ROC) Indicator.
In this article, we have discussed the basics of the price rate of change, how to calculate the ROC, and finally, how to use the ROC indicator while trading.
Also Read: Best Technical Indicators for Day Trading
Contents
- What is the ROC Indicator?
- How to Calculate the Rate of Change (ROC)
- How to Trade Using the ROC Indicator
- Final Thoughts
- FAQs
What is the ROC Indicator?
The Rate of Change Indicator is a price-based momentum technical indicator that measures the percentage change in price between the current price and the price a certain number of periods ago. It can also be said to be a non-banded oscillator that tracks the speed of a price action trend and is simply referred to as simply momentum.
On a chart, the ROC indicator is plotted or develops from the zero line, with the indicator moving upwards into the positive territory, signifying a positive price move/change. Conversely, when the price rate of change moves downwards to the negative territory, it signifies that the price changes and is negative.
Simply put, when the ROC goes above zero, it confirms an uptrend whereas when the ROC goes below zero it confirms a downtrend. The ROC indicator is mostly expressed as a percentage. This helps traders define when an asset is in the overbought or oversold zones.
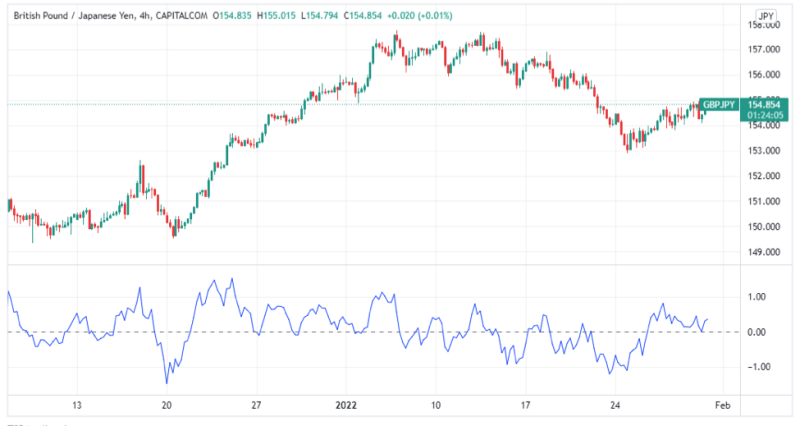
The ROC indicator is located on the bottom pane of your trading platform. Below is an image of the ROC indicator on the bottom pane of the GBP/JPY price chart on Trading View .
How to Calculate the Rate of Change (ROC)
As mentioned above, the price rate of change is a comparison between the current price of an asset and the price of the same assets a few periods ago. For this reason, it is crucial to first decide how many periods you are using or considering as the look-back period. Once you determine the number of periods you are set to calculate the Rate of Change.
Ideally, short-term traders such as day traders and scalpers may use a smaller number of trading periods such as nine while long-term traders such as swing traders may use a larger number of periods.
Therefore, the ROC calculation compares the current closing price to the closing price for n periods ago (specific number of periods). The formula for calculating the rate of change ROC is:

While it is important to understand how to calculate the rate of price change, you will not have to as most trading platforms come in-built with the ROC indicator. Find it in the indicator section of your trading platform.
Most trading platforms work with either 14 periods as the lookback period. However, depending on your trading strategy you can change this to values as small as nine or as large as 200.
It is important to note that the larger the number of periods you use, the smoother the ROC as it reacts to price moves more slowly. For this reason, it is considered more reliable compared to a smaller number of periods as the ROC reacts quickly to prices and hence may produce false signals that are notoriously unreliable.
How to Trade Using the ROC Indicator
Due to its nature, the price rate of change indicator can be used for various purposes. It can be used as a trend identification indicator, as a trend reversal indicator, and to detect divergence in different markets. This is mostly because understanding the price action of different securities is an integral part of trading any financial instrument.
A key area to look out for while using the percent change in price (ROC) is the zero line, as the price rate of change is plotted from the zero line. This is because the price rate of change is plotted to stem from the zero midlines and extends towards the positive values or negative values.
· As a trend confirmation tool
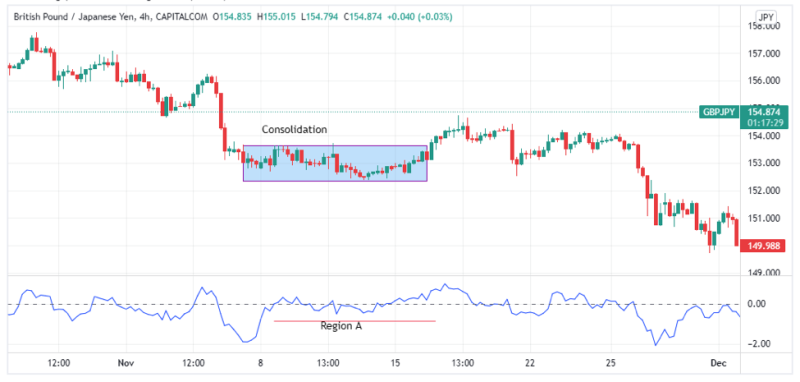
To begin with, the price rate of change indicator is considered a momentum indicator as it measures the momentum of a price via the rate of change. When the indicator value is concentrated around the zero line for a significant period, the market is said to be consolidating. A ROC reading that is above the zero line signifies a bullish momentum while a reading that is below the zero line signifies a bearish price momentum.
Therefore, while trading when the ROC values are positive with the momentum heading towards the positive extremes, it can serve as a confirmation of a bullish trend. Conversely, when the ROC values are negative, with the momentum headed to the negative territory it can serve as a confirmation for a bullish trend.
When the ROC values are concentrated around the zero line, it serves as a signal that the prices of the underlying security are consolidating. For this reason, it is best to stay away from the markets at this point. From the chart below, not how the ROC behaved when the prices were consolidating.
· As a trend reversal tool
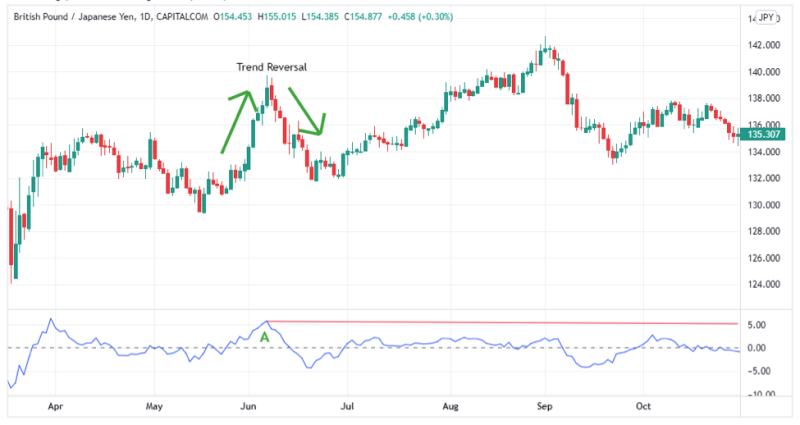
The ROC indicator is best used as a trend reversal tool as illustrates several confirmations of a trend change. To begin with, as the price rate of change is considered a momentum oscillator, it helps traders identify overbought and oversold conditions. Identifying overbought and oversold levels is crucial to predicting or speculating market reversal and confirming a trend.
From the image below note region A, as the reversal occurs. At this point, the ROC reading was in the overbought level hence serving as a sell signal.
If the price momentum is growing stronger, it serves as a trend confirmation signal. On the other hand, if a trend is losing momentum, it signals a trend change in the opposite direction.
Additionally, if there is an upward surge in momentum it signals a sharp price advance (bullish breakout) trend whereas in there is a downward plunge in momentum it signals a steep price decline (bearish breakout). If the positive momentum (upward) or negative momentum (downward) is strong it suggests that the direction of the break out will persist. It is important to note that breakouts only occur with strong momentum.
Another reversal signal is if the ROC values cross the zero line. If the price rate of change indicator (ROC) crosses the zero line from the bottom it is usually the suggestion of a bullish price trend. Conversely, if the price rate of change indicator crosses the zero line from the top it usually suggests a bearish trend. When using the zero line to confirm price moves it is advisable to combine the ROC indicator with other reversal signals for better results.
· As a divergence indicator
While divergence is a poor signal when used to predict trend changes, it can yield better results when used with other indicators such as moving averages. The rate of change ROC can be used to detect divergences, especially during trading ranges. Divergence refers to when the price action of an asset is moving in an opposite direction compared to the indicator.
A bullish divergence occurs when the prices of an asset are moving downwards while the ROC values are increasing towards the positive territory. Bearish divergence on the other hand occurs when the price of an asset is rising over time while the ROC values are progressively moving lower.
A bullish divergence suggests a bearish reversal while a bearish divergence suggests a bullish reversal. However, for best results, while using the rate of change indicator as a divergence indicator it is best to combine it with another technical indicator.
Also Read: How To Use Volume Price Analysis
Final Thoughts
Just like other momentum indicators, we see that the rate of change can be used to speculate future price movements. It is instrumental as the rate of change reflects overbought and oversold conditions, thus allowing traders to speculate price movement.
However, the indicator also has its fair share of limitations. For example, its calculation gives equal weight to the most recent price and the price n periods ago. This is a limitation because, through various analysis methods, traders have determined that recent price action is more relevant to predicting future price movements compared to past price action.
Whether you are trading CFDs, Forex or any other financial instrument understanding how to use the price rate of change could be the difference between being profitable or losing money rapidly.
Kindly note that the information contained in this article is not a form of investment advice but is an educational technical analysis guide.
FAQs
What is the ROC trend confirmation strategy?
This strategy defines that if the ROC crosses the zero point from below it generates a positive momentum while if the ROC crosses the zero point from above it generates a negative momentum.
What is the volume ROC indicator?
The volume rate of change refers to the comparison of the current volume of an asset compared to the volume of the same asset several periods ago. It is calculated in the same way as the price rate of change.


