
Traders use technical indicators when preparing strategies. There are several methods that are applied when creating a tactic for the financial market. The Relative Strength Index (RSI) and moving averages are frequently utilized.
Volume is an underrated but powerful technique that enables market makers to dive into the market structure and understand price movement.

The shifting of volume in the stock market is reasonably the most important technical information accessible to day traders.
Volume indicators show the certainty of the participants and open new opportunities. The volume shows how much or if people want the stock.
In modern markets, the price moves are usually reasonable. But inefficient markets, the case of crypto comes to mind, enables you to use easy techniques that like price action and technical analysis.
Understanding the relationship between supply and demand is a factor in coming up with trading decisions. Price move on the basis of supply and demand.
When the demand cannot be met by supply, prices rise. When the supply is larger than interest for the product, the price declines.
Investors that focus on volume have more success than traders that disregard it. The volume shows the value of transactions in a given period.
Also Read: How Does Money Flow Index Work?
Contents
- Why Is It Important
- On Balance Volume
- Key Factor Of Market Structure
- What Is The Volume-Weighted Average Price?
- The Market Stages Accumulation and Distribution
- Volume Analysis Shows If the Market Is Bullish or Bearish
- Trading the Volume Price Trend Indicator
- Conclusion
- FAQs
Why Is It Important
For investors, volume is useful for revealing the psychological level of fellow traders and is a tool to verify a trend. When the price of a stock moves with a high volume, it signals the strength of creating a bullish signal. If the volume is declining it signals a sell-off.
Volumes are indicators of divergence. This is obvious with the rise in volume in an upward trend, which causes a decrease in the price of the asset.
The important thing to remember is that a decline in price on large volume indicates that something might have caused it. The cause can be news.
Traders use volume to verify chart patterns. Successful investors use volumes to identify chart patterns. If the volume is high, it is reasonable to expect it will verify the formation of the chart patterns.
On Balance Volume
This trading strategy was created by Joseph Granville, one of the most reputable creators of technical indicators. On balance is a good signal, based on the higher or lower movement of prices in the previous day.
The advantage of this indicator is that it goes up or down before the actual prices of the asset is indicated. When on-balance volume shows a signal that is different from the real price, it reveals a transfer in price or divergence.
Using on-balance volume creates buying opportunities by signaling a new high, which indicates the power of the bulls and the fragility of the bears. But a new on-balance volume low is an indicator of a bear market.
Key Factor Of Market Structure
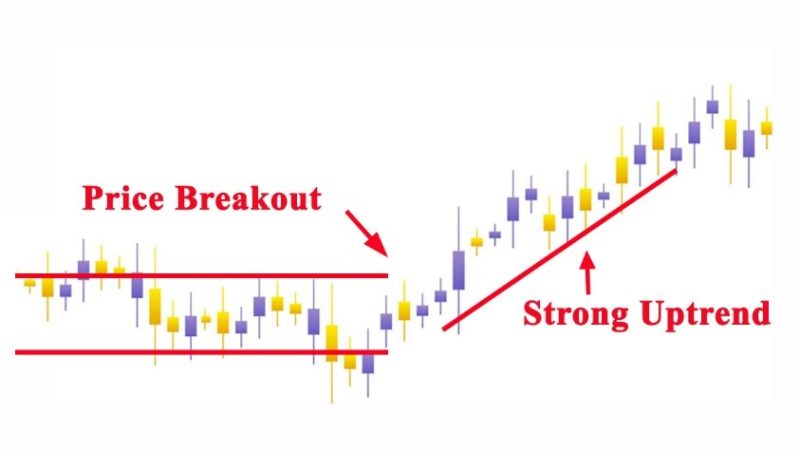
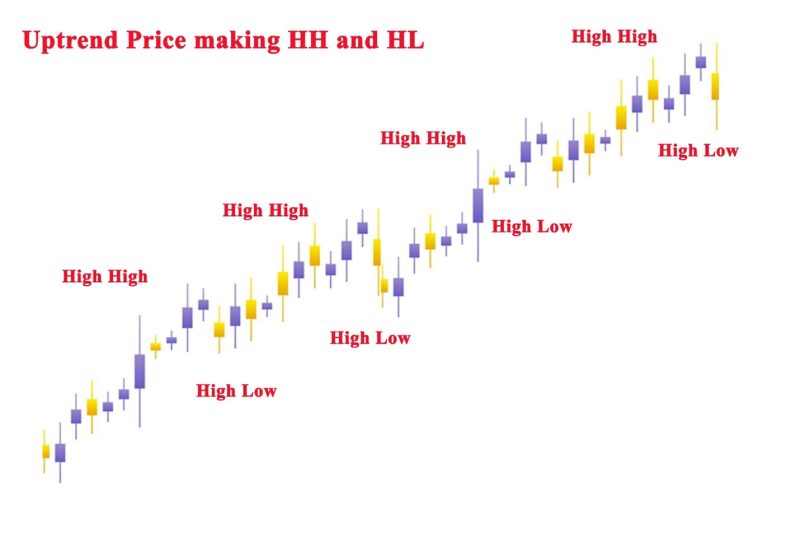
The market structure comprises short-term swings. It moves in up downswing, that’s like a market swing. In a solid bull trend, the upswing usually is larger than the downswing in length. The opposite is the fact for the bear market. The market swings enable investors to observe the structure of the market and get an impression if the market will move up or down. In a bull market trend, prices make a higher high (HH) and a higher low (HL). While in a bear market, trend prices make lower high (LH) and lower low (LL).
If you observe the market carefully, you will see that the volume of trade is driving price at a given moment. If you send a market order to purchase 20 lots of an asset.
But the closes contrasting sell limit order has a volume of 2 lots. Traders will acquire it and reclaim the next level.
And that continues until the order in 20 lots will be realized. By doing this you start an upward movement in price using your market order.
The fight between buyers and sellers is a common occurrence in the accumulation phase. It is important to know at what level will it take place. We can recognize levels on which, was accumulated the largest volume.
What Is The Volume-Weighted Average Price?
The volume-weighted average price is a trading guideline that investors use to find the mean price of an asset that is traded during the day.
This is done based on volume and price. It is used to give traders an insight into the value and trend of a security.
The volume-weighted average price is calculated by summing up the currency traded in all transactions and dividing by the shares traded.
The Market Stages Accumulation and Distribution
Financial markets function in a cyclical format. You can identify two stages that are passing into each other.
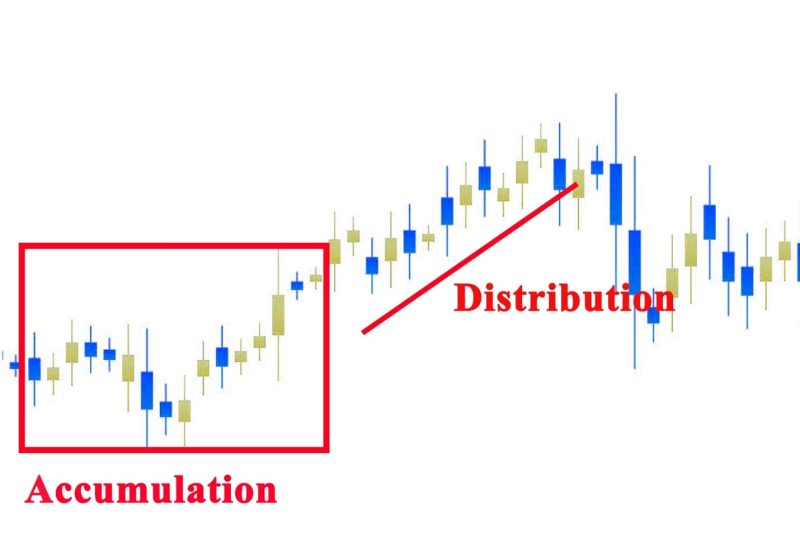
Accumulation Phase
In the Accumulation phase, traders start their positions in a given time where the balance that exists in the market turns into imbalance.
Usually one of the market players, the sellers or the buyers starts to dominate the situation. The process is slow, but the final outcome is the transition to the distribution stage.
The Distribution Phase
is recognizable from the fast price change. This happens because one of the participants is dominating the situation and driving up the price. From another viewpoint, the distribution phase can be described as the attempt to find a fair price.
This will enable buyers and sellers to return the balance. Interestingly, there are situations when the distribution stage is not the product of the accumulation stage.
It can be initiated by economic or financial news. This influences investors' decisions, sometimes significantly in form of imbalance. A report of shortage of coal will affect the price of the coal futures.
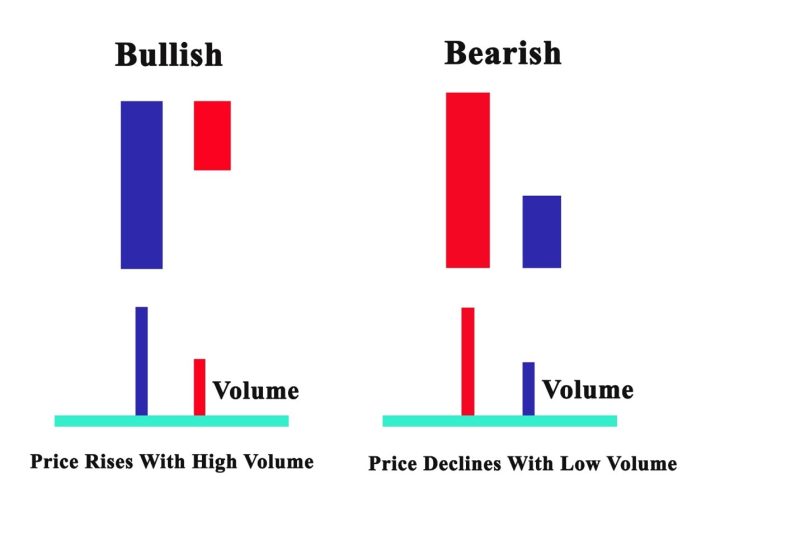
Volume Analysis Shows If the Market Is Bullish or Bearish
Volume confirms trends. When prices increase with a large volume, this indicates the trend is a bullish signal.
If there’s high volume and the price of the asset declines, then you know traders are unloading their assets. Volume helps you minimize risk by making the right moves.
Learning the Volume Price Trend Indicator (VPT)
The volume price trend indicator is a tool that shows the balance of an asset's demand and supply. The VPT indicator is alike to the on-balance volume indicator.
Both calculate the growing volume and offer traders data about an asset’s money flow. Most charting software offers the VPT indicator.
Trading the Volume Price Trend Indicator
To create trading signals a signal line can be used. This is a moving average of the indicator. Usually, traders purchase an asset when the VPT line goes over the signal line. But sell when the VPT line moves under the signal line.
The indicator can be used in tandem with the average directional index and moving averages. A trader can buy an asset stock if the 20-day moving average is above the 50-day moving average. Its followed by an increasing VPT indicator.
The investor can sell if the 20-day moving average is below the 50-day moving average and the indicator’s values are going down.
The average directional index also calculates momentum and trend. It can be used with the VPT to verify if a market is trending.
Readings above 25 signals that an asset is trending, while readings below 25 indicate sideways price action.
A trader can buy when the average directional index is above 25 and the VPT line is above its signal line. Investors can sell when the ADX is below 25 and the VPT line is below its signal line.
Brokers can use the VPT indicator to locate technical divergence. It happens when the indicator goes to a higher high or a lower low. And the assets price makes a lower high or a higher low.
Traders should place a stop-loss order above the most recent swing high or below the most recent swing low to minimize risk.
Conclusion
Volume is an important element in creating better trading decisions because it opens a view into the minds of other traders. It helps to recognize fear as a fundamental factor and can provoke fast sell-offs and price changes.
A successful trader must understand the market. To make correct market moves he needs tools. Volume profile gives insight and helps investors to grasp processes. Volume and time are important data pieces for investors doing day trading. There are numerous volume analysis tools and they are helpful and complement one another.
Implementing them in your trading strategies helps you follow rapid price change in the commodity market. For a day trader and retail traders, volume tells when prices will eventually turn in the same direction at a particular time.
Also Read: Williams Alligator Indicator Complete Guide
FAQs
How do you analyze volume price?
The important thing to know when doing volume price analysis is that a price declines on large volume indicate that there is a reason for the move.
News about companies’ performance and interest rate decisions can influence the move. Investors use volume to verify chart patterns.
How do you interpret volume analysis?
A volume is a tool for measuring the quantity of shares traded options or futures. Volume is a signal of market strength.
Markets with increased volume are perceived as healthy. But when prices go down on rising volume, the trend is accumulating strength to the downside.
What does price/volume indicate?
Volume price indicator is used to confirm the balance between demand and supply of an asset. The change in percentage reveals the relative supply or demand of a particular stock, and volume is the strength of the trend.


