Are you looking to up your trading game and improve your trading results? If your answer to this question is yes, then this article is for you. One way to improve your trading game is through the use of technical indicators. Technical indicators are tried and tested tools that will help you predict market direction. Today we will concentrate on one technical indicator known as the Williams Percent Range oscillator.
Here you will learn what the Williams Percent Range Indicator is and how to use it to upgrade your trading game.
Also read: How To Use The Chaikin Oscillator
Contents
- What Exactly is Williams Percent Range Indicator?
- How is the Williams Percent Range Calculated?
- The Williams Percent Range Strategy
- Williams Percent Range Oscillator Vs Stochastic Oscillator
- Pros and Cons of Using the Williams Percent Range
- Final Thoughts
- FAQs
What Exactly is Williams Percent Range Indicator?
Williams Percent Range, commonly referred to as the Williams %R, is a momentum oscillator that measures that oscillates between the level 0 to -100 and is used to determine whether an asset has been overbought or oversold. The Williams Percent Range indicator borrows and works within the same lines as the Stochastic Oscillator.
The Williams percent range strategy was discovered by Larry Williams, who became popular for using it to make massive gains.
The Williams %R helps traders evaluate the relationship between the final closing price of a specific asset compared to the highest and lowest low price of the asset within a given look-back period. This relationship helps traders determine at what point to open or close positions in a specific market. How?
Oscillators help traders identify overbought and oversold conditions of a specific asset. Larry Williams discovered that when an asset has been overbought, the Williams % R Indicator will be between 0 and -20 levels whereas when an asset has been oversold the indicator will be between the -80 to -100 levels. Some traders will define this as the strength or weakness of a financial asset against its price.
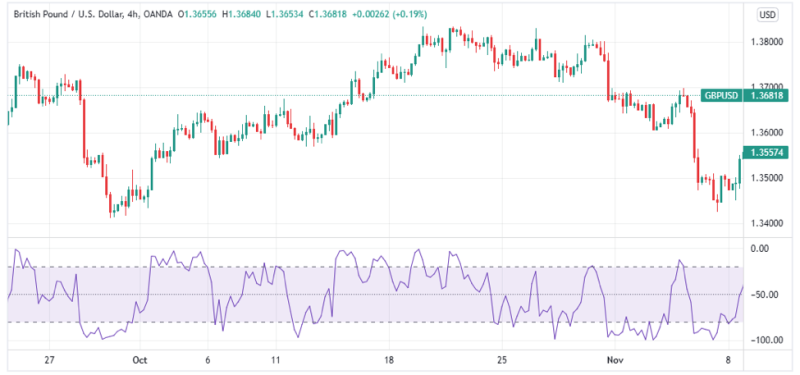
The Williams %R is usually found at the bottom pane of your trading platform. Below is an example of the indicator for the GBP/USD currency pair and daily chart on Trading View. It is labeled as the Williams $ R 14.
How is the Williams Percent Range Calculated?
Part of the reason that the Williams R % indicator is common, is because it is relatively easy to calculate. The formula for calculating the Williams % R is:
%R= ((Highest high-Close))/((Highest high-Lowest Low))× -100
Where:
- Highest High is the peak price for the period in consideration.
- Close is the closing price for the period in consideration.
- The lowest low is the lowest price for the period in consideration.
Usually, the Williams % R is calculated for 14 periods; however, you can always change this to your preferred number of periods. Like for most indicators, you do not need to understand how to do it as most trading platforms already have an inbuilt Williams % R indicator. Look for it in the indicator section of your trading platform.
The Williams Percent Range Strategy
As mentioned above, the Williams % R is an oscillator that helps you determine if the underlying security has been overbought or oversold.
An overbought asset will have a Williams % R of below -20 while an oversold asset will be above -80. It is important to note that these levels do not in any way indicate a price reversal. They only help indicate when an asset's current price is close to the highest price of its recent range (overbought readings) or the price is close to the lowest low price point of its current price or trading range (oversold reading).
The Williams % R trading strategy can be used in two ways:
- To indicate a price reversal (weakening momentum or momentum burst).
- To indicate the continuation of a price trend or consolidation.
Williams Percent Range as a momentum burst strategy
In a strong bullish trend (strong uptrend), the value of the Williams % R may fall to below -20. In such a situation, this could be an indication that the price may start to reverse. If the price continues to rise and the value of the %R does not go back to above -20, then it is an indication of a bearish reversal. It is advisable to use another indicator or other market factors as confirmation.
While is a strong bearish trend, the Williams % R may fall to -80 or lower. If this happens, it could be an indication of a bullish price reversal as it indicates that an asset has been oversold. Again, it is advisable to use another indicator to confirm the price reversal.
Bullish Movement % R Momentum Burst Setup
Below is an example of a bullish % R momentum burst strategy.
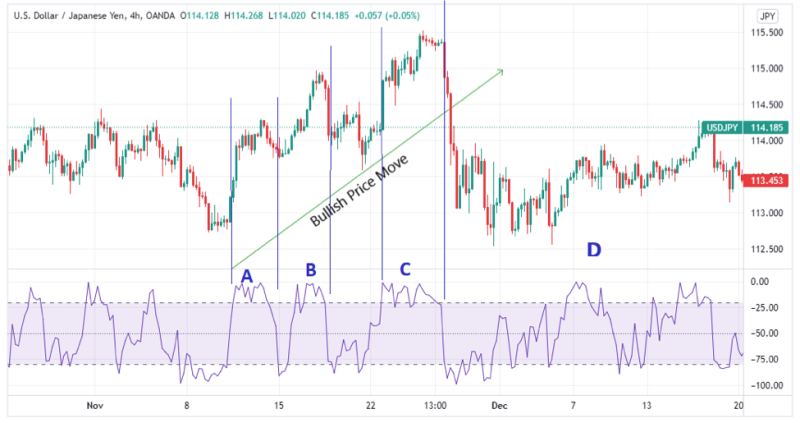
From the image above note, the zones labeled A, B, and C. In these regions, the prices continue rising steadily especially after the Williams R % goes above the -20 overbought territory, after which a bearish reversal occurs.
Zone C has the clearest indication, as prices continued rising while the % R indicator stayed at the – 20 mark and above. When this happens, it is a clear indication of a price reversal. However, as confirmed by zones A and B the Williams % R is best for deciding entry and exit points. To use it as a reversal pattern you would need to combine it with a different indicator.
Bearish Movement % R Momentum Burst Setup
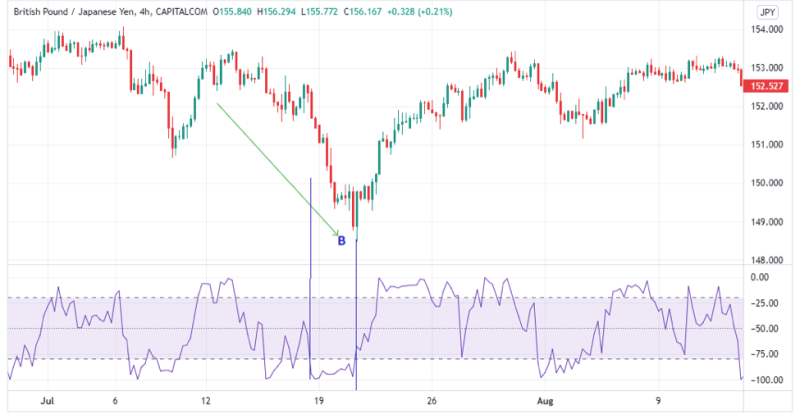
The image above illustrates a bearish % R momentum burst. Note region B as prices continuously fall to point B while the Williams % R remains below the -80 oversold territory. The price then makes a significant uptrend move.
Note that for the Williams % R to indicate a significant price move, the prices must continue moving in a specific direction while the Percent Range stays within the extreme overbought and oversold levels.
Williams Percent Range as a trend continuation strategy
As a continuation strategy, we will focus on the Williams R % -50 zone. This is because it shows a clear difference between overbought and oversold readings on the % R indicator. As such, it implies a change in momentum of the price action of a specific security or financial instrument. Once the William R % crosses the -50 mark, it implies a change in momentum.
In the case where both market direction and R % indicator are moving in the same direction after crossing the -50 mark, this signifies a continuation in the price trend. This means that traders can open positions favoring this direction up until the R % indicator reaches the extreme levels or crosses the -50 mark.
When the % R indicator is on the upper half an asset can be considered overbought while the indicator is on the bottom half an asset can be considered oversold.
To confirm a change in momentum, the William R % must have come from the extreme levels of either -20 or -80. When the R % indictor is oscillating between the -80 and -20 levels but keeps crossing the -50 mark, the market can be said to be consolidating.
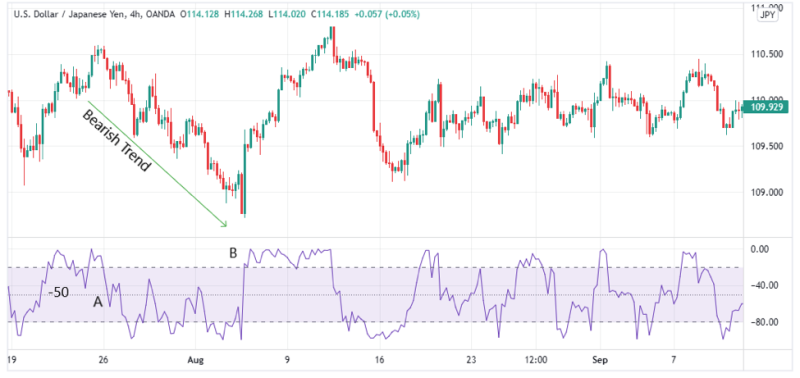
% R Continuation Strategy Setup
The image above illustrates how to use the Williams Percent Range as a trend continuation strategy on the USD/JPY 4-hour chart.
As mentioned above once the % R indicator goes past the -50 mark in any direction after hitting any extreme overbought and oversold levels, it is safe to assume that the market will follow this direction up to when the markets will hit the next extreme.
In the image above for the bearish trend, the % R crosses the -50 mark at point A after coming from an overbought level. This triggers the bearish trend marked above. The trend then follows through with the percent range indicator testing the -50 mark a few times before finally reversing close to region B.
Once the price hit point A, the trader should have opened a sell order as the prices were gradually falling.
The above concept can also be applied to a bullish trend. Once the % R crosses the -50 mark from an oversold level, traders can now open buy orders up to when the market gets to the overbought territory.
Williams Percent Range Oscillator Vs Stochastic Oscillator
The only difference between the Williams % R and the Stochastic Oscillator is that the Williams % R focuses on the relationship between the close and the highest price while a stochastic oscillator focuses on the relationship between the last closing price and the lowest low within a specific time period. In a chart they have different scaling as the % R oscillates between 0 to -100 while the stochastic oscillates between 0 to -20.
Also Read: Bill Williams Awesome Oscillator Trading Strategy
Pros and Cons of Using the Williams Percent Range
Pros
- The Williams % R is available in most trading platforms and applications.
- It is easily usable by both newer traders and experienced traders.
- Knowing the overbought levels and oversold levels of a specific asset can be useful for any financial market out there. This is because most markets follow the law of supply and demand.
Cons
- Knowing whether an asset has price surpassed the overbought threshold or oversold threshold will only signal an entry or exit but not market directions.
- Due to the nature of the Williams % R, it is sometimes inaccurate especially when the market is making smaller moves as it is a very responsive indicator.
Final Thoughts
In the abstract, the Williams % R indicator or trading strategy can be considered profitable especially when used correctly. As it does not indicate the market direction, it provides better results when combine with another indicator such as the Moving Average or Relative Strength Indicator.
Depending on your investment objectives and risk appetite you can carry out technical analysis to tweak the Williams % R to accommodate your trading strategy for even better results.
Please note that the information presented in this article is intended as educational content and is not in any way financial advice. Before using this oscillator or any trading other oscillators it is always advisable to do your research.
FAQs
How do you use Williams percentage range?
The Williams % R is used to find entry and exit points for traders especially when they day trade. It helps compare the highest high and lowest prices of an asset compared to its closing price for a specific look-back period.
What is the fast stochastic oscillator?
The first stochastic oscillator is a close relative of the Williams % R and is sometimes confused for the % R. This s because it is a unique stochastic indicator that oscillates between the 0 to 100 levels, unlike other stochastic indicators.