
Investors wake up every morning with one thought – what’s the market trend? Figuring out the short- and long-term market dynamics enables brokers to implement trading strategies that can be profitable.
Several technical indicators get used to forecast the price of an asset and the direction of a trend. Most are reliable, but investors are always on the hunt for more tools that offer greater precision.

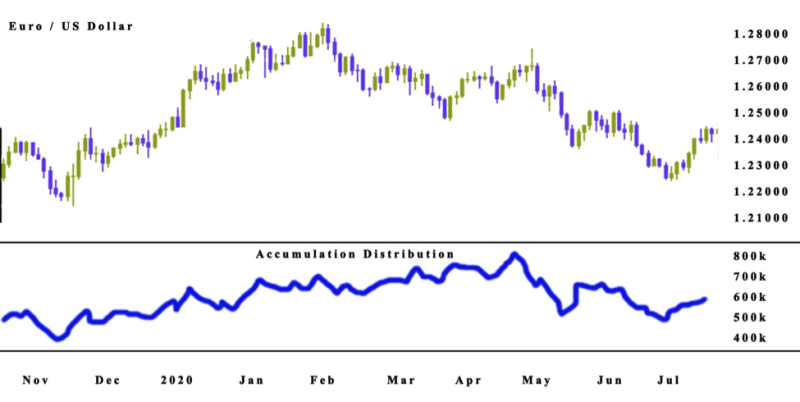
The line created by the Accumulation/Distribution indicator gets used to identify the trend of an asset by analyzing the divergence between the volume and the stock’s price.
The accumulative aspect in the name refers to the demand for the asset in question. While the distribution relates to the supply of the same asset. With these two parameters, analysts can determine the strength of a trend.
When observing the A/D indicator, it’s important to see if the indicators are falling when the stock price is climbing.
This moment signals that the purchasing volume or the accumulation doesn’t have the strength to reinforce the price rise.
Indicating that a decline in the price can happen very soon. The A/D indicator got developed by Marc Chaikin, an investor, and analyst, who originally named the indicator the Cumulative Money Flow Line.
It's an innovative approach to reading charts and estimating the selling pressure.
Also read: Best Technical Indicators for Swing Trading
Contents
- Calculating with Money Flow Volume and Money Flow Multiplier
- The Accumulation Distribution Line
- How to Use the Accumulation/Distribution Indicator
- The Pros and Cons of the A/D Indicator
- Combining A/D with Other Indicators
- A/D Indicator vs. On-Balance Volume
- Conclusion
- FAQs
Calculating with Money Flow Volume and Money Flow Multiplier
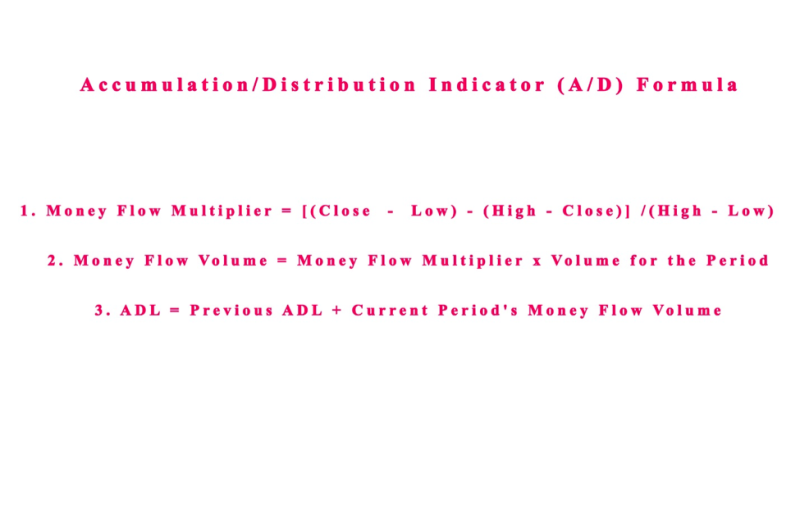
When doing the calculation for the A/D, traders must follow three steps. They start by estimating the money flow multiplier, and after that calculate the money flow volume. In the end, the accumulation distribution line is estimated.
Traders estimate the money flow multiplier by adding up low and close prices. After that, they minus the close from the high, and finally remove the two results and divide it with the high minus low.
The money flow volume is estimated by multiplying the money flow multiplier with the periods volume.
The Accumulation/Distribution line is estimated by computing the preceding ADL with the present period’s money flow volume. Because of that the A/D will constantly oscillate amid positive one and negative one.
Typically, the accumulation or distribution is amid +1 and -1. If the number is near +1, it's interpreted as a signal of increasing buying pressure. The opposite is true of a low negative number signaling buying pressure.
The Accumulation Distribution Line
The line is a progressive computation of the period's volume or money flow. A vigorous buying pressure is displayed when the high positive multiplier mixed with high volume that forces the indicator higher.
The opposite happens with a low negative number mixed with high volume mirrors a vigorous selling pressure that accelerates the indicator lower.
Money flow volume accumulates to create a line that verifies or negates the primary price trend. In this instance, the indicator is used to boost the underlying trend or show suspicion of its sustainability.
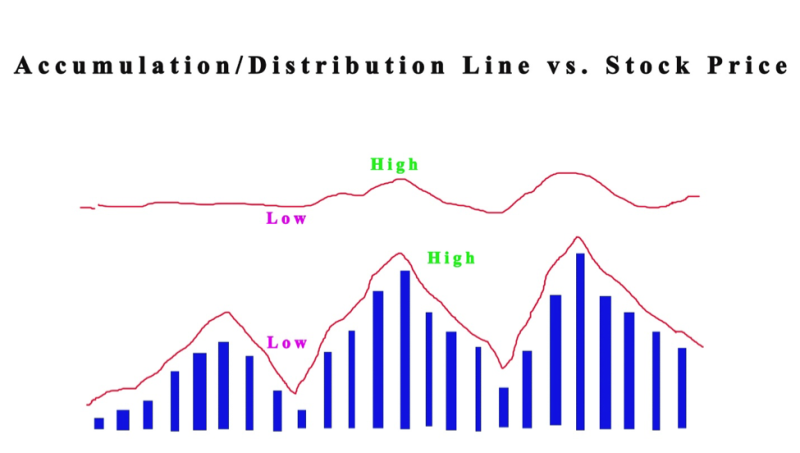
Underlying selling pressure is signaled when prices experience an uptrend while a downtrend is happening in the Accumulation Distribution Line, which can also signal a bearish reversal.
Underlying buying pressure is indicated with a uptrend in the Accumulation/Distribution line and if prices experience downward trend, these can also forecast a bullish reversal in prices.
How to Use the Accumulation/Distribution Indicator
The crucial rule when implementing the Accumulation/Distribution line indicator is that volume precedes price. The quantity of assets transacted gets corresponding to the stock’s price movements.
The indicators enable investors to forecast the course of the volume flow, which in turn offers a more accurate estimation of the price movements.
The accumulation/distribution line (adl) offers a better understanding of the supply and demand of the stock being transacted.
The goal is to inspect the direction of the line and figure out the buying or selling pressure behind the primary trend.
The distribution stage of the market gets revealed by a falling Accumulation/Distribution line, while the accumulation phase of the market is signaled by a climbing A/D line.
In both instances, verify the course of a trend with other technical indicators. Do not rush in to open a position for the stock you think has potential for big earnings.
You may be wondering about a possible scenario where the price and A/D indicator and price comply. In this instance, it can be understood as a verification of the expectation for price movements in the future.
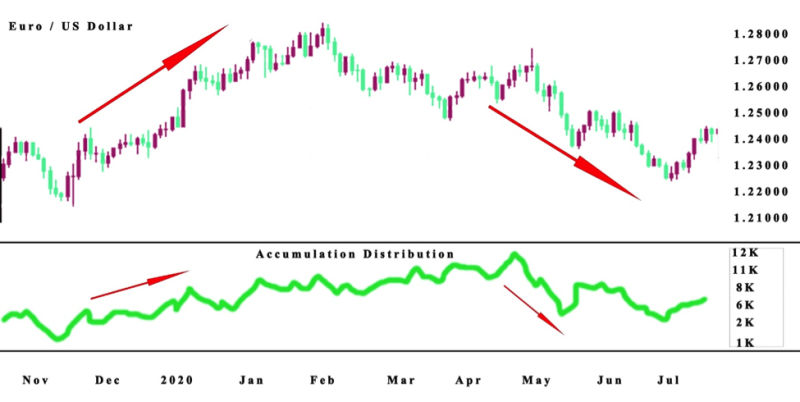
A more important signal is the divergence between the Accumulation/Distribution line indicator and the price.
When the price is declining, and the Accumulation/Distribution indicator is rising, that signals a potential bullish reversal. If the price is rising but the A/D indicator is going down then it's an indication of a bearish reversal.
The Pros and Cons of the A/D Indicator
The accumulation distribution indicator is a solid instrument to estimate the volume force behind the pricing move.
The Accumulation/Distribution line indicator can regulate the buying and selling pressure of assets and with that data into consideration can provide an understanding of possible stock price changes.
The A/D line can recognize price-volume disparity, enabling investors to verify the potential of a trend and its sustainability.
There are a few cons to implementing the accumulation distribution indicator. The Accumulation/Distribution indicator does not reveal fluctuations in price amid periods, creating a situation where few price gaps may not be registered.
Because the A/D line connects with the price movements for a period, it can result in a disconnect between the stock price and the indicator.
The best solution is for the accumulation distribution indicator to be used in tandem with other technical indicators.
Combining A/D with Other Indicators
Finding an extra layer of confirmation for the data received from a primary technical indictor is a smart option. When incorporating another analysis instrument, traders receive a better perspective of the market.
An example is using the Relative Strength Index (RSI) in combination with the A/D line to identify overbought and oversold market circumstances.
While the A/D indicator is great for locating possible trend reversals, and Pivot Point Indicator can confirm potential resistance and support levels.
Every trading platform provides a choice of technical indicators to support a tailored trading strategy. Other technical indicators that can be used in combination are Stochastic Oscillator, Moving Averages, and Bollinger Bands. If possible, avoid using it as a standalone indicator.
It's useful to perform experimentation with a selected indicator and estimate the effectiveness of the combination. When sure about the productive capacity of the strategy, use it on the market.
Also Read: Most Accurate Intraday Trading Indicators
A/D Indicator vs. On-Balance Volume
Similar to the Accumulation/Distribution indicator, the On-Balance-Volume (OBV) indicator uses price and volume to forecast market movements.
Both are cumulative measurement indicators, yet there is a difference between the two.
The On-Balance-Volume (OBV) indicator observes the present closing price and contrasts it to the previous close.
If the present close is higher than the preceding it adds the volume for that period. The opposite happens if the present close is lower.
The total of the values for the positive-negative volume flow is what creates the OBV line. Investors use the OBV line to confirm current trends and identify potential reversals with divergence from the asset price.
The difference is that the A/D indicator doesn’t account for the preceding close. It estimates in on a multiplier. Both indicators offer different but supporting data.
Conclusion
The accumulation/distribution is a frequently used technical indicator and a perfect option for the volume-based indicator. It can give traders an edge if they implement it correctly when using charts to follow stock price and periods of money flow volume.
It's not the most complicated technical analysis tool in the trader's toolbox, but useful for following stock price variation. Making the required calculations is easy, yet it's recommended to experiment and find the appropriate method to implement in a strategy.
An uptrend signals that purchasing pressure is dominating, and a downtrend signals a dominance of selling pressure. These are important parameters that help estimate the market dynamics and are used by traders to figure out their position and how best to move forward in the market.
The most frequent implementation of the indicator is to observe for divergences. If divergence is formed among the indicator and price, it's not a confirmation of reversal, it may be necessary for a period of time to pass before the reversal happens and it may not materialize at all.
Divergences of bullish and bearish types are signals for possible reversal on the price chart.
The standard unwritten rule is never to use an indicator standalone, you must confirm the data from other reliable sources to get the correct reading of the market. It is recommended to use the Accumulation/Distribution indicator in combination with other technical analysis tools, such as momentum oscillators and chart patterns.
The A/D gives valuable insight into the potential of a trend. Traders need to learn how to use it to improve profitability when trading.
FAQs
What Is Accumulation and Distribution Indicator?
The A/D is a cumulative indicator implemented to estimate if an asset gets distributed or accumulated based on volume and price. The distribution relates to the supply of the same asset. The accumulative aspect in the name refers to the demand for the asset in question
How do You Identify Stock Accumulation and Distribution?
The indicator inspects the closeness of the closing prices to their highs or lows, to estimate if accumulation or distribution is happening in the market. The comparisons between the values of the two parameters are what indicate the state of the market.
How do You Identify Accumulation and Distribution Phases?
The distribution phase starts as the markup stage ends, and the price enters another range period. The stocks get sold over a period. In accumulation, the sellers keep the prices high until the assets get sold.
What Is the ADL Indicator?
The A/D identifies divergences among volume flow and stock price, offering insight into the potential of a trend. Traders use it to make predictions about future market circumstances.


