Learn To Trade Forex • Best Forex Trading Course • AsiaForexMentor

Bull Trap – What does it do?

Written by

Ezekiel Chew

Updated on

January 29, 2025

i

Bull Trap – What does it do?

Written by:

Last updated on:

January 29, 2025

Bull trap

A bull trap is a false signal, referring to a declining trend in a stock, index, or other security that reverses after a convincing rally and breaks a prior support level. The move “traps” traders or investors that acted on the buy signal and generates losses on resulting long positions. A bull trap may also refer to a whipsaw pattern. The bull trap often occurs when price approaches a resistance level, often nearing a breakout. The bull trap takes place when the bears are doing the best to prevent a bullish breakout, causing the price to spike and then pull back below the resistance. In such instances, the bull trap may often also be known as a fake out or a false break out. This strategy is designed to minimize the scenarios of traders being caught in the premature break out and thus being stopped out by the market. However, to perfect the concept of this strategy one must ultimately master the timing to place pending orders which can be done better when the foundations of market reading is strong.

Bull trap – Quick Setup Tutorial


Content

  1. Goal of the article (FAQ)
  2. Bull trap for beginners
  3. How to use
  4. Is it possible/ feasible?
  5. Trade rules
  6. Pros and cons
  7. Analysis
  8. Conclusion
  9. Info

Goal of the article (FAQ)

This article aims to answer all of the frequently asked questions that traders have regarding the bull trap pattern, such as:

    1. What is a bull trap?/ What is a bull market trap?/ What is a bull trap chart?/ How to identify a bull trap?
    2. How to spot a bull trap?/ What does a bull trap look like?
    3. What does trap mean?
    4. How to read a bull trap?
    5. Why is it called a bull trap?

Back to top

Bull trap for beginners

To understand the bull trap better, let us zoom into the root cause of its occurrence. A bull trap occurs when a trader or investor buys a security that breaks out above a resistance level—a common technical analysis-based strategy. While many breakouts are followed by strong moves higher, the security may quickly reverse direction. These are known as “bull traps” because traders and investors who bought the breakout are “trapped” in the trade. This often leads to revenge trading as emotions stir throughout the course of this roller coaster ride. This is true especially for beginners, which in turn causes detrimental damages to their account. Hence, it is important to set emotions aside whenever you trade as emotions tend to influence and impair the decision-making capability of traders. It is important to understand that in trading, you are your greatest enemy. Always take a step back to reassess and reanalyse the market context and situation before executing another trade based on impulse. This strategy is suited for beginners to use as it is simplified to be understood easily. However, since it is simplified, beginners can trade it without fully understanding how to read price action in the market. This is tantamount to blindly trading the market, which is not recommended. Although simplified, no strategy is perfect, meaning that there will be anomalies happening that go against the theories of the strategy thus causing the trade to fail. As such, this can be avoided by proper technical analysis and understanding before the execution of the trade plan.

Also read: 50 Pips A Day Forex Strategy

Back to top

How to use

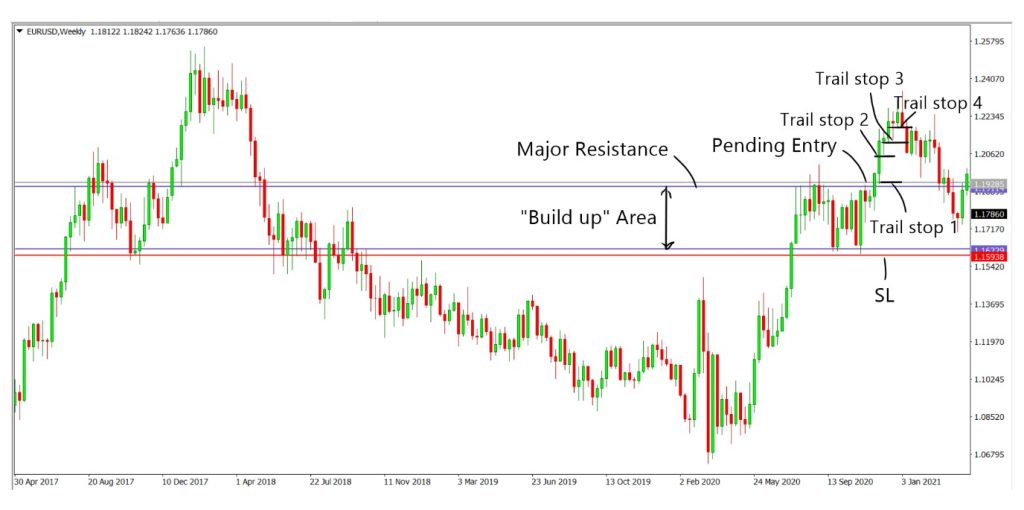
The bull trap strategy is simple and easy to use. The bull trap pattern is easily identified by a candle with a long wick above a resistance level or even in a series of candles, like a long bullish candle followed by a bearish candle of equal or greater size. To prevent a bull trap, firstly, we have to identify the major resistance of the market. In other words, a potential breakout zone. For that it is crucial to have mastered the understanding of identifying and applying support and resistances to your charts. After identifying the major resistance level, we would want to wait for prices to find a support level near the major resistance hence waiting for it to range and consolidate in between. Now we have a “build up” area. This “build up” area is crucial as it gives prices the opportunity to rest before a major break out. As compared to prices surging rapidly from a lower price, which have a higher chance of forming a bull trap since the momentum is exhausted from a lower price point, the consolidation in the “build up” area allows prices to rest before accumulating bullish momentum again for another breakout. This minimizes the chances of the trader being trapped in a break out that has its momentum decreased over time. Once the “build up” area has been identified, the trade plan can be carried out and thus be executed later on.

Back to top

Is it possible/ feasible?

To determine the feasibility of this strategy, we must first break down how the prices move in the market. The movement of prices are determined by a few factors but mainly, volume and buy and sell orders. When the volume of buyers is relatively high, the prices become more bullish and volatility increases, causing the breakout to take place. As the breakout continues sell orders get its stop losses hit, which is equivalent to more buy orders taking place. This causes the bullish momentum to be amplified, increasing the volume and volatility of the prices. By trading in the consolidation zone, or in this case the “build up” area near the resistance zone, more selling orders executed near the resistance zone can be stopped out as prices break the major resistance, providing “extra fuel” for the bullish breakout. This makes the strategy more reliable since it trades the breakout at the bottom when the momentum is at its peak, ultimately allowing the trader to avoid the bull trap scenario at a higher probability. Hence, the strategy is theoretically feasible. However, there might be instances where it may fail, for example, if there is a huge surge of sell orders, the momentum maybe very bearish, causing the market to go against the strategy.

Also read: Algorithmic Trading Strategies

Back to top

Trade rules

To apply this strategy, plot the major resistance in the time frame of your choice. This can be done by identifying the level where prices tend to respect. Next, wait for a support level to form and price to consolidate. Similarly, identify the level where prices respect as support. Afterwards, once the “build up” area is identified, allow prices to consolidate for a few candles’ worth of time. Prices may attempt to break above resistance at this stage, but it is highly likely that it will be a bull trap. After prices aggressively tested the resistance, set a pending order above the resistance and stop loss order below the support of the “build up” area. Leave the take profit order blank as we will be using trail stops to determine our profit taking level. As prices surge and form new support levels, trail the stop loss order below the new support levels. Rinse and repeat the trailing system until the trade is stopped out by the market.
Trading rules

Back to top

Pros and cons

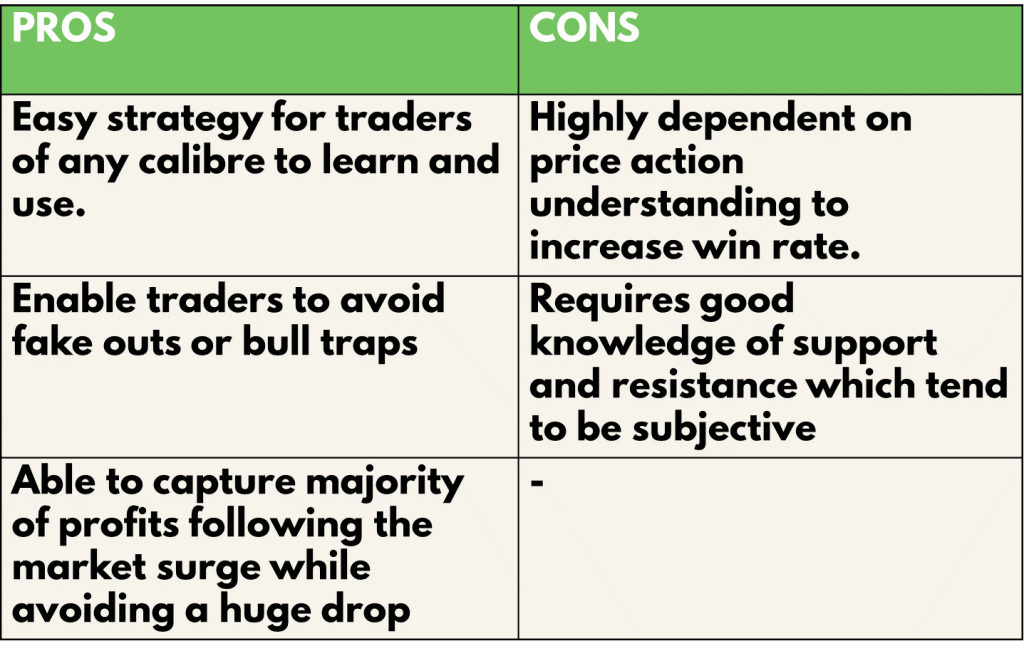
The pros of using the bull trap strategy are that firstly, it is a simplified strategy that is easy to learn and apply. Because of the simplicity, it is also beginner friendly allowing beginners to trade breakouts without knowledge of the market. Second of all, the strategy is engineered in a way to overcome one of the problems that many traders often face, getting bull trapped in a breakout. This is a widely faced problem even for experienced traders and this strategy offers one of the many solutions to minimize and even prevent the probability of getting faked out in the market by the inclusion of trail stops and “build up” areas. The “build up” area derives from the logical approach to the bull trap problem as it breaks down the factors affecting the strength of a breakout and focuses on maximizing them to suit the strategy better. Lastly, with the trail stop implemented, traders are able to capture majority of the profits while reducing losses as more free trades are generated as stop losses are moved to break even. At the same time, trail stops prevent the risk of getting dumped in the market by whales giving the strategy a safe and beneficial approach.

In contrast, the strategy is highly dependent on price action understanding. By understanding candlestick representations and price action, traders can enhance the win rate and the odds of entering the orders prematurely. Also, this strategy requires a good knowledge of one of the key basic concepts in trading, support and resistance, which often tends to be subjective. Which a shaky foundation of understanding and thus identifying the key levels in the market would mean that the trades would be executed inaccurately thence leading to higher lose rates.
pros and cons

Back to top

Analysis

To find out the profitability of the Bull trap trading strategy, we decided to do a back test based on the past 10 trades from 23 Jul 21 on the H4 timeframe. The rules for entry will be the same as what was mentioned above. We will be back testing this throughout 3 types of trading vehicles, namely, EURUSD for forex, US30(DJI) for stocks and BTCUSD for cryptocurrency. For simplicity, we will assume that all trades taken have a risk of 1% of the account.

Definitions:  Avg Risk reward ratio= ( Total risk reward ratio of winning trades/ total no. of wins) Profitability (% gain)= (no. of wins* reward)- (no of losses* 1) [ Risk is 1%]

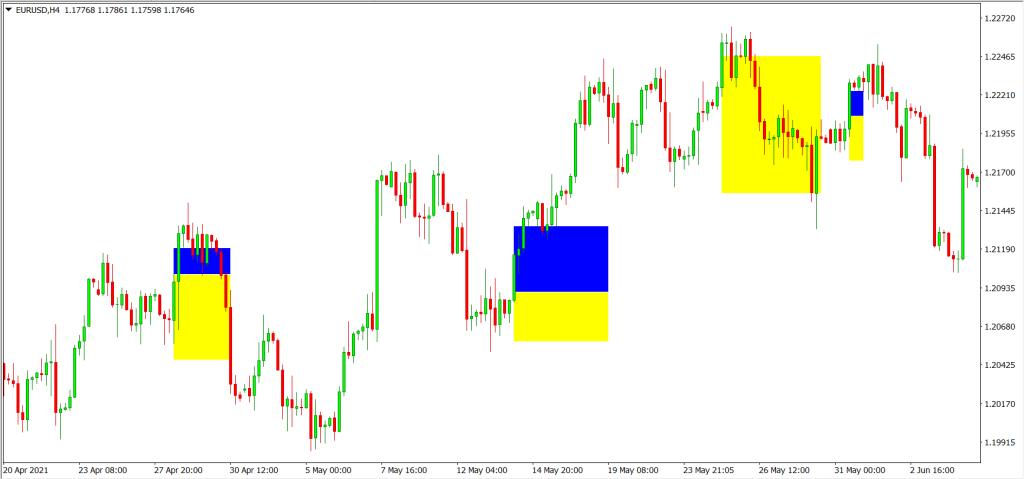
An example of the application of the strategy is as shown:
analysis

For the Backtest results, trades with blue and yellow zones indicate an overall win with the blue zone as reward and the yellow zone as the risk taken.

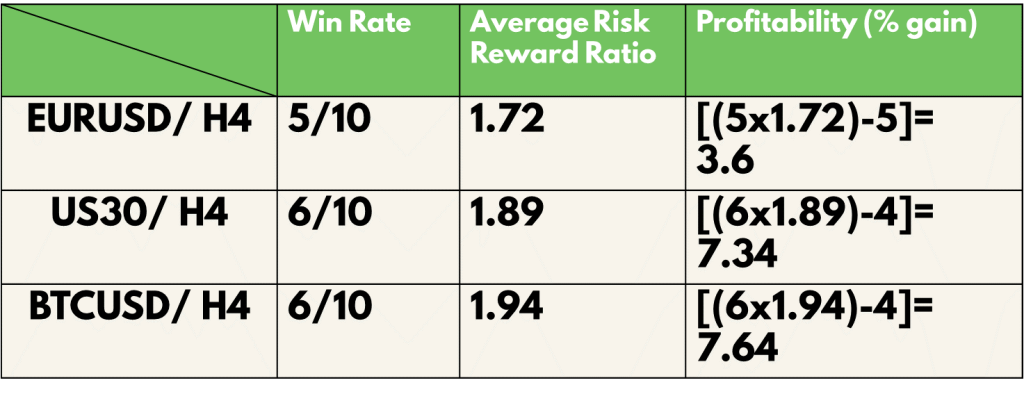
As shown in our backtest, the win rate of this strategy for EURUSD (Forex) is 50%, AAPL (Stocks) is 60% and BTC (Crypto) is 60%

The average risk reward ratio of this strategy for EURUSD (Forex) is 1.72 US30 (Stocks) is 1.89 and BTC (Crypto) is 1.94.

The profitability of this strategy for EURUSD (Forex) is 3.6, AAPL (Stocks) is 7.34 and BTC (Crypto) is 7.64.

Also read: Parabolic Sar Tested And Explained
analysis 2

Back to top

Conclusion

In conclusion, the bull trap strategy is a rather reliable solution to the bull trap problem that many traders would face. It is able to deliver a relatively good win rate with decent risk to reward ratios, ultimately making it profitable in the long run. Though this strategy is profitable, it relies heavily on technical analysis experience to maintain or improve its win rate. Lacking in any of the basics of technical analysis will cause the strategy to fail majority of the time. As mentioned before, premature entries due to lack of market experience can result in getting stopped out for this strategy. Also, the stoploss of the strategy is heavily dependent on the size of the “build up” area before the breakout. This in turn influences the risk to reward ratio of the trades taken and thus the profitability of the strategy. Ultimately the size of the “build up” area varies on the characteristics of the pair that is being traded. In other words, there are many factors that affects this strategy that should also be considered when coming up with a trade plan. While there is no perfect strategy, there will always be factors that can be thought of in advance to improve the strategy.

Back to top

info

Back to top


About Ezekiel Chew​

Ezekiel Chew, founder and head of training at Asia Forex Mentor, is a renowned forex expert, frequently invited to speak at major industry events. Known for his deep market insights, Ezekiel is one of the top traders committed to supporting the trading community. Making six figures per trade, he also trains traders working in banks, fund management, and prop trading firms.

Is Forex Trading Profitable for Most Traders

Is forex trading profitable? The honest answer is yes, but not in the way most people entering the market expect it to be. Forex trading is profitable for a minority of traders. Most retail traders lose money. That is not a secret. Brokers in the European Union must disclose the

Read More

Understanding What Is Price Action Trading in 2026

What is price action trading and why do institutional traders rely on it while most retail traders still lose money with indicators? Price action trading is the method of making trading decisions based entirely on the market’s price chart. No lagging indicators, moving averages. No RSI or MACD cluttering the

Read More

What Is Revenge Trading And How To Prevent It In Forex

ABOUT THIS GUIDE Written by Ezekiel Chew, founder of Asia Forex Mentor and a former bank trader with over 20 years of experience. Ezekiel has coached more than 100,000 students across Singapore, the Philippines, Malaysia, Indonesia, and over 50 countries through the AFM One Core Program. Revenge trading is one

Read More

What Is a Stop Loss Before You Lose Another Trade

What is a stop loss? It is the one trading instruction that separates traders who survive from those who blow their accounts. Most traders understand the concept. Far fewer use it correctly. A stop loss is not just a safety net. It is a pre-defined decision made before emotion enters

Read More

AFM Trading Summit Live

Date: Coming Soon

Join us at the AFM Trading Summit Live and learn from top industry experts through live trading sessions, market insights, and actionable strategies.

Bull Trap – What does it do?

4.0
Overall Trust Index

Written by:

Updated:

January 29, 2025

Bull trap

A bull trap is a false signal, referring to a declining trend in a stock, index, or other security that reverses after a convincing rally and breaks a prior support level. The move "traps" traders or investors that acted on the buy signal and generates losses on resulting long positions. A bull trap may also refer to a whipsaw pattern. The bull trap often occurs when price approaches a resistance level, often nearing a breakout. The bull trap takes place when the bears are doing the best to prevent a bullish breakout, causing the price to spike and then pull back below the resistance. In such instances, the bull trap may often also be known as a fake out or a false break out. This strategy is designed to minimize the scenarios of traders being caught in the premature break out and thus being stopped out by the market. However, to perfect the concept of this strategy one must ultimately master the timing to place pending orders which can be done better when the foundations of market reading is strong.

Bull trap - Quick Setup Tutorial


Content

  1. Goal of the article (FAQ)
  2. Bull trap for beginners
  3. How to use
  4. Is it possible/ feasible?
  5. Trade rules
  6. Pros and cons
  7. Analysis
  8. Conclusion
  9. Info

Goal of the article (FAQ)

This article aims to answer all of the frequently asked questions that traders have regarding the bull trap pattern, such as:

    1. What is a bull trap?/ What is a bull market trap?/ What is a bull trap chart?/ How to identify a bull trap?
    2. How to spot a bull trap?/ What does a bull trap look like?
    3. What does trap mean?
    4. How to read a bull trap?
    5. Why is it called a bull trap?

Back to top

Bull trap for beginners

To understand the bull trap better, let us zoom into the root cause of its occurrence. A bull trap occurs when a trader or investor buys a security that breaks out above a resistance level—a common technical analysis-based strategy. While many breakouts are followed by strong moves higher, the security may quickly reverse direction. These are known as "bull traps" because traders and investors who bought the breakout are "trapped" in the trade. This often leads to revenge trading as emotions stir throughout the course of this roller coaster ride. This is true especially for beginners, which in turn causes detrimental damages to their account. Hence, it is important to set emotions aside whenever you trade as emotions tend to influence and impair the decision-making capability of traders. It is important to understand that in trading, you are your greatest enemy. Always take a step back to reassess and reanalyse the market context and situation before executing another trade based on impulse. This strategy is suited for beginners to use as it is simplified to be understood easily. However, since it is simplified, beginners can trade it without fully understanding how to read price action in the market. This is tantamount to blindly trading the market, which is not recommended. Although simplified, no strategy is perfect, meaning that there will be anomalies happening that go against the theories of the strategy thus causing the trade to fail. As such, this can be avoided by proper technical analysis and understanding before the execution of the trade plan.

Also read: 50 Pips A Day Forex Strategy

Back to top

How to use

The bull trap strategy is simple and easy to use. The bull trap pattern is easily identified by a candle with a long wick above a resistance level or even in a series of candles, like a long bullish candle followed by a bearish candle of equal or greater size. To prevent a bull trap, firstly, we have to identify the major resistance of the market. In other words, a potential breakout zone. For that it is crucial to have mastered the understanding of identifying and applying support and resistances to your charts. After identifying the major resistance level, we would want to wait for prices to find a support level near the major resistance hence waiting for it to range and consolidate in between. Now we have a “build up” area. This “build up” area is crucial as it gives prices the opportunity to rest before a major break out. As compared to prices surging rapidly from a lower price, which have a higher chance of forming a bull trap since the momentum is exhausted from a lower price point, the consolidation in the “build up” area allows prices to rest before accumulating bullish momentum again for another breakout. This minimizes the chances of the trader being trapped in a break out that has its momentum decreased over time. Once the “build up” area has been identified, the trade plan can be carried out and thus be executed later on.

Back to top

Is it possible/ feasible?

To determine the feasibility of this strategy, we must first break down how the prices move in the market. The movement of prices are determined by a few factors but mainly, volume and buy and sell orders. When the volume of buyers is relatively high, the prices become more bullish and volatility increases, causing the breakout to take place. As the breakout continues sell orders get its stop losses hit, which is equivalent to more buy orders taking place. This causes the bullish momentum to be amplified, increasing the volume and volatility of the prices. By trading in the consolidation zone, or in this case the “build up” area near the resistance zone, more selling orders executed near the resistance zone can be stopped out as prices break the major resistance, providing “extra fuel” for the bullish breakout. This makes the strategy more reliable since it trades the breakout at the bottom when the momentum is at its peak, ultimately allowing the trader to avoid the bull trap scenario at a higher probability. Hence, the strategy is theoretically feasible. However, there might be instances where it may fail, for example, if there is a huge surge of sell orders, the momentum maybe very bearish, causing the market to go against the strategy.

Also read: Algorithmic Trading Strategies

Back to top

Trade rules

To apply this strategy, plot the major resistance in the time frame of your choice. This can be done by identifying the level where prices tend to respect. Next, wait for a support level to form and price to consolidate. Similarly, identify the level where prices respect as support. Afterwards, once the “build up” area is identified, allow prices to consolidate for a few candles’ worth of time. Prices may attempt to break above resistance at this stage, but it is highly likely that it will be a bull trap. After prices aggressively tested the resistance, set a pending order above the resistance and stop loss order below the support of the “build up” area. Leave the take profit order blank as we will be using trail stops to determine our profit taking level. As prices surge and form new support levels, trail the stop loss order below the new support levels. Rinse and repeat the trailing system until the trade is stopped out by the market.

Trading rules

Back to top

Pros and cons

The pros of using the bull trap strategy are that firstly, it is a simplified strategy that is easy to learn and apply. Because of the simplicity, it is also beginner friendly allowing beginners to trade breakouts without knowledge of the market. Second of all, the strategy is engineered in a way to overcome one of the problems that many traders often face, getting bull trapped in a breakout. This is a widely faced problem even for experienced traders and this strategy offers one of the many solutions to minimize and even prevent the probability of getting faked out in the market by the inclusion of trail stops and “build up” areas. The “build up” area derives from the logical approach to the bull trap problem as it breaks down the factors affecting the strength of a breakout and focuses on maximizing them to suit the strategy better. Lastly, with the trail stop implemented, traders are able to capture majority of the profits while reducing losses as more free trades are generated as stop losses are moved to break even. At the same time, trail stops prevent the risk of getting dumped in the market by whales giving the strategy a safe and beneficial approach.

In contrast, the strategy is highly dependent on price action understanding. By understanding candlestick representations and price action, traders can enhance the win rate and the odds of entering the orders prematurely. Also, this strategy requires a good knowledge of one of the key basic concepts in trading, support and resistance, which often tends to be subjective. Which a shaky foundation of understanding and thus identifying the key levels in the market would mean that the trades would be executed inaccurately thence leading to higher lose rates.

pros and cons

Back to top

Analysis

To find out the profitability of the Bull trap trading strategy, we decided to do a back test based on the past 10 trades from 23 Jul 21 on the H4 timeframe. The rules for entry will be the same as what was mentioned above. We will be back testing this throughout 3 types of trading vehicles, namely, EURUSD for forex, US30(DJI) for stocks and BTCUSD for cryptocurrency. For simplicity, we will assume that all trades taken have a risk of 1% of the account.

Definitions:  Avg Risk reward ratio= ( Total risk reward ratio of winning trades/ total no. of wins) Profitability (% gain)= (no. of wins* reward)- (no of losses* 1) [ Risk is 1%]

An example of the application of the strategy is as shown:

analysis

For the Backtest results, trades with blue and yellow zones indicate an overall win with the blue zone as reward and the yellow zone as the risk taken.

As shown in our backtest, the win rate of this strategy for EURUSD (Forex) is 50%, AAPL (Stocks) is 60% and BTC (Crypto) is 60%

The average risk reward ratio of this strategy for EURUSD (Forex) is 1.72 US30 (Stocks) is 1.89 and BTC (Crypto) is 1.94.

The profitability of this strategy for EURUSD (Forex) is 3.6, AAPL (Stocks) is 7.34 and BTC (Crypto) is 7.64.

Also read: Parabolic Sar Tested And Explained

analysis 2

Back to top

Conclusion

In conclusion, the bull trap strategy is a rather reliable solution to the bull trap problem that many traders would face. It is able to deliver a relatively good win rate with decent risk to reward ratios, ultimately making it profitable in the long run. Though this strategy is profitable, it relies heavily on technical analysis experience to maintain or improve its win rate. Lacking in any of the basics of technical analysis will cause the strategy to fail majority of the time. As mentioned before, premature entries due to lack of market experience can result in getting stopped out for this strategy. Also, the stoploss of the strategy is heavily dependent on the size of the “build up” area before the breakout. This in turn influences the risk to reward ratio of the trades taken and thus the profitability of the strategy. Ultimately the size of the “build up” area varies on the characteristics of the pair that is being traded. In other words, there are many factors that affects this strategy that should also be considered when coming up with a trade plan. While there is no perfect strategy, there will always be factors that can be thought of in advance to improve the strategy.

Back to top

info

Back to top


ezekiel chew asiaforexmentor

About Ezekiel Chew

Ezekiel Chew, founder and head of training at Asia Forex Mentor, is a renowned forex expert, frequently invited to speak at major industry events. Known for his deep market insights, Ezekiel is one of the top traders committed to supporting the trading community. Making six figures per trade, he also trains traders working in banks, fund management, and prop trading firms.

RELATED ARTICLES

Bull Trap – What does it do?

4.0
Overall Trust Index

Written by:

Updated:

January 29, 2025

Bull trap

A bull trap is a false signal, referring to a declining trend in a stock, index, or other security that reverses after a convincing rally and breaks a prior support level. The move "traps" traders or investors that acted on the buy signal and generates losses on resulting long positions. A bull trap may also refer to a whipsaw pattern. The bull trap often occurs when price approaches a resistance level, often nearing a breakout. The bull trap takes place when the bears are doing the best to prevent a bullish breakout, causing the price to spike and then pull back below the resistance. In such instances, the bull trap may often also be known as a fake out or a false break out. This strategy is designed to minimize the scenarios of traders being caught in the premature break out and thus being stopped out by the market. However, to perfect the concept of this strategy one must ultimately master the timing to place pending orders which can be done better when the foundations of market reading is strong.

Bull trap - Quick Setup Tutorial


Content

  1. Goal of the article (FAQ)
  2. Bull trap for beginners
  3. How to use
  4. Is it possible/ feasible?
  5. Trade rules
  6. Pros and cons
  7. Analysis
  8. Conclusion
  9. Info

Goal of the article (FAQ)

This article aims to answer all of the frequently asked questions that traders have regarding the bull trap pattern, such as:

    1. What is a bull trap?/ What is a bull market trap?/ What is a bull trap chart?/ How to identify a bull trap?
    2. How to spot a bull trap?/ What does a bull trap look like?
    3. What does trap mean?
    4. How to read a bull trap?
    5. Why is it called a bull trap?

Back to top

Bull trap for beginners

To understand the bull trap better, let us zoom into the root cause of its occurrence. A bull trap occurs when a trader or investor buys a security that breaks out above a resistance level—a common technical analysis-based strategy. While many breakouts are followed by strong moves higher, the security may quickly reverse direction. These are known as "bull traps" because traders and investors who bought the breakout are "trapped" in the trade. This often leads to revenge trading as emotions stir throughout the course of this roller coaster ride. This is true especially for beginners, which in turn causes detrimental damages to their account. Hence, it is important to set emotions aside whenever you trade as emotions tend to influence and impair the decision-making capability of traders. It is important to understand that in trading, you are your greatest enemy. Always take a step back to reassess and reanalyse the market context and situation before executing another trade based on impulse. This strategy is suited for beginners to use as it is simplified to be understood easily. However, since it is simplified, beginners can trade it without fully understanding how to read price action in the market. This is tantamount to blindly trading the market, which is not recommended. Although simplified, no strategy is perfect, meaning that there will be anomalies happening that go against the theories of the strategy thus causing the trade to fail. As such, this can be avoided by proper technical analysis and understanding before the execution of the trade plan.

Also read: 50 Pips A Day Forex Strategy

Back to top

How to use

The bull trap strategy is simple and easy to use. The bull trap pattern is easily identified by a candle with a long wick above a resistance level or even in a series of candles, like a long bullish candle followed by a bearish candle of equal or greater size. To prevent a bull trap, firstly, we have to identify the major resistance of the market. In other words, a potential breakout zone. For that it is crucial to have mastered the understanding of identifying and applying support and resistances to your charts. After identifying the major resistance level, we would want to wait for prices to find a support level near the major resistance hence waiting for it to range and consolidate in between. Now we have a “build up” area. This “build up” area is crucial as it gives prices the opportunity to rest before a major break out. As compared to prices surging rapidly from a lower price, which have a higher chance of forming a bull trap since the momentum is exhausted from a lower price point, the consolidation in the “build up” area allows prices to rest before accumulating bullish momentum again for another breakout. This minimizes the chances of the trader being trapped in a break out that has its momentum decreased over time. Once the “build up” area has been identified, the trade plan can be carried out and thus be executed later on.

Back to top

Is it possible/ feasible?

To determine the feasibility of this strategy, we must first break down how the prices move in the market. The movement of prices are determined by a few factors but mainly, volume and buy and sell orders. When the volume of buyers is relatively high, the prices become more bullish and volatility increases, causing the breakout to take place. As the breakout continues sell orders get its stop losses hit, which is equivalent to more buy orders taking place. This causes the bullish momentum to be amplified, increasing the volume and volatility of the prices. By trading in the consolidation zone, or in this case the “build up” area near the resistance zone, more selling orders executed near the resistance zone can be stopped out as prices break the major resistance, providing “extra fuel” for the bullish breakout. This makes the strategy more reliable since it trades the breakout at the bottom when the momentum is at its peak, ultimately allowing the trader to avoid the bull trap scenario at a higher probability. Hence, the strategy is theoretically feasible. However, there might be instances where it may fail, for example, if there is a huge surge of sell orders, the momentum maybe very bearish, causing the market to go against the strategy.

Also read: Algorithmic Trading Strategies

Back to top

Trade rules

To apply this strategy, plot the major resistance in the time frame of your choice. This can be done by identifying the level where prices tend to respect. Next, wait for a support level to form and price to consolidate. Similarly, identify the level where prices respect as support. Afterwards, once the “build up” area is identified, allow prices to consolidate for a few candles’ worth of time. Prices may attempt to break above resistance at this stage, but it is highly likely that it will be a bull trap. After prices aggressively tested the resistance, set a pending order above the resistance and stop loss order below the support of the “build up” area. Leave the take profit order blank as we will be using trail stops to determine our profit taking level. As prices surge and form new support levels, trail the stop loss order below the new support levels. Rinse and repeat the trailing system until the trade is stopped out by the market.

Trading rules

Back to top

Pros and cons

The pros of using the bull trap strategy are that firstly, it is a simplified strategy that is easy to learn and apply. Because of the simplicity, it is also beginner friendly allowing beginners to trade breakouts without knowledge of the market. Second of all, the strategy is engineered in a way to overcome one of the problems that many traders often face, getting bull trapped in a breakout. This is a widely faced problem even for experienced traders and this strategy offers one of the many solutions to minimize and even prevent the probability of getting faked out in the market by the inclusion of trail stops and “build up” areas. The “build up” area derives from the logical approach to the bull trap problem as it breaks down the factors affecting the strength of a breakout and focuses on maximizing them to suit the strategy better. Lastly, with the trail stop implemented, traders are able to capture majority of the profits while reducing losses as more free trades are generated as stop losses are moved to break even. At the same time, trail stops prevent the risk of getting dumped in the market by whales giving the strategy a safe and beneficial approach.

In contrast, the strategy is highly dependent on price action understanding. By understanding candlestick representations and price action, traders can enhance the win rate and the odds of entering the orders prematurely. Also, this strategy requires a good knowledge of one of the key basic concepts in trading, support and resistance, which often tends to be subjective. Which a shaky foundation of understanding and thus identifying the key levels in the market would mean that the trades would be executed inaccurately thence leading to higher lose rates.

pros and cons

Back to top

Analysis

To find out the profitability of the Bull trap trading strategy, we decided to do a back test based on the past 10 trades from 23 Jul 21 on the H4 timeframe. The rules for entry will be the same as what was mentioned above. We will be back testing this throughout 3 types of trading vehicles, namely, EURUSD for forex, US30(DJI) for stocks and BTCUSD for cryptocurrency. For simplicity, we will assume that all trades taken have a risk of 1% of the account.

Definitions:  Avg Risk reward ratio= ( Total risk reward ratio of winning trades/ total no. of wins) Profitability (% gain)= (no. of wins* reward)- (no of losses* 1) [ Risk is 1%]

An example of the application of the strategy is as shown:

analysis

For the Backtest results, trades with blue and yellow zones indicate an overall win with the blue zone as reward and the yellow zone as the risk taken.

As shown in our backtest, the win rate of this strategy for EURUSD (Forex) is 50%, AAPL (Stocks) is 60% and BTC (Crypto) is 60%

The average risk reward ratio of this strategy for EURUSD (Forex) is 1.72 US30 (Stocks) is 1.89 and BTC (Crypto) is 1.94.

The profitability of this strategy for EURUSD (Forex) is 3.6, AAPL (Stocks) is 7.34 and BTC (Crypto) is 7.64.

Also read: Parabolic Sar Tested And Explained

analysis 2

Back to top

Conclusion

In conclusion, the bull trap strategy is a rather reliable solution to the bull trap problem that many traders would face. It is able to deliver a relatively good win rate with decent risk to reward ratios, ultimately making it profitable in the long run. Though this strategy is profitable, it relies heavily on technical analysis experience to maintain or improve its win rate. Lacking in any of the basics of technical analysis will cause the strategy to fail majority of the time. As mentioned before, premature entries due to lack of market experience can result in getting stopped out for this strategy. Also, the stoploss of the strategy is heavily dependent on the size of the “build up” area before the breakout. This in turn influences the risk to reward ratio of the trades taken and thus the profitability of the strategy. Ultimately the size of the “build up” area varies on the characteristics of the pair that is being traded. In other words, there are many factors that affects this strategy that should also be considered when coming up with a trade plan. While there is no perfect strategy, there will always be factors that can be thought of in advance to improve the strategy.

Back to top

info

Back to top


ezekiel chew asiaforexmentor

About Ezekiel Chew

Ezekiel Chew, founder and head of training at Asia Forex Mentor, is a renowned forex expert, frequently invited to speak at major industry events. Known for his deep market insights, Ezekiel is one of the top traders committed to supporting the trading community. Making six figures per trade, he also trains traders working in banks, fund management, and prop trading firms.

RELATED ARTICLES

Join the Live Event
Get Your Free Ticket Now

I consent to receiving emails and/or text message reminders for this event.

REGISTER FOR THE MASTERCLASS!