Learn To Trade Forex • Best Forex Trading Course • AsiaForexMentor

Top Down Analysis and Why Most Traders Still Get It Wrong

Written by

Ezekiel Chew

Updated on

May 26, 2026

i
Its a default text

Top Down Analysis and Why Most Traders Still Get It Wrong

Written by:

Last updated on:

May 26, 2026

Hey, what's up guys? It's Ezekiel Chew here.

So if you ever wanted to stop reacting to every small candle movement and actually understand where the market is likely to move before it actually gets there, you are going to love this.

Because today I'm breaking down the exact top down analysis framework that I use to align the higher time frame structure with the lower time frame execution.

No more trading the five minute noise out there. No more guessing the direction. No more entering against the bigger trend without you realizing it.

Just a clear structured process that's going to show you where all the real key levels are sitting, who is in control on the higher time frame, and how to time your entry precisely on the lower time frame.

When you analyze from the top down, the market stops feeling chaotic. It starts feeling organized.

You are going to know the direction. You are going to know when to execute the trade.

Once you see how these time frames connect, your trading is going to start feeling calculated. It's not going to feel random anymore.

📺 Watch the full breakdown in this video:

What Top Down Analysis Actually Does

Top down analysis is a systematic approach used by professional traders, especially in forex trading, to gain a macro view of the market by first examining broad economic and market factors before narrowing down to specific trades.

It’s like looking at the big picture first, and then we drill down to identify all the key areas and trends that matter the most.

This method allows traders to avoid getting lost in the noise of the lower time frames and helps them make informed trading decisions by connecting macroeconomic factors to specific trading opportunities.

Now that we have touched the basics of what it is, I’m going to break down how this method actually works and why it’s crucial for your trading strategy.

STEP 1: Multi-Timeframe Market Breakdown

The Multi Time Frame Market Breakdown in Forex Trading strategies

To trade effectively, you need to start with the bigger picture by analyzing higher timeframes, such as monthly or weekly charts. Using charts at these levels allows you to identify major trends and determine key support and resistance zones.

Top down analysis is like looking at a map. You start by getting the overall view from a high vantage point using higher timeframes and long-term charts and then zoom into the details.
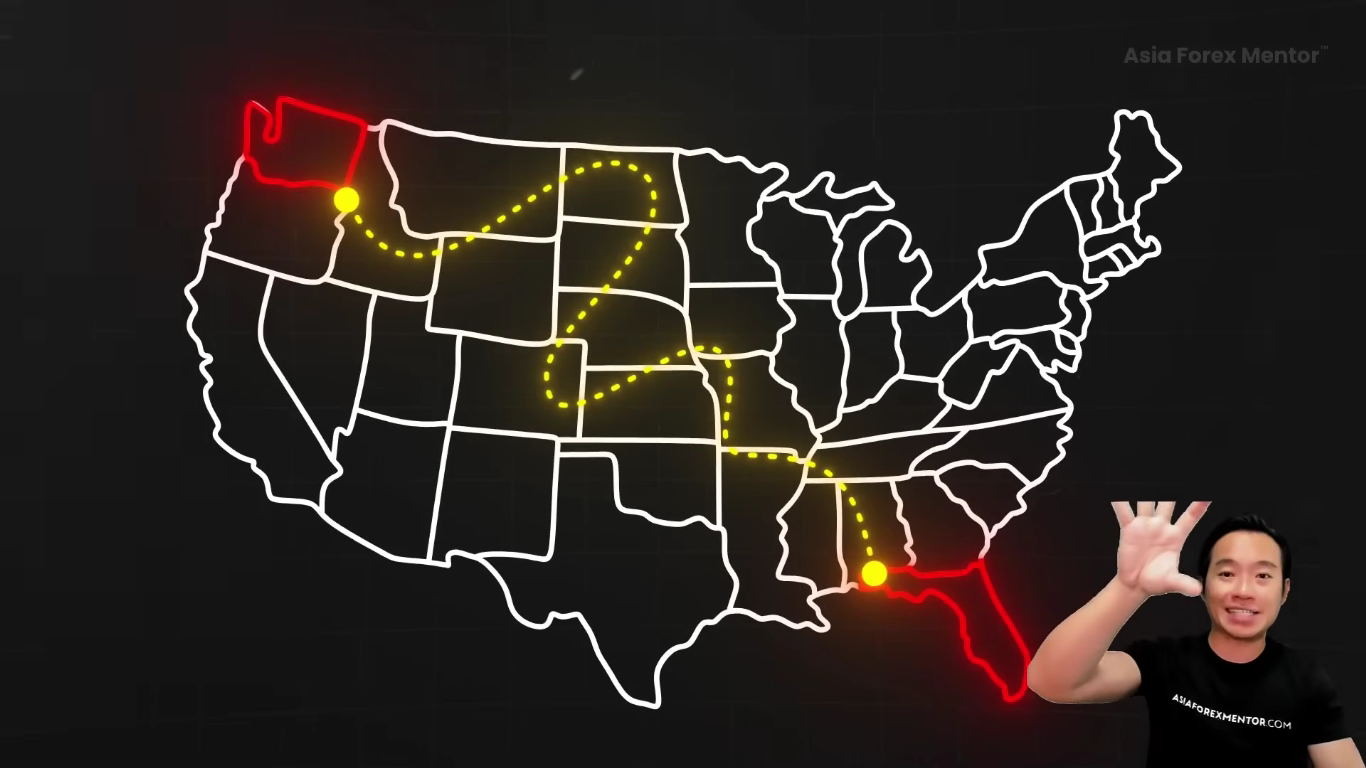
It helps us see the market’s big picture first by using charts to spot the overall trend and important levels.
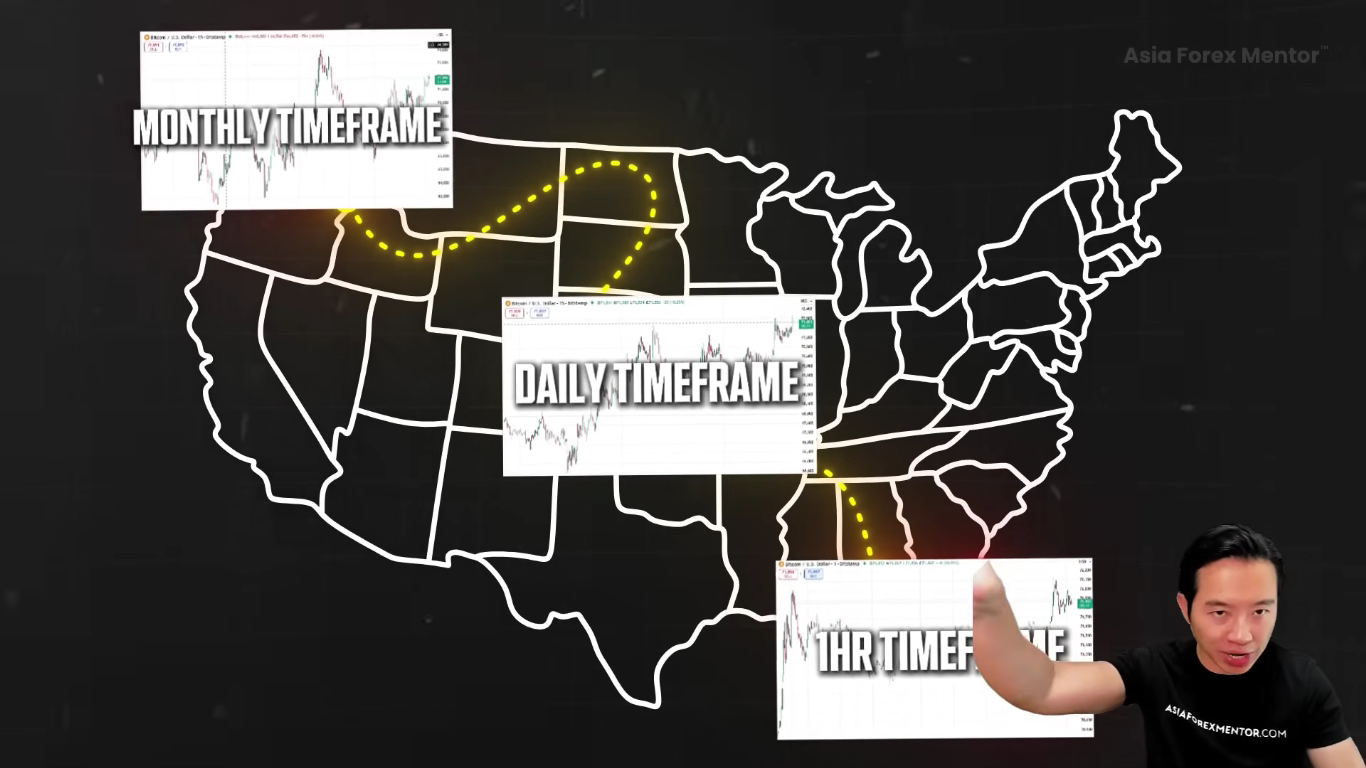
Higher timeframe confirmation almost always trumps lower timeframe signals, and professional traders generally plot key macro zones on higher timeframes while keeping lower charts clean to focus on entry criteria. Once we get that, we’re going to break things down by moving to the smaller time frames, like the one hour or the 15 minute chart. This is where we pinpoint all the perfect entry points. The power of this method lies in how the higher time frame gives us a clear sense of the market direction and all the crucial levels.

But here’s the thing.

If you start with the monthly chart
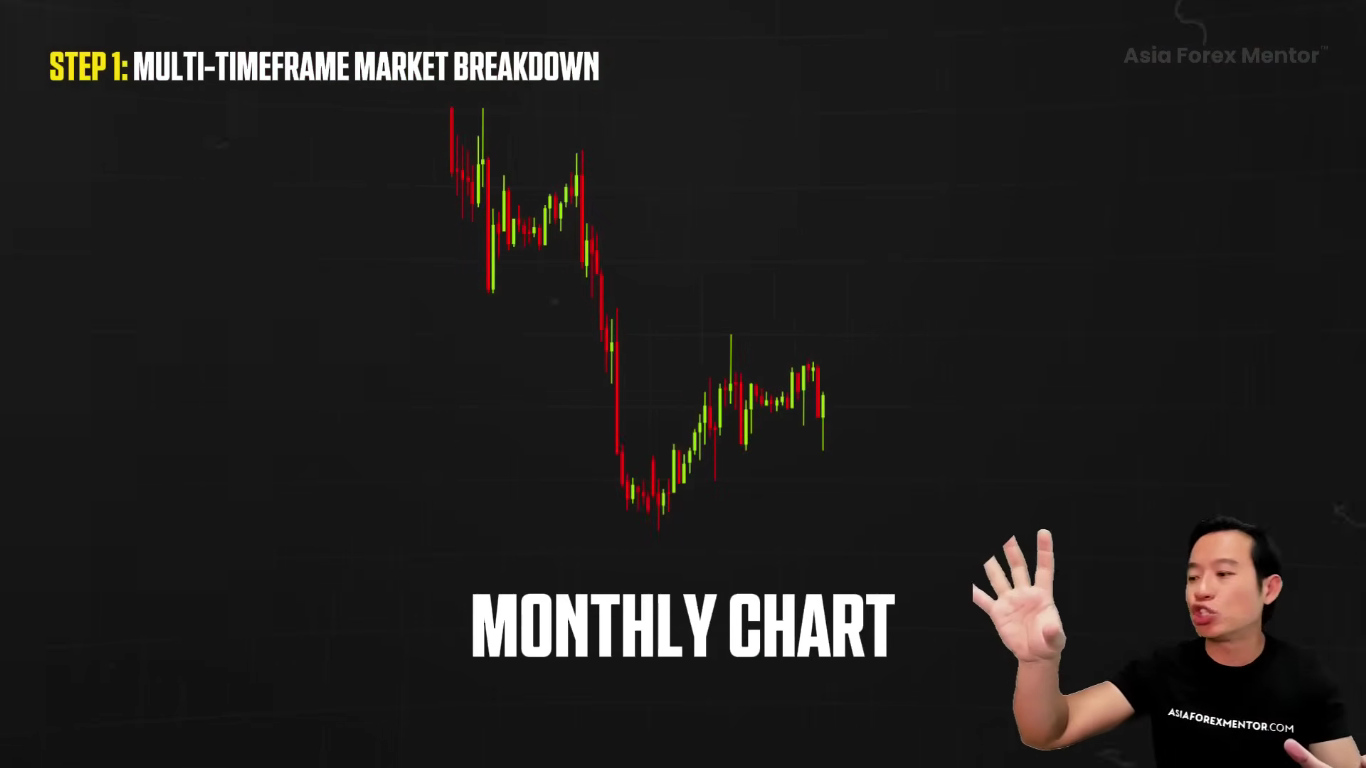
And then you try to apply all your knowledge at once, it’s going to be very easy to get overwhelmed with too much information.

This makes finding a clean setup a challenge.
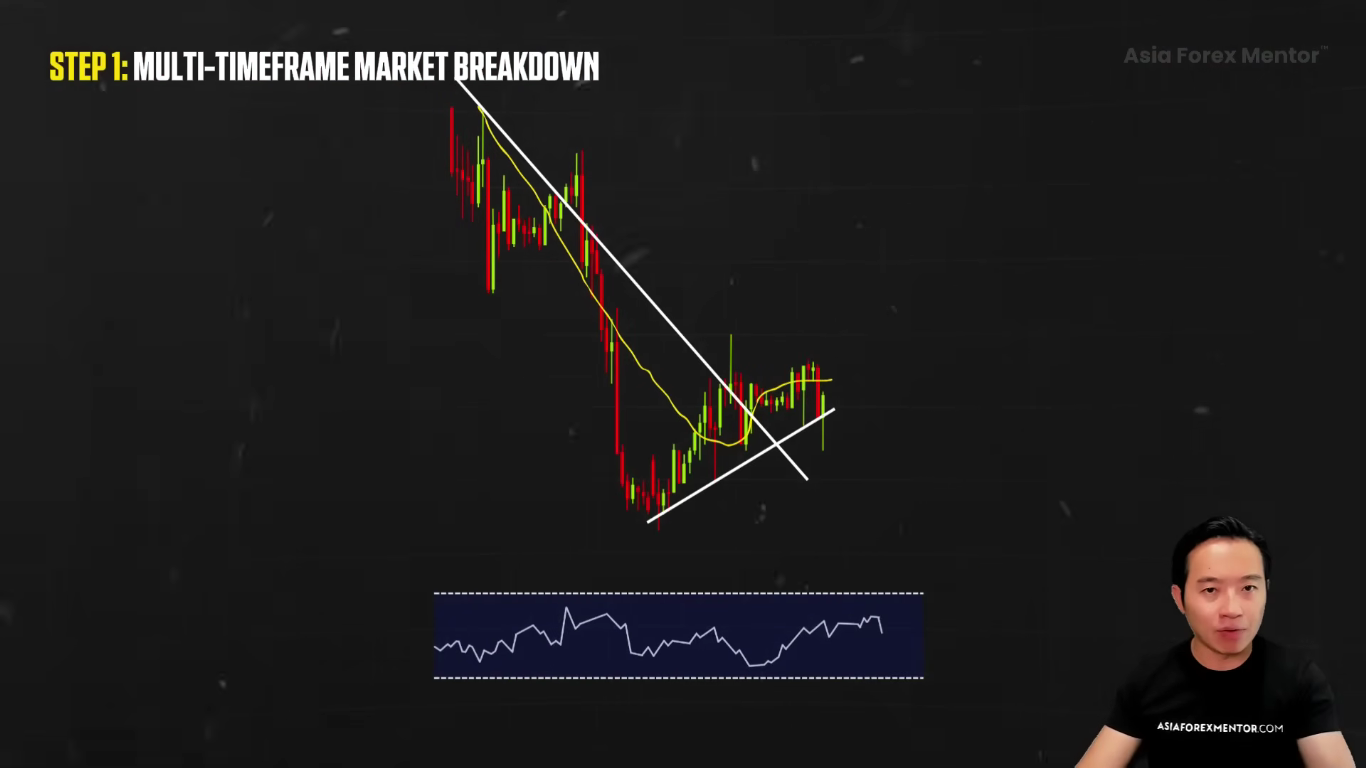
The key is knowing what to focus on for each time frame so our analysis stays sharp.

Avoiding the Confusion About Market Structure and Direction

Why does this approach matter? Let’s start with the first major advantage, which is avoiding the confusion about the market direction.

Let’s say we are looking at the five minute chart. It’s probably going to be a bit of a mess,
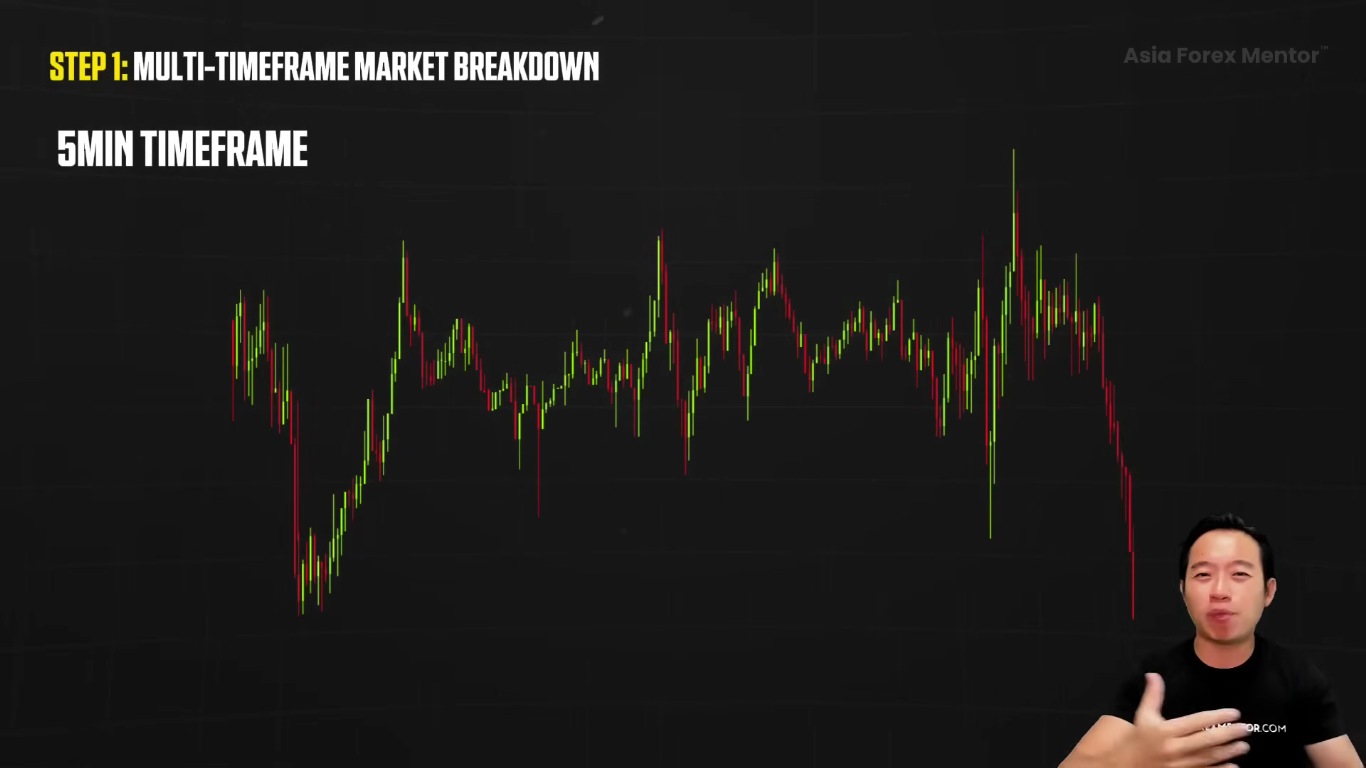
with price swinging back and forth, up and down in both directions.

There is no clear trend. The market is figuring out the direction.
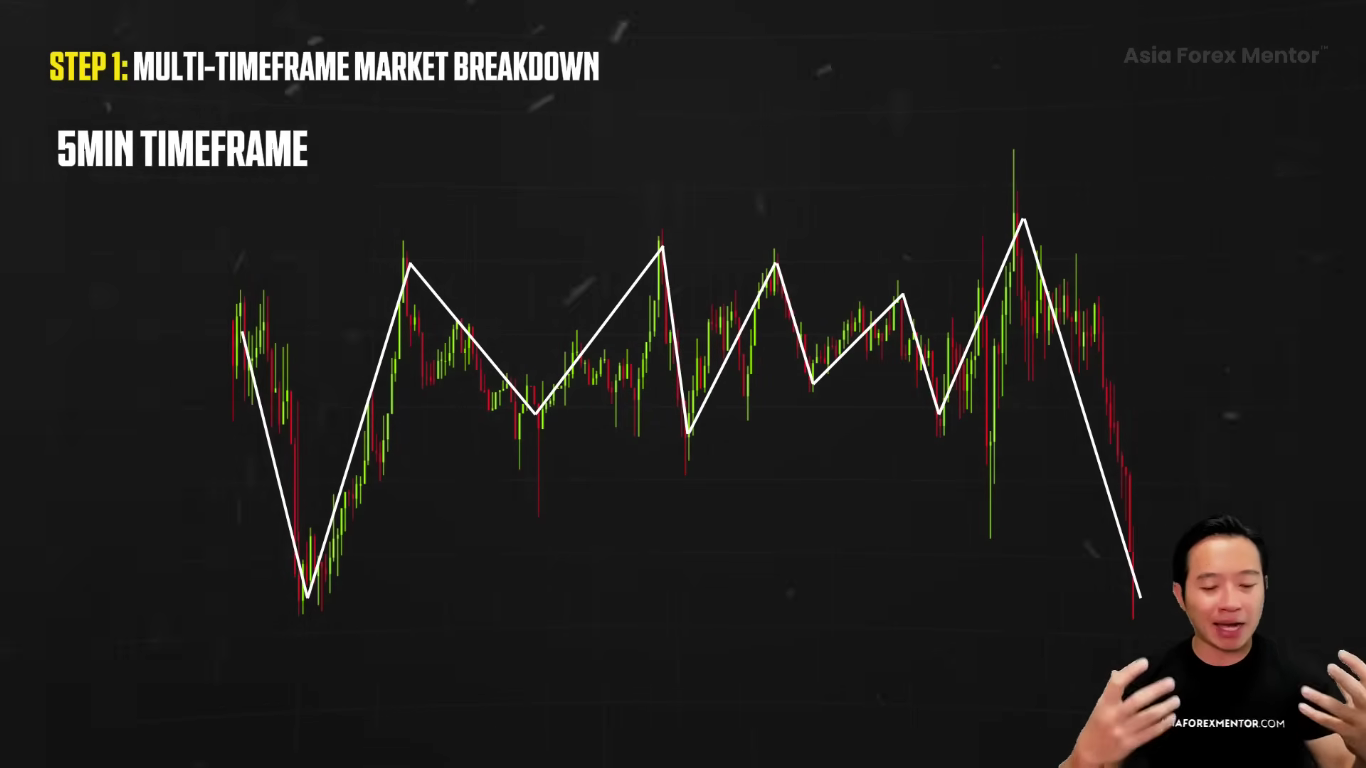
And for us, it feels like a guessing game. Should we buy? Should we sell? Where’s the direction?

But when we zoom out to the one hour chart, the bigger picture becomes clear.
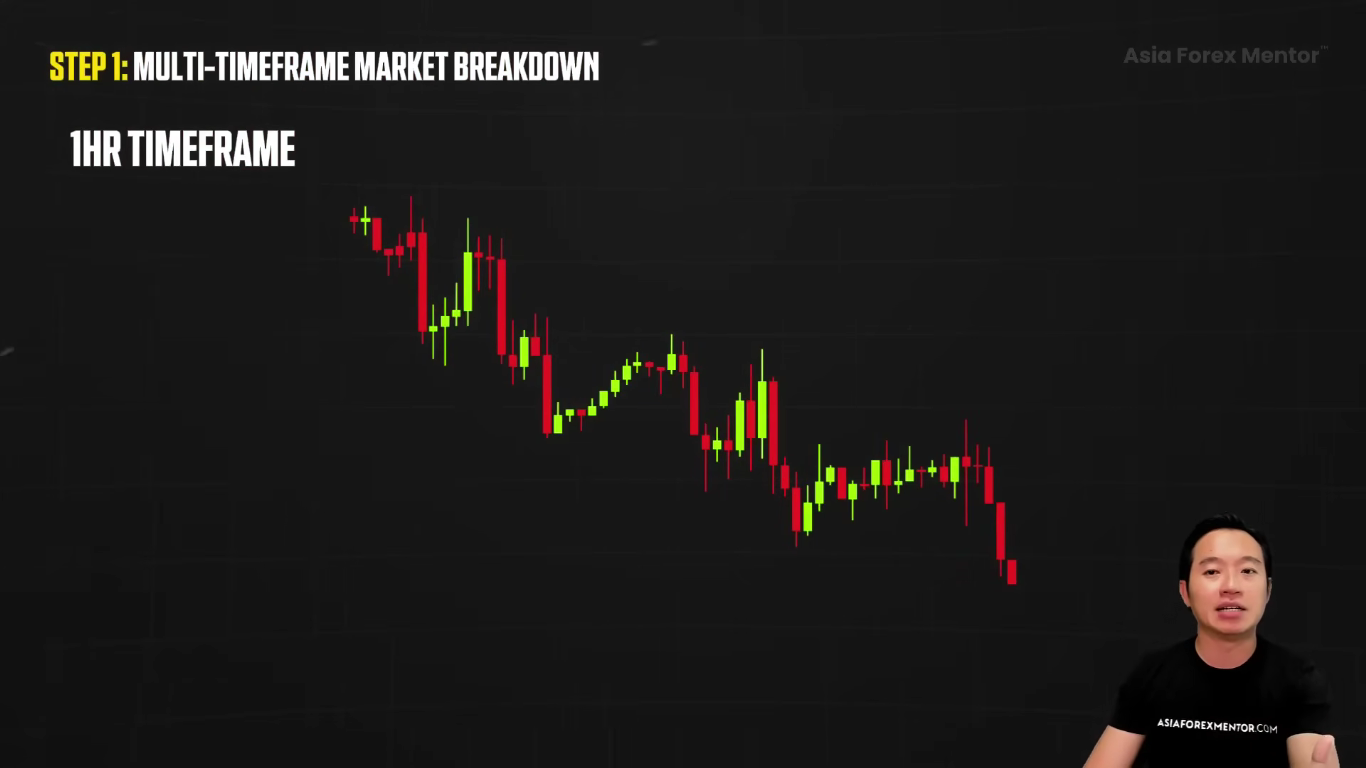
We quickly see the overall trend. And we would probably notice that there is bearish pressure taking over.
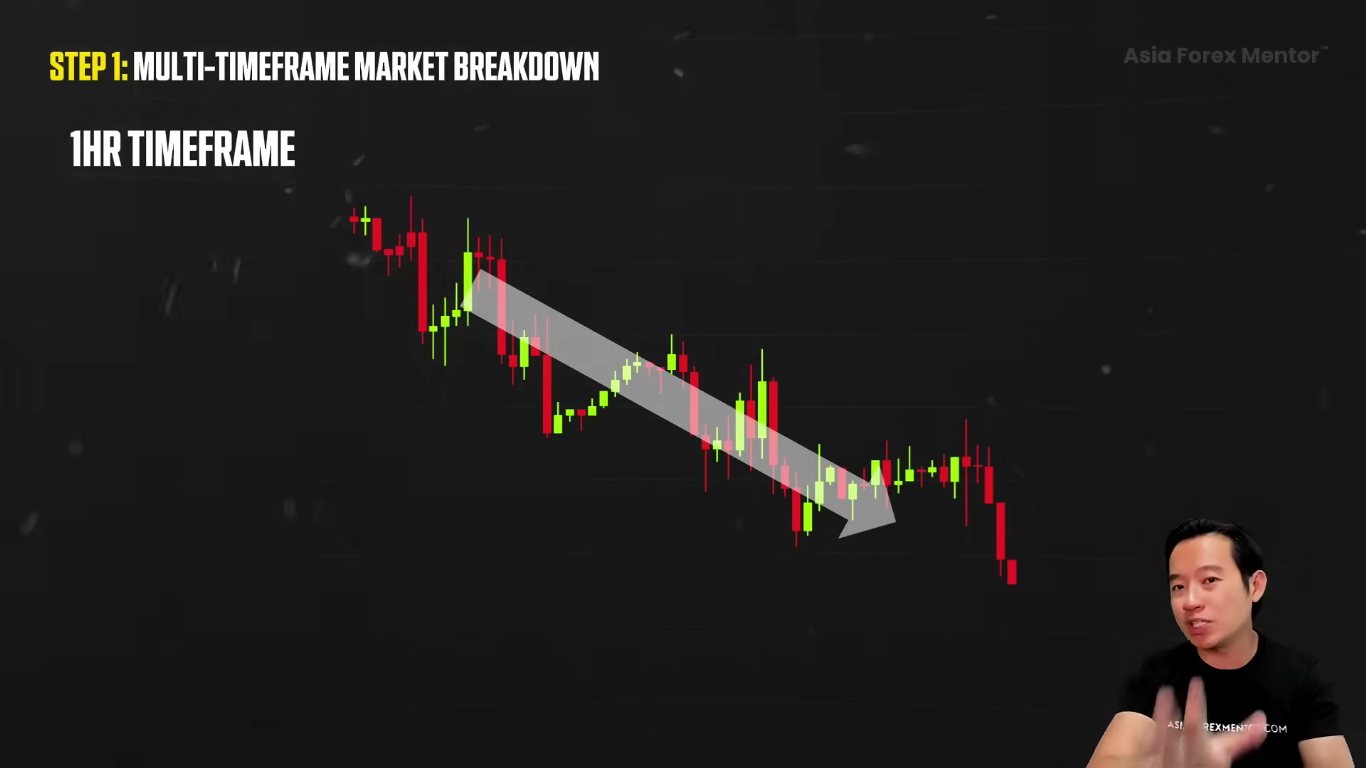
Once we spot that, we can move forward with more confidence, knowing that taking a short position makes sense in this case.
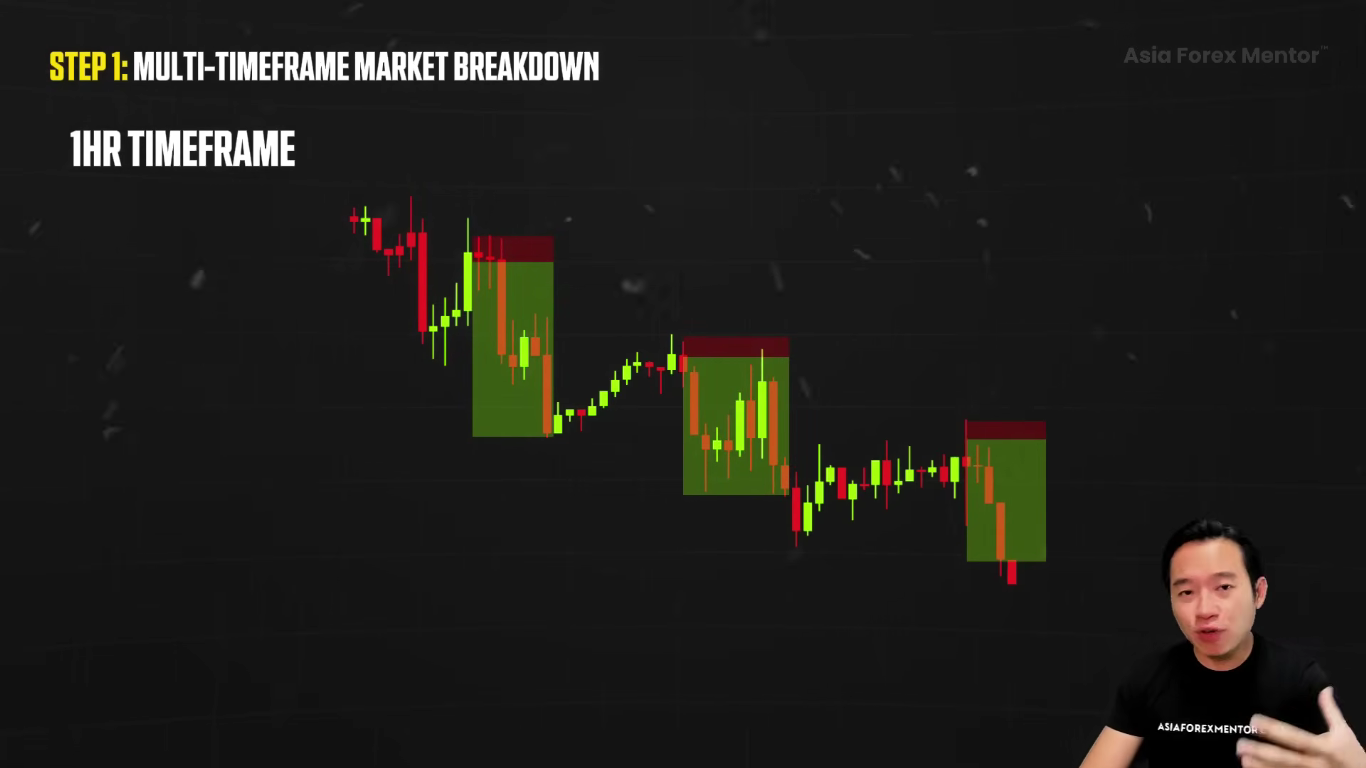
If you find yourself getting lost in all these short term movements, it’s likely that you are focused on the wrong time frame. Many traders fall into common pitfalls such as analysis paralysis, cluttering charts with too many indicators, and ignoring time-frame alignment, which can lead to confusion and poor trading decisions.

Now the second major benefit is for us to boost our accuracy.

A small price movement, like a slight reaction to a key level from a higher time frame, can signal a trend shift on a smaller time frame.

Before we dive into any trade, we want to understand how much room price has to move before it hits the important areas like the supply and demand zones.

This way we can avoid jumping into trades too early or jumping into trades too late, where there's no more room for the move.

This gives us control over our targets, our take profit targets, and also where our stop loss is going to be.

Ultimately, it's going to reduce our chances of losing trades or taking bad trades altogether.

Take a look at this, On the 15 minute chart
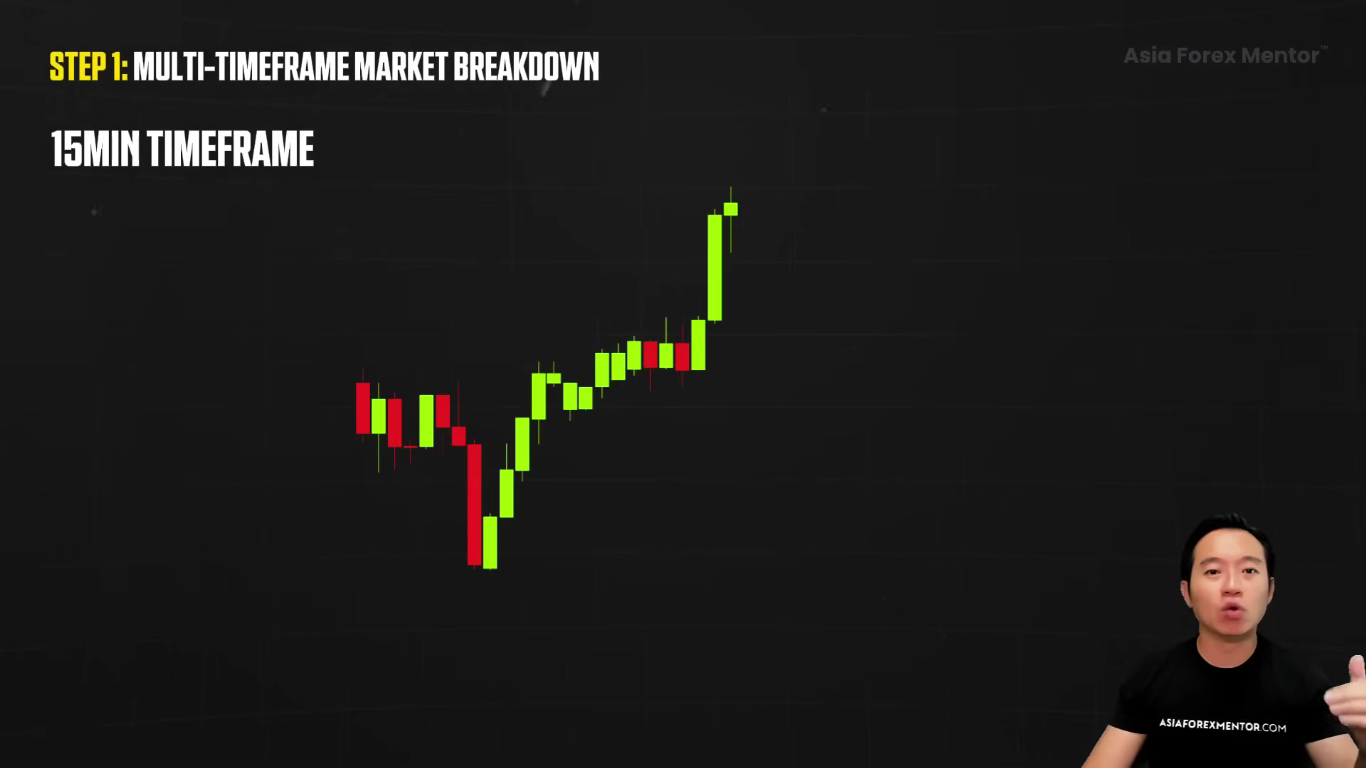
we see a strong bullish move
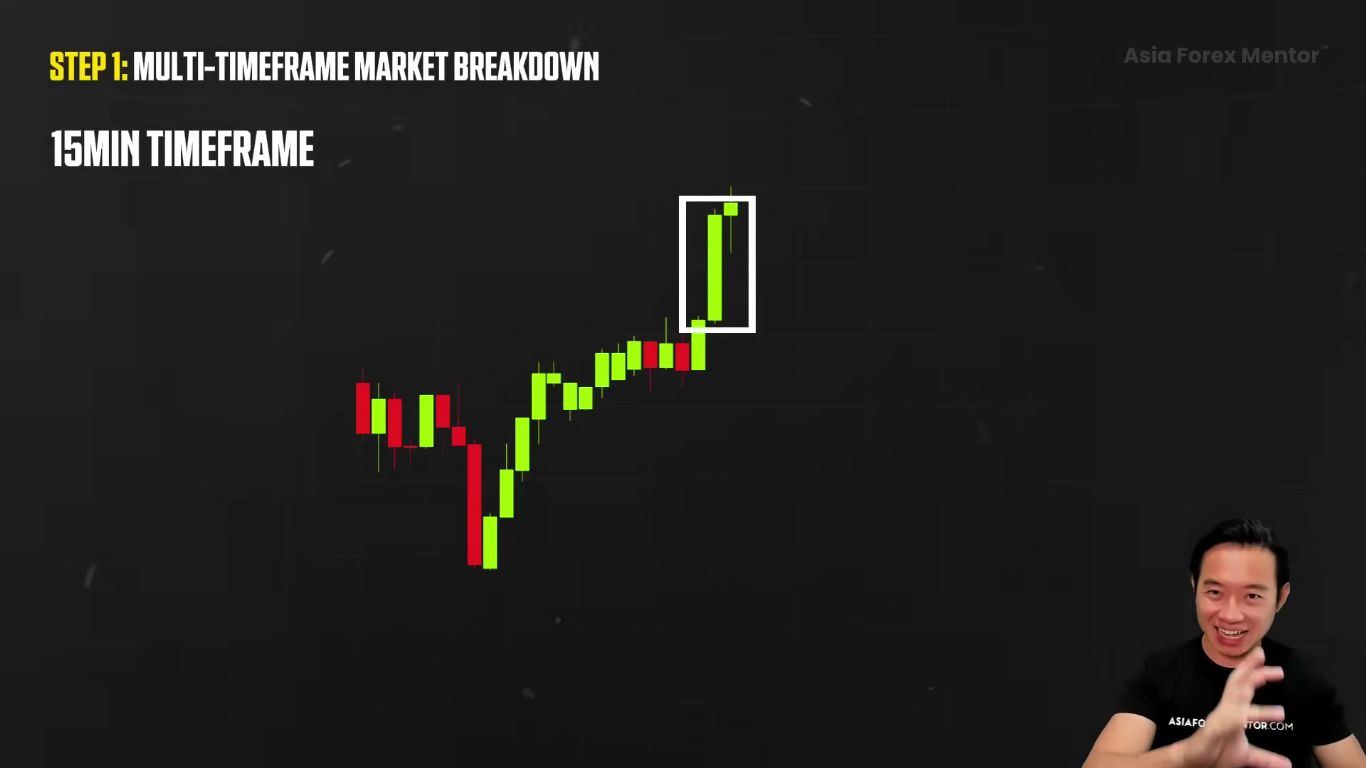
that left behind a pretty clear fair value gap. At first glance, this looks like a perfect setup to go long. To buy.
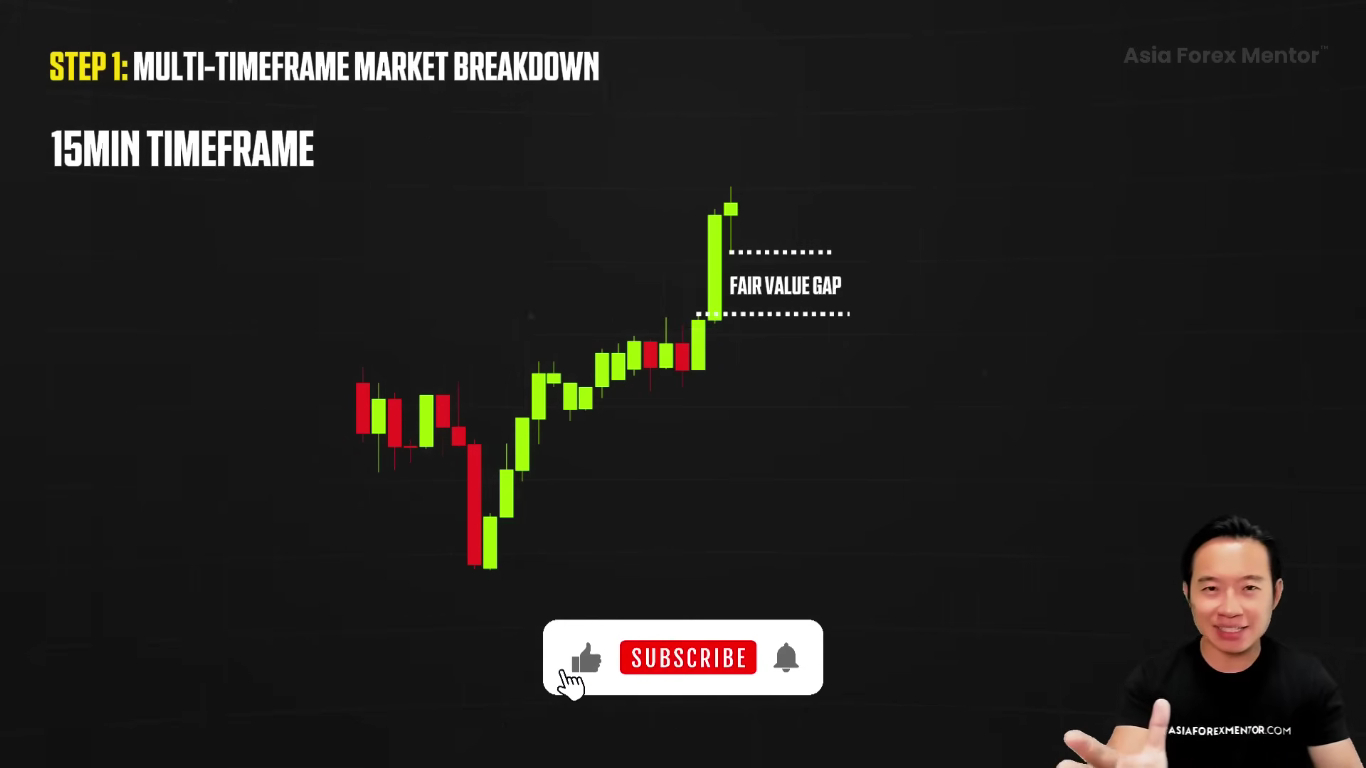
But then out of nowhere, the market flipped and reversed. Why did this happen?
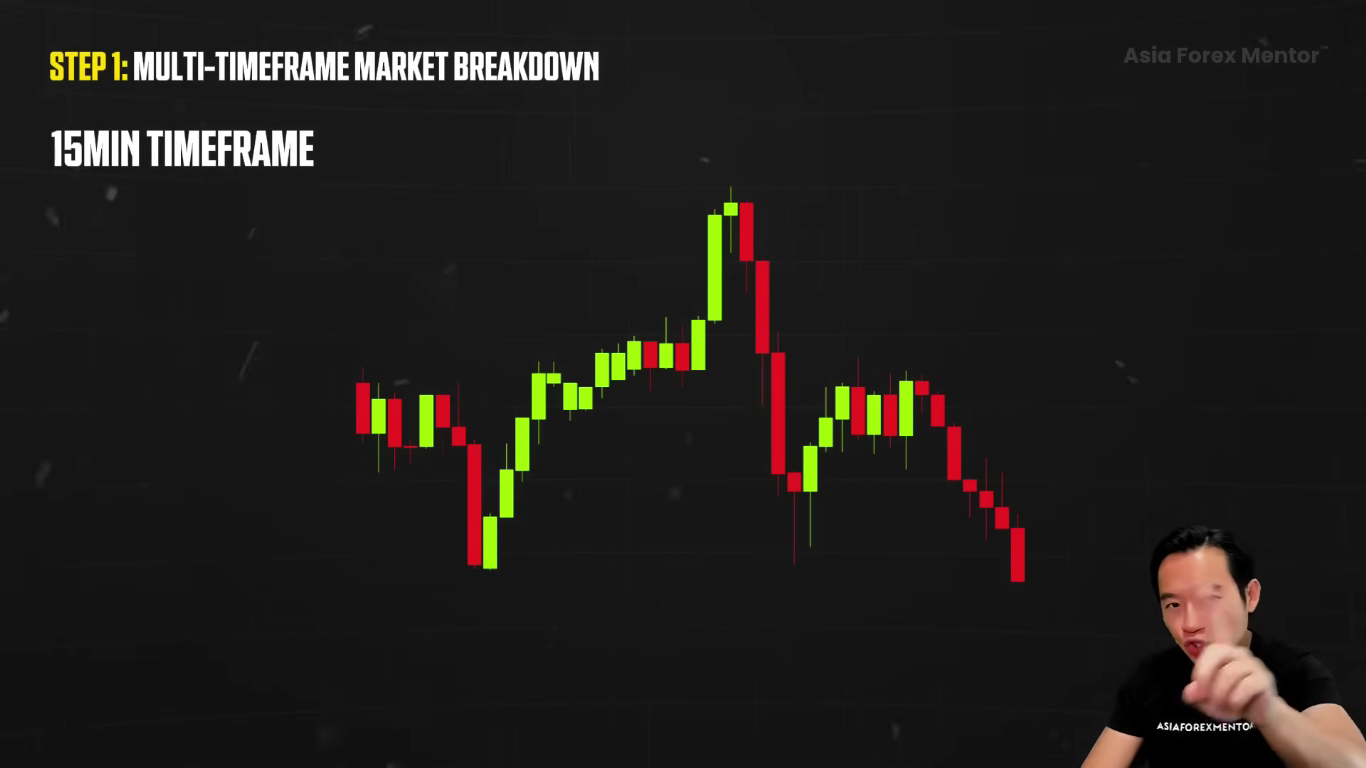
When we zoom out to the one hour time frame, it becomes clear why.
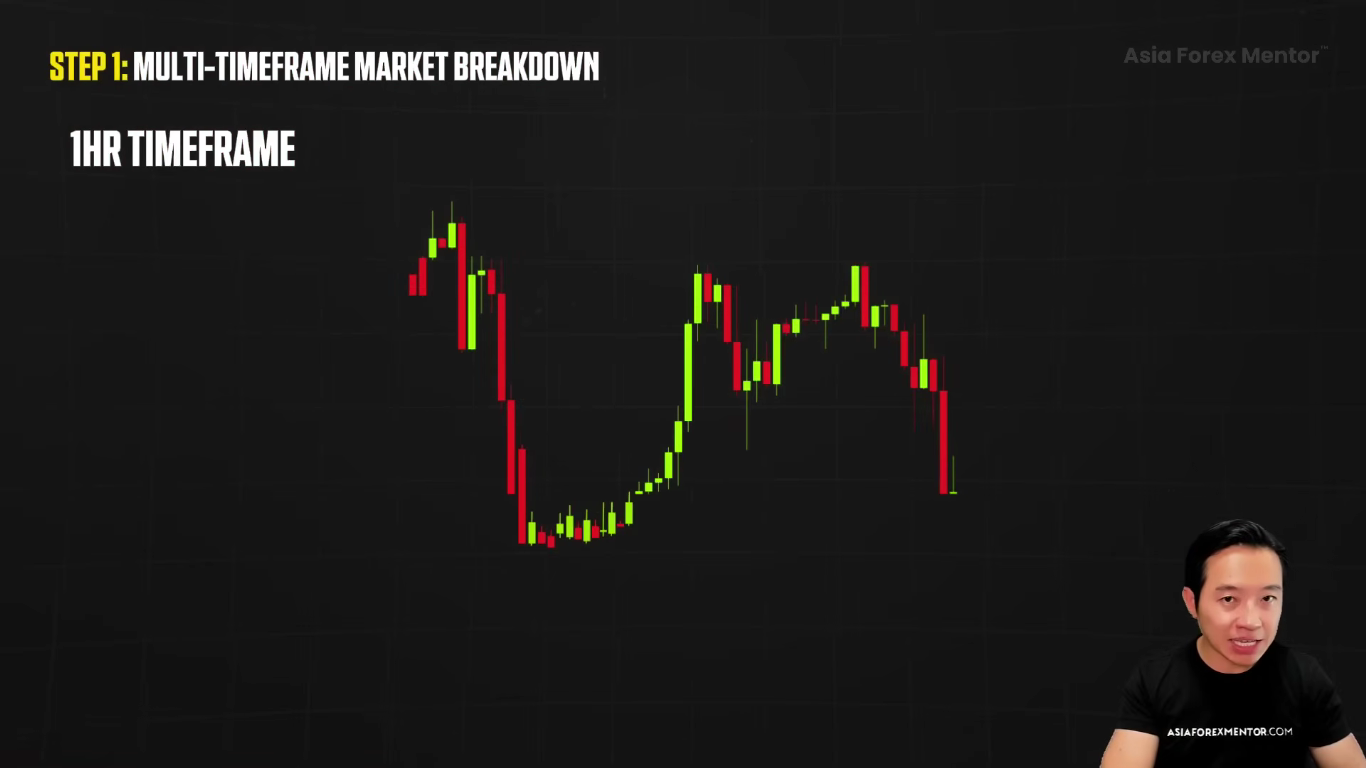
The reversal happened because price hit a key resistance level, one that acted as resistance multiple times before.
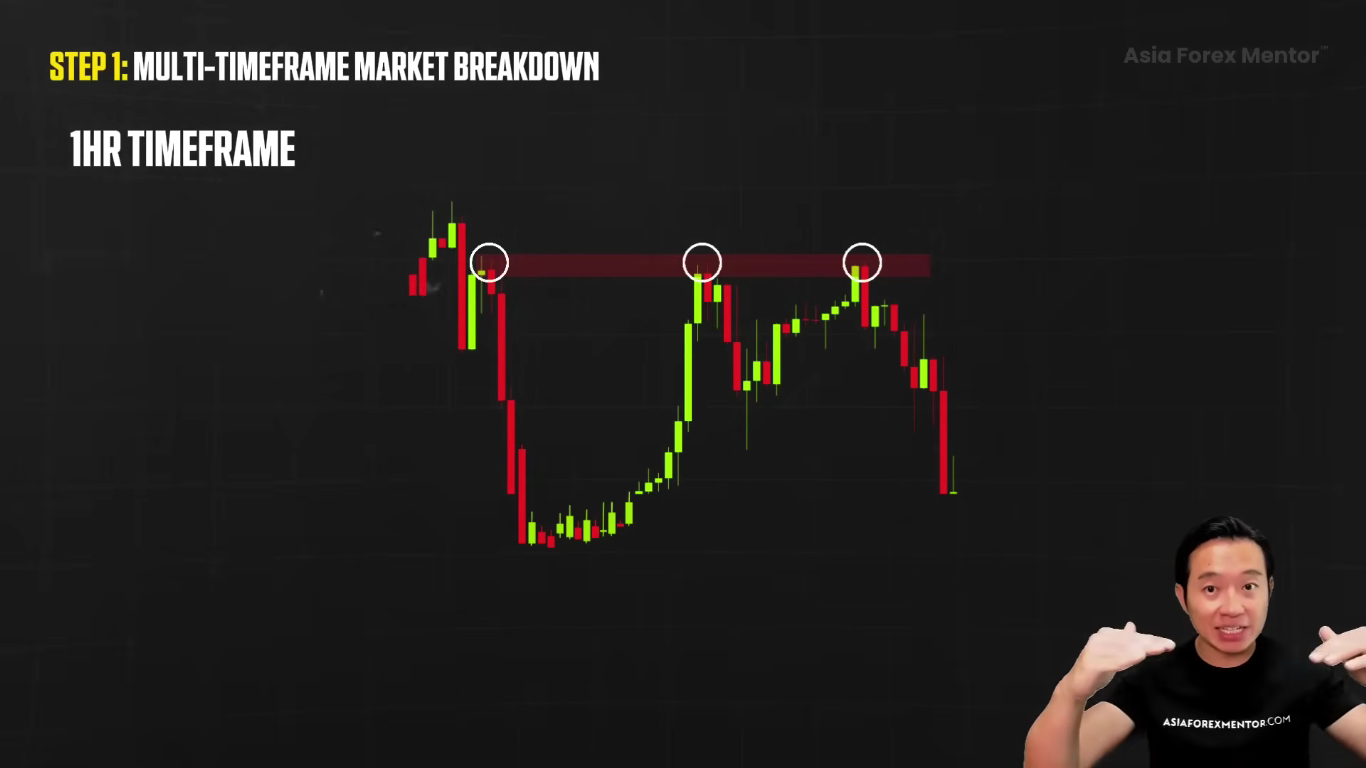
This is exactly why checking the higher time frame is so important before we even take a trade. It helps us avoid setups like this that don't line up with the bigger picture.

By checking the key levels on the higher time frame, we're going to avoid all this unnecessary risk.

Here's another example.

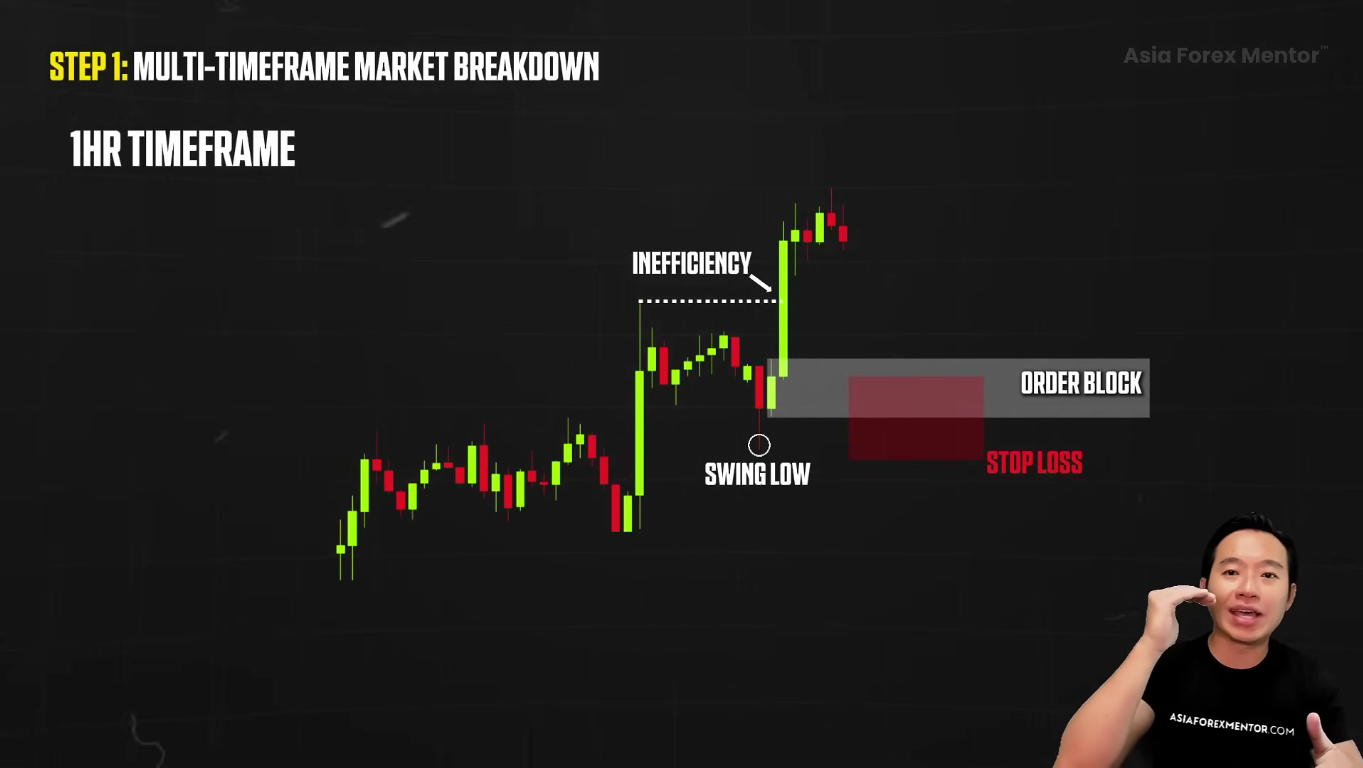
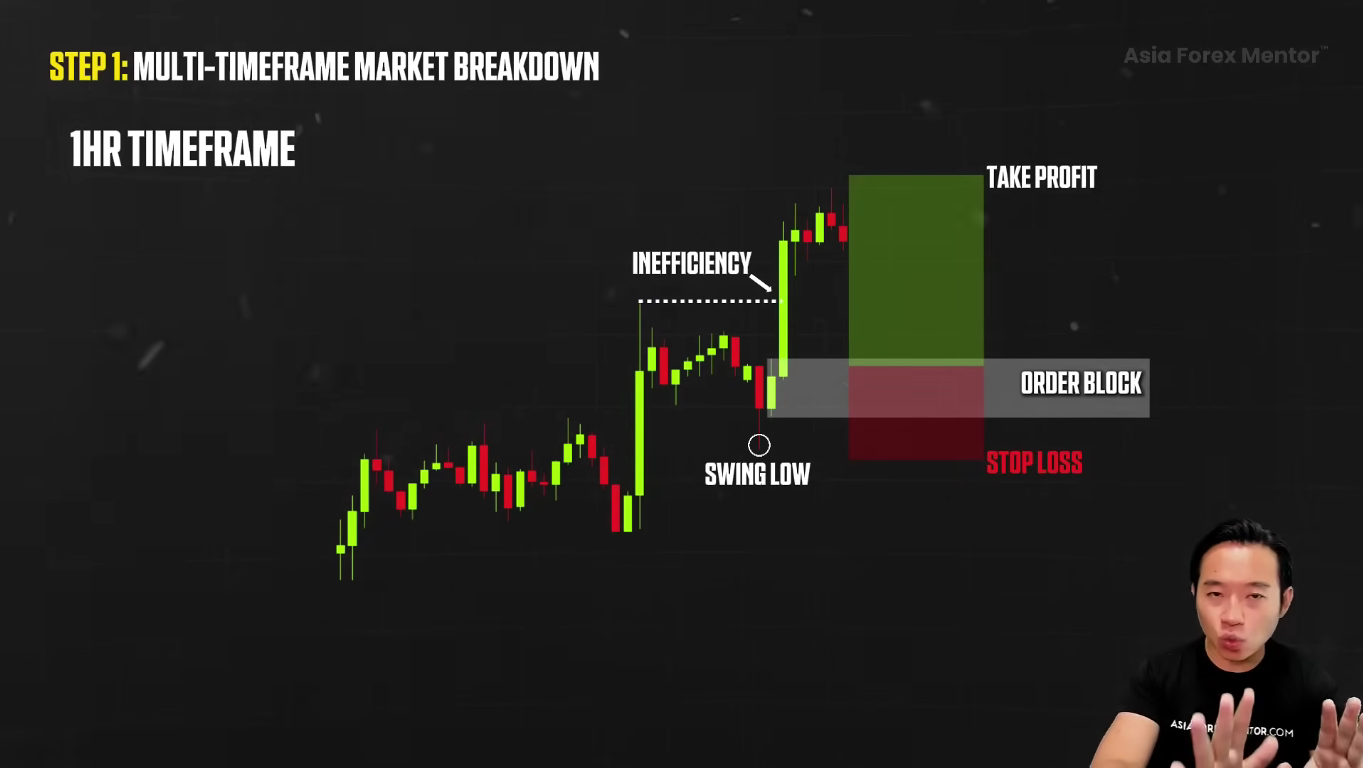
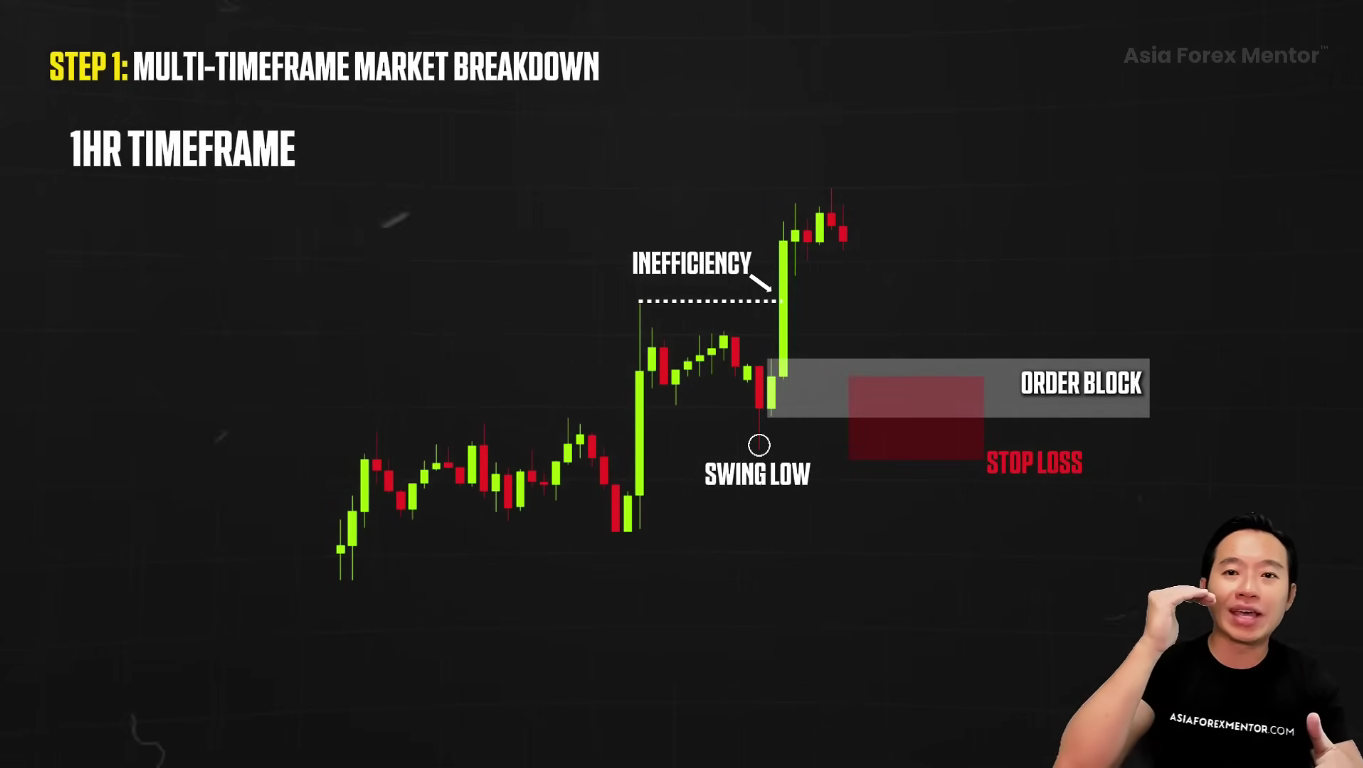
On the one hour chart, price broke above the previous market structure.
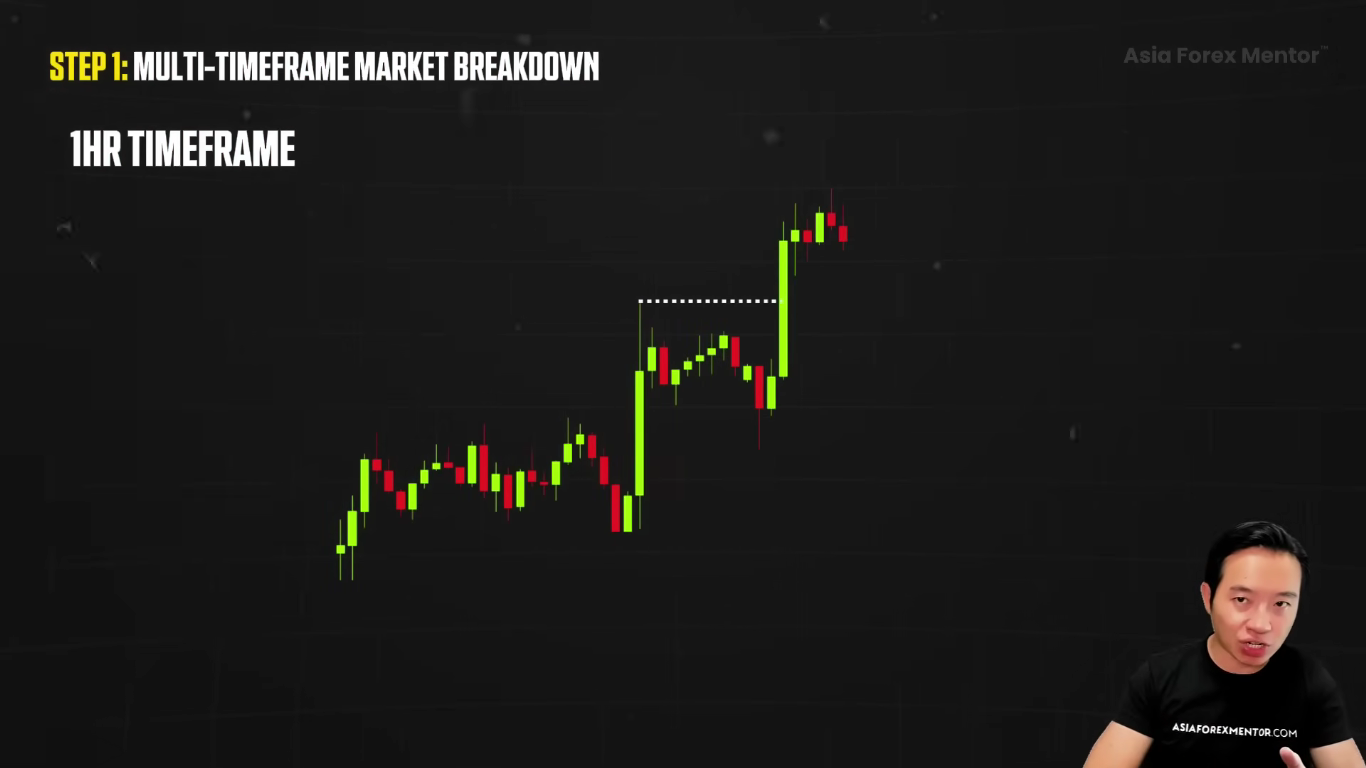
It created a move with some inefficiency.
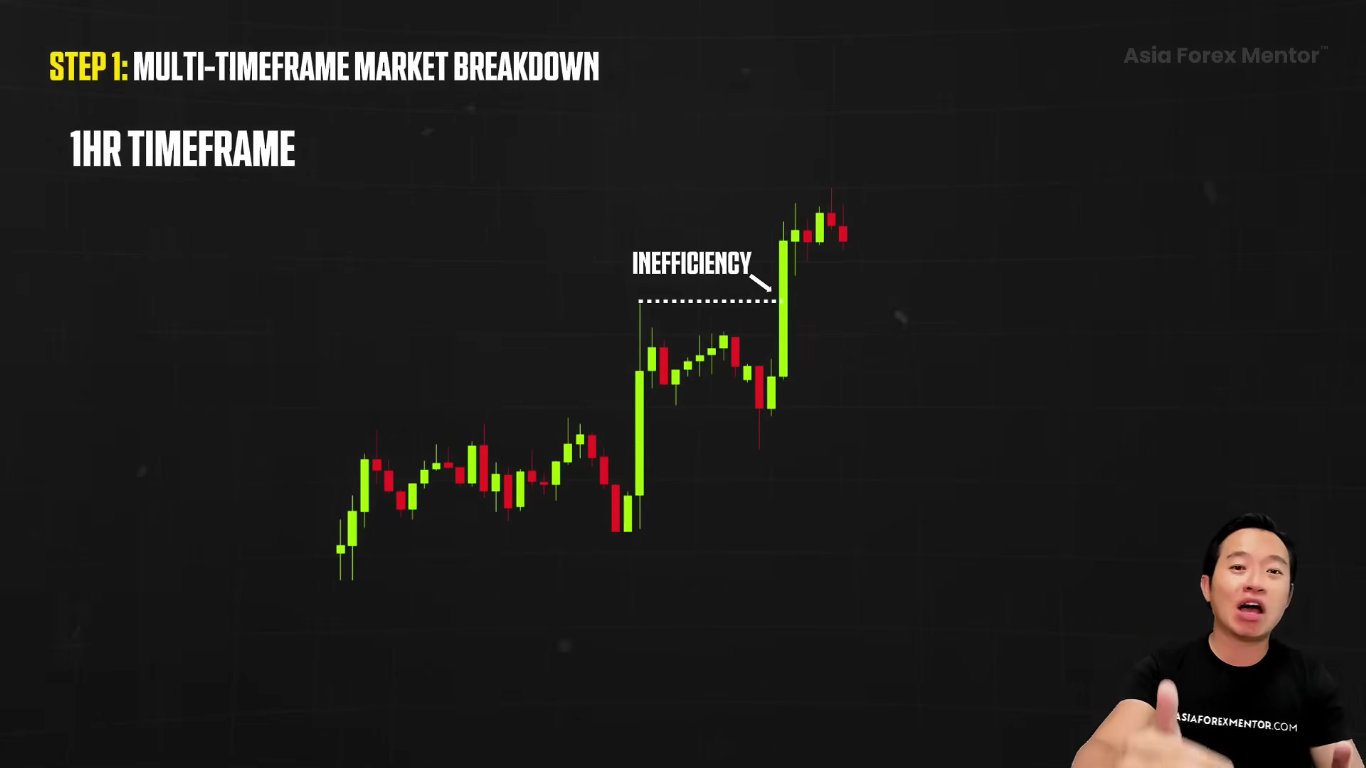
Price now pulls back to the order block zone. It sets up a perfect long opportunity.
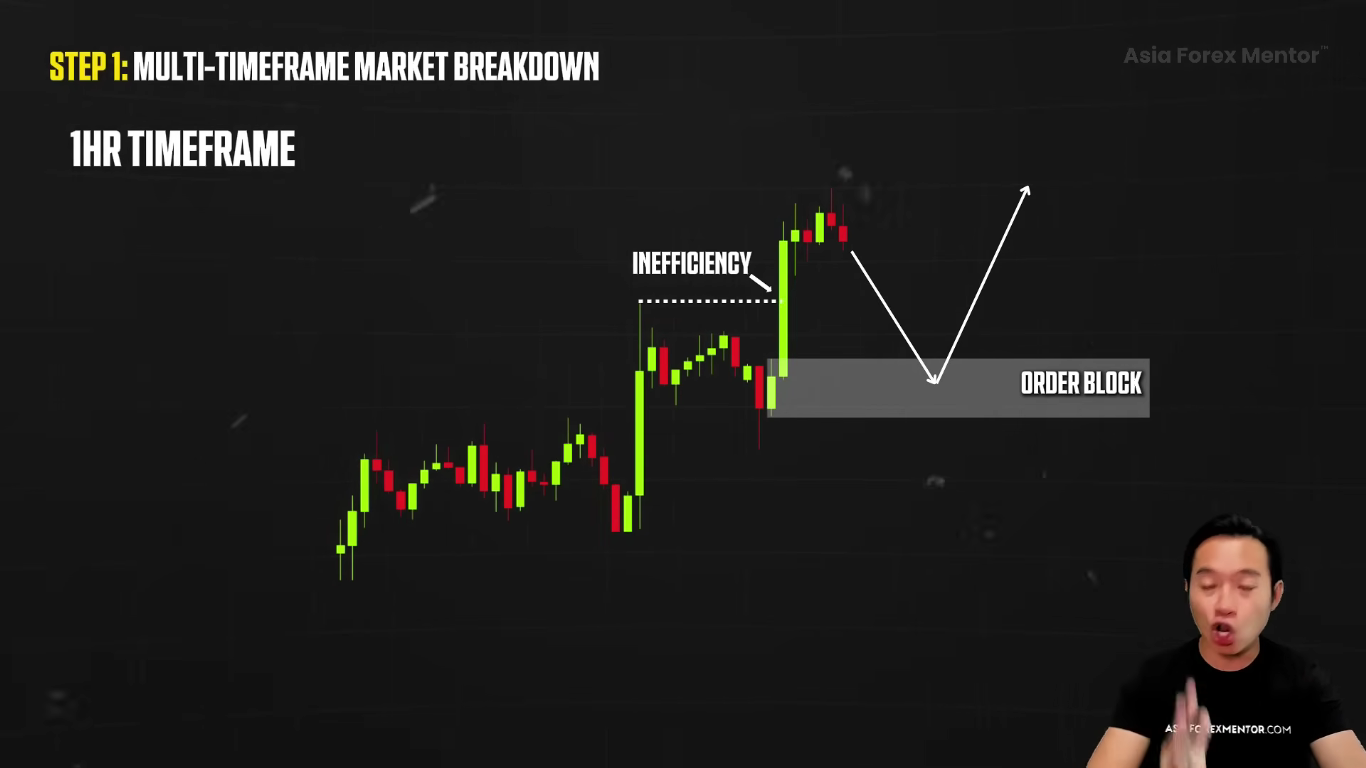
We can confidently place our stop loss below the swing low, and then we can target the next key level for our take profit.
But again, none of this would be possible if we didn't first analyze the market from the higher time frame perspective.
By analyzing multiple time frames, we can combine higher timeframe levels with lower timeframes to align short-term trades with the overall trend and create the best trading setup.

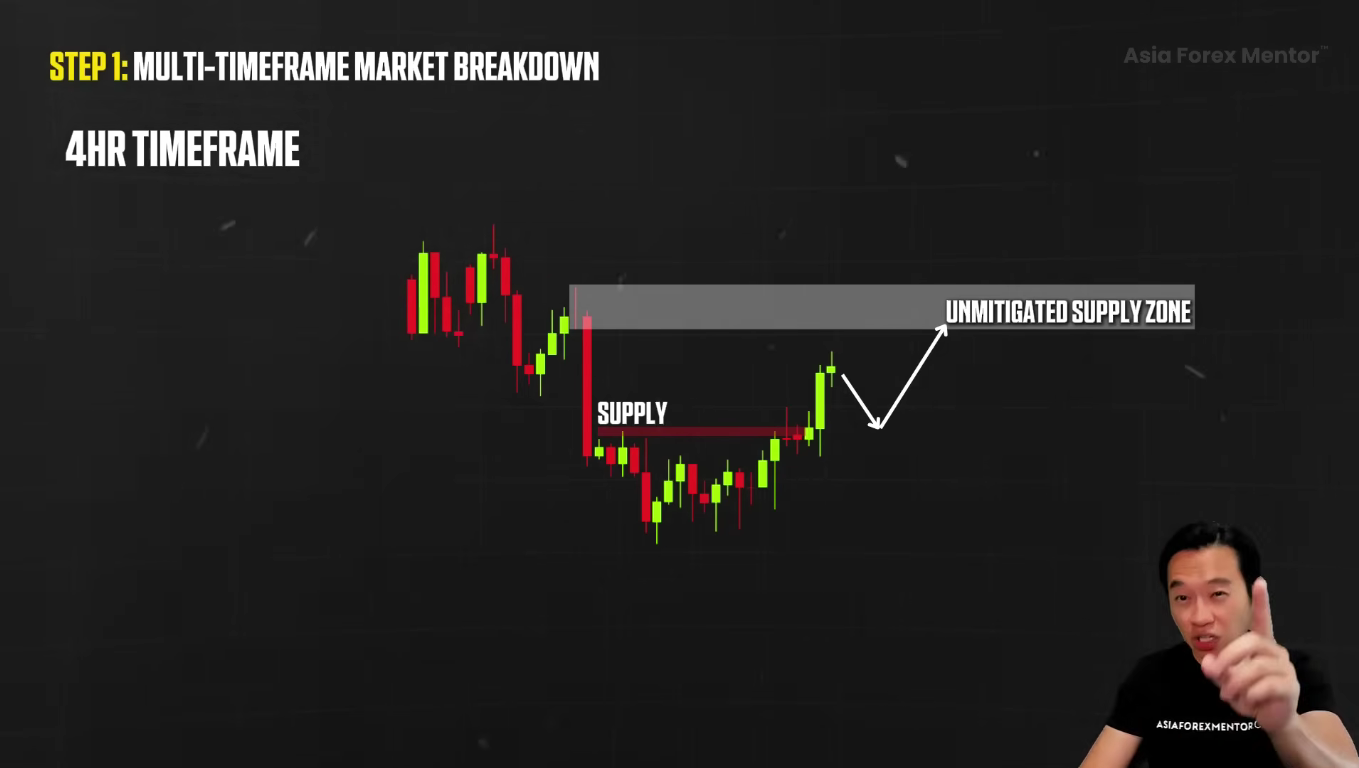
For example, on the four hour chart, we see that demand is in control,
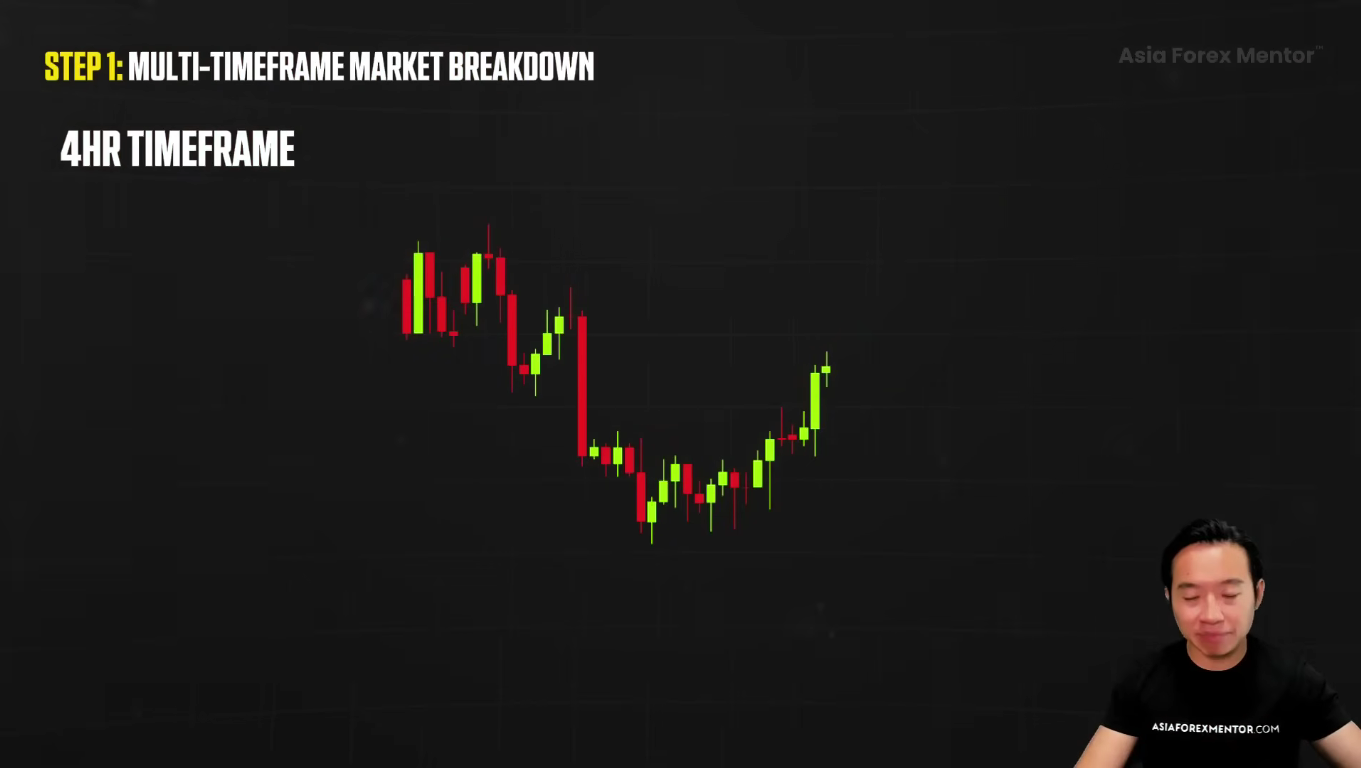
With price breaking above all the key supply areas. This gives us confidence to enter the trade, knowing that there’s enough room for price to move before reaching the next level. The next unmitigated supply zone.
However, cluttering multi-time-frame charts with too many indicators can obscure actual price action and make it difficult to identify market structure clearly.

This is a perfect example of how multiple time frame analysis can help us spot high quality setups with a good risk to reward ratio. Keep in mind that overtrading, especially on lower timeframes, can silently erode returns due to transaction costs, even for traders with a high win rate.
Now let’s dive into our entries and how we can optimize them.

Now that we have analyzed the multiple time frames, we can pinpoint the best potential entry points and exit points by using technical indicators and market structure.

For example, let’s say we are waiting for price to pull back to an order flow area. We are looking to open long positions to buy in line with the overall bullish momentum that we saw.
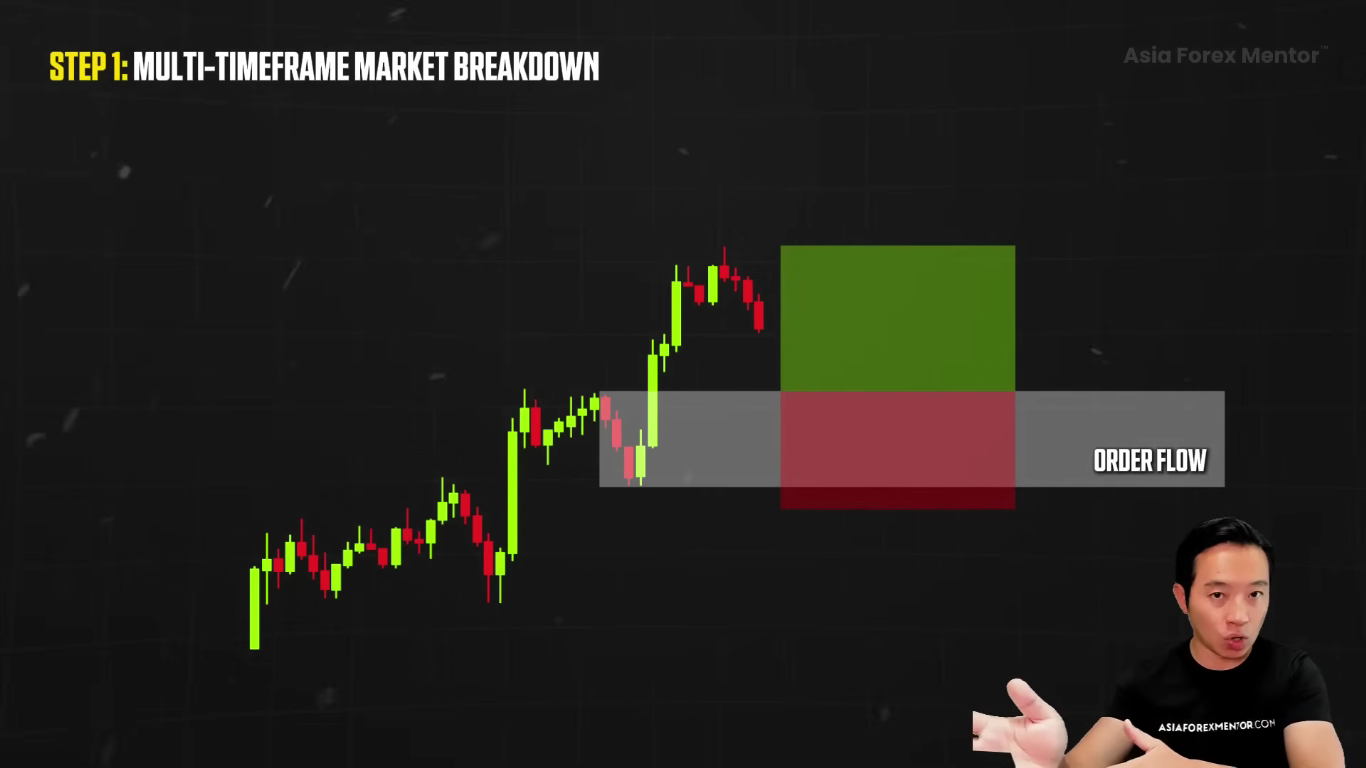
If we place our buy orders too early, our stop loss is going to end up being too far off.
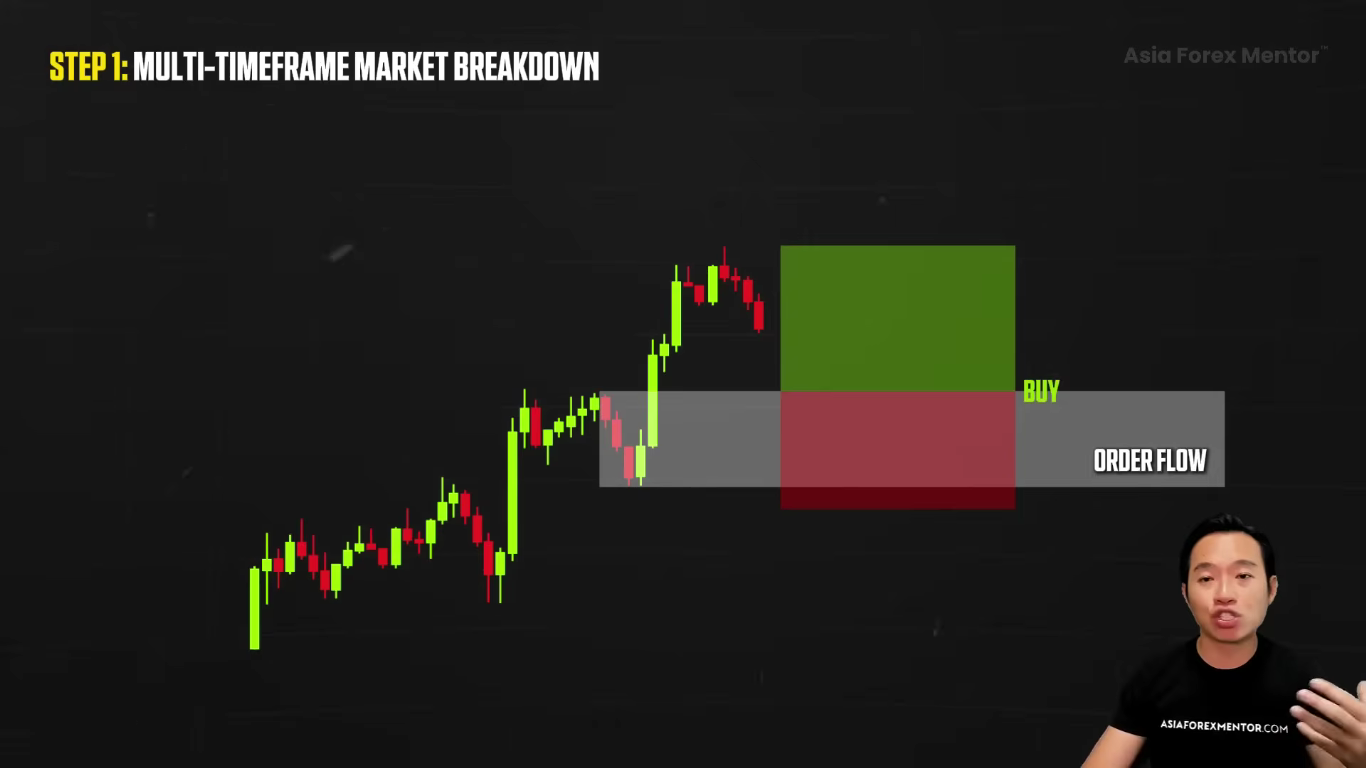
Too big. Too wide. Setting stop loss is a key part of risk management, helping to control potential losses if the trade goes against us.
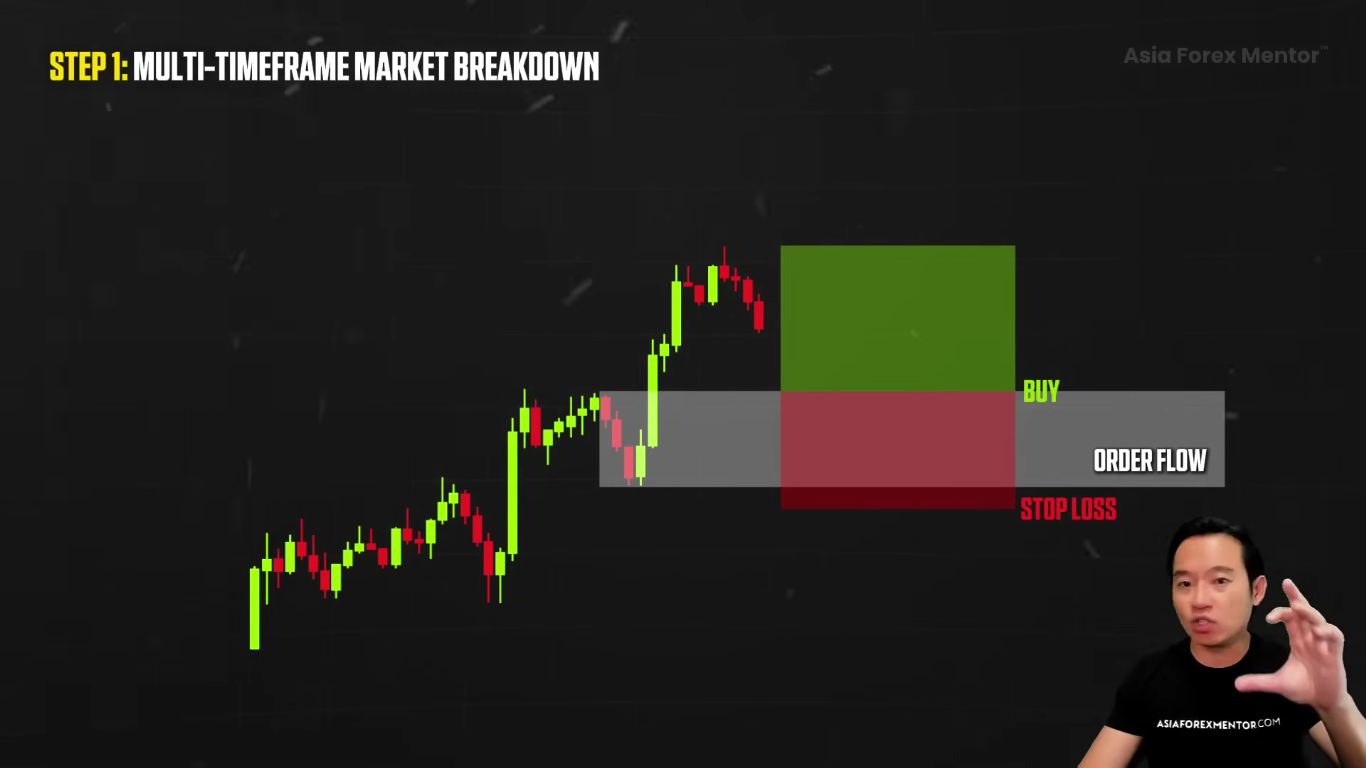
Instead, we want to focus on getting confirmation from the lower time frame. This way, we can enter trades at a more favorable pricing, using technical indicators to validate our entries and exits.
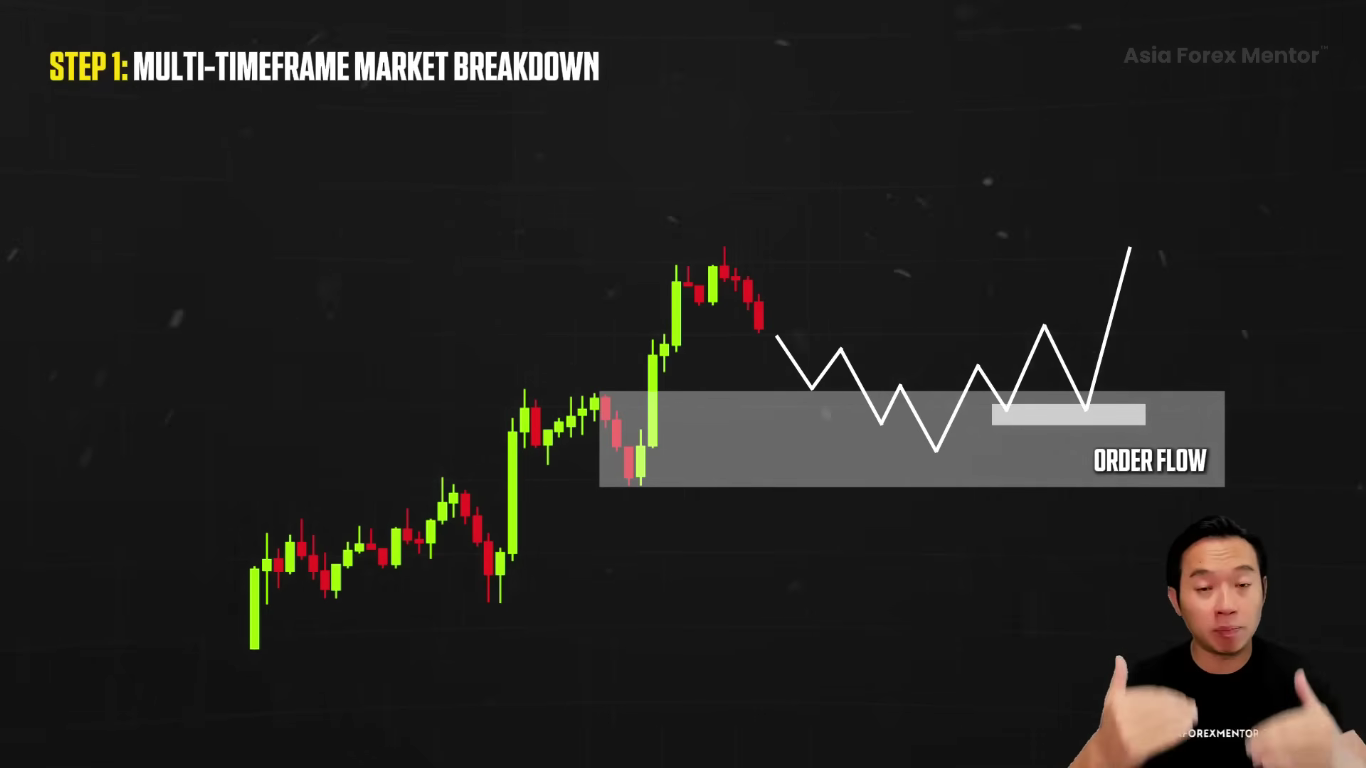
This lowers our chances of false signals and overall gives us confidence as a whole.
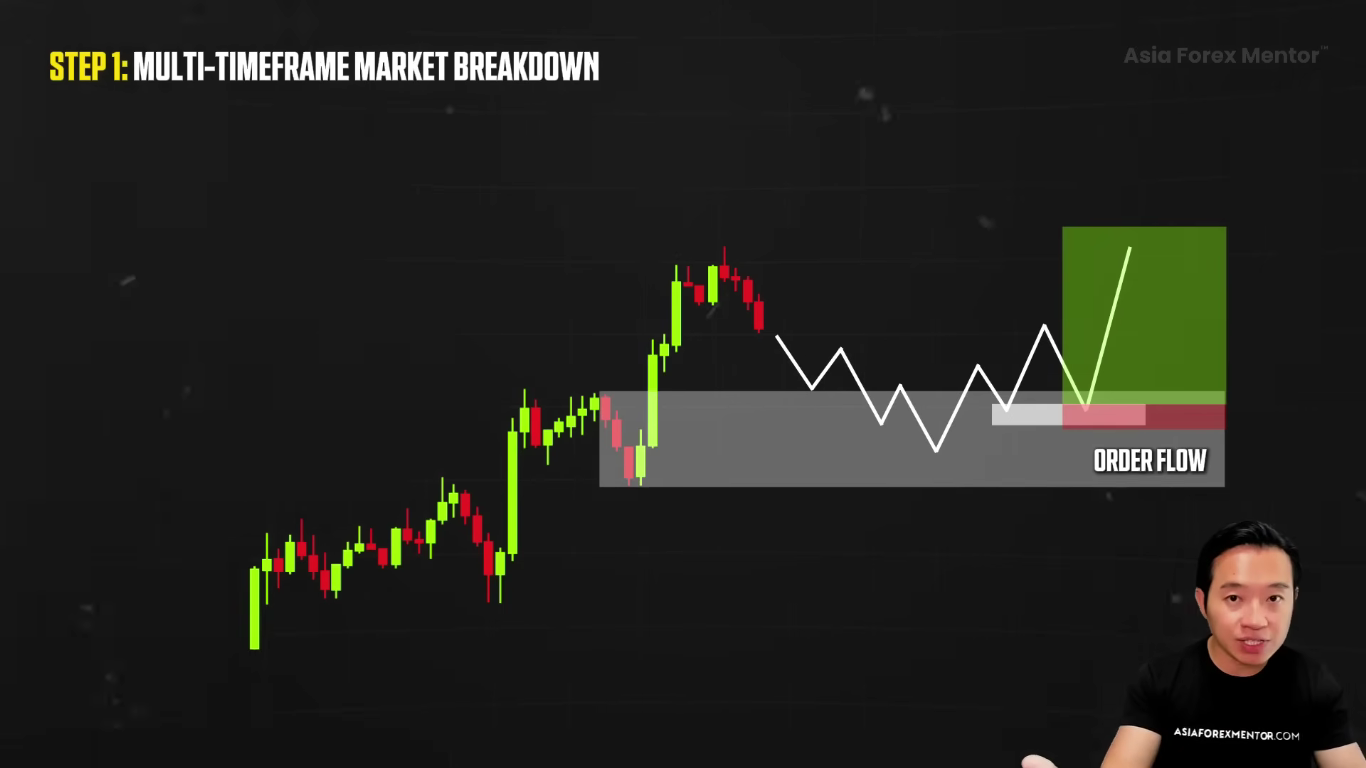
For example, entering precisely in the lower time frame at the lower time frame order block area.
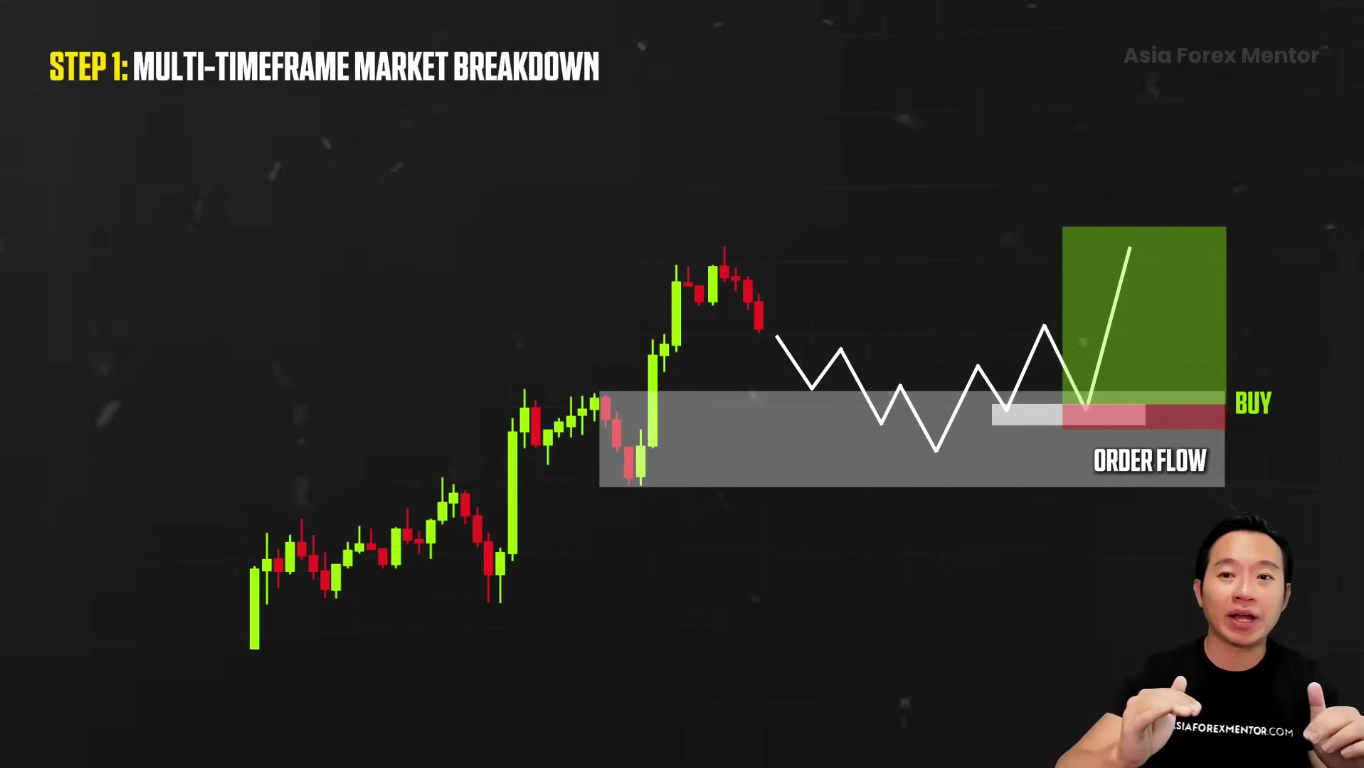
Or trading at the break of structure, the change of character in the lower time frame.
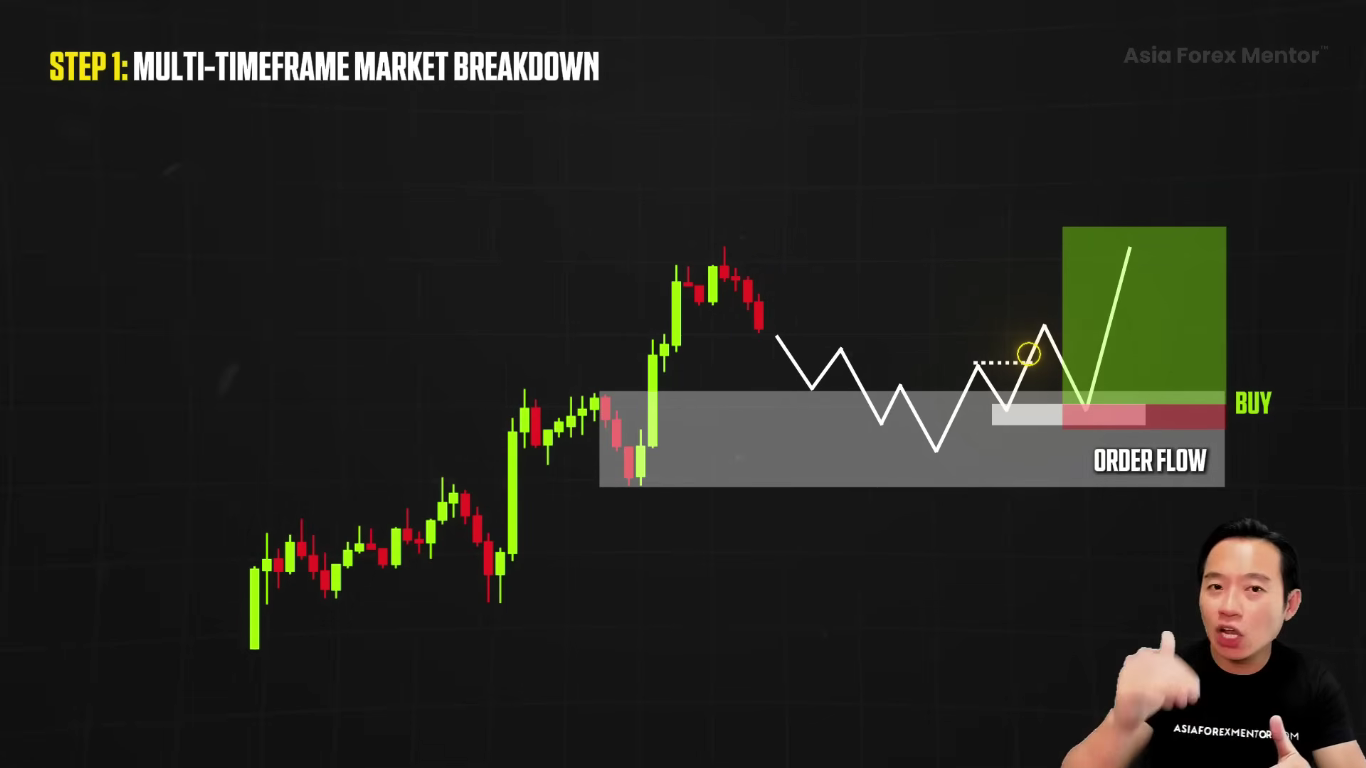
This tells us that the momentum has changed from a downtrend into an uptrend. And it is time to get in right there in the lower time frame itself.

This is precise entry.

By using multiple time frame analysis, we can now align our entries in the lower time frame with the broader time frame market trend.

This gives us way better risk to reward because our profit target is at the higher time frame level, our entry is precise where the market has actually moved and momentum has actually kicked off, and our stop loss is at the lower time frame area.
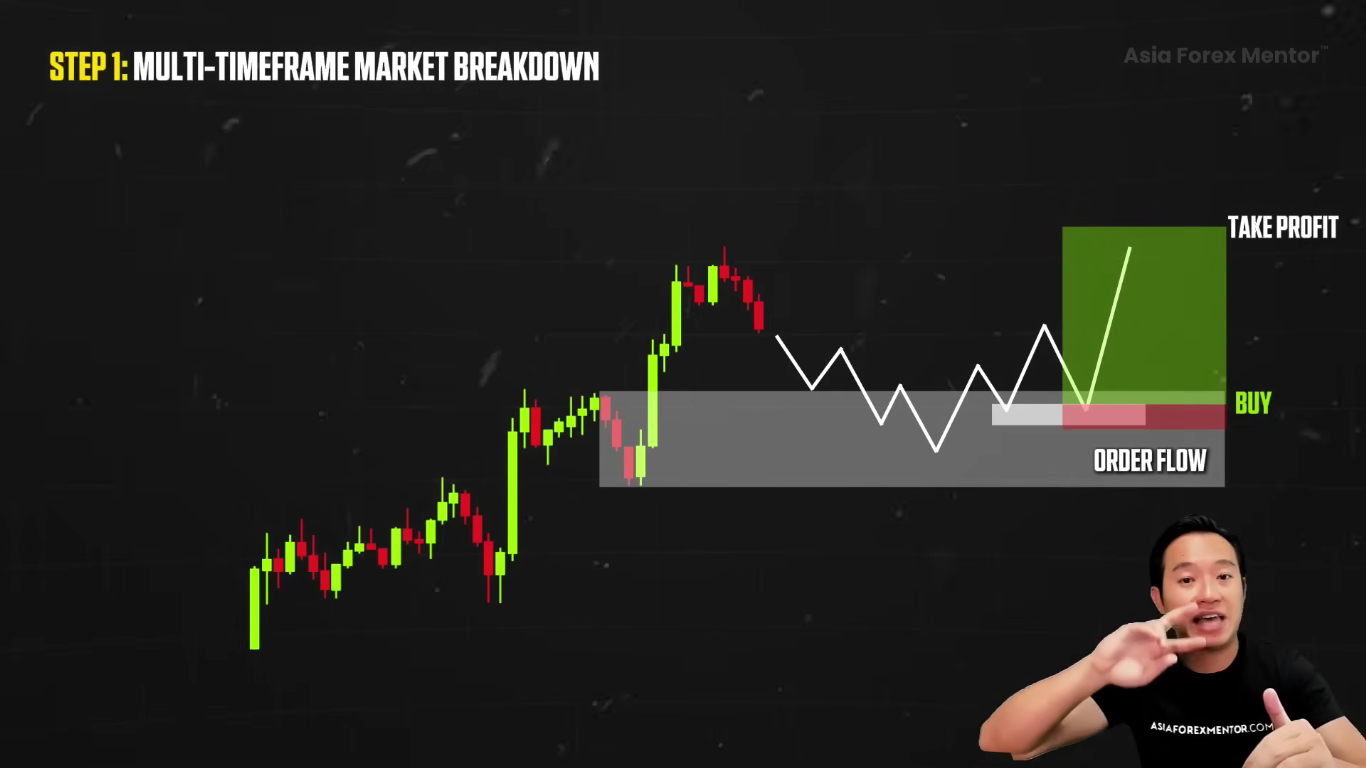
This gives us an insane risk to reward ratio.
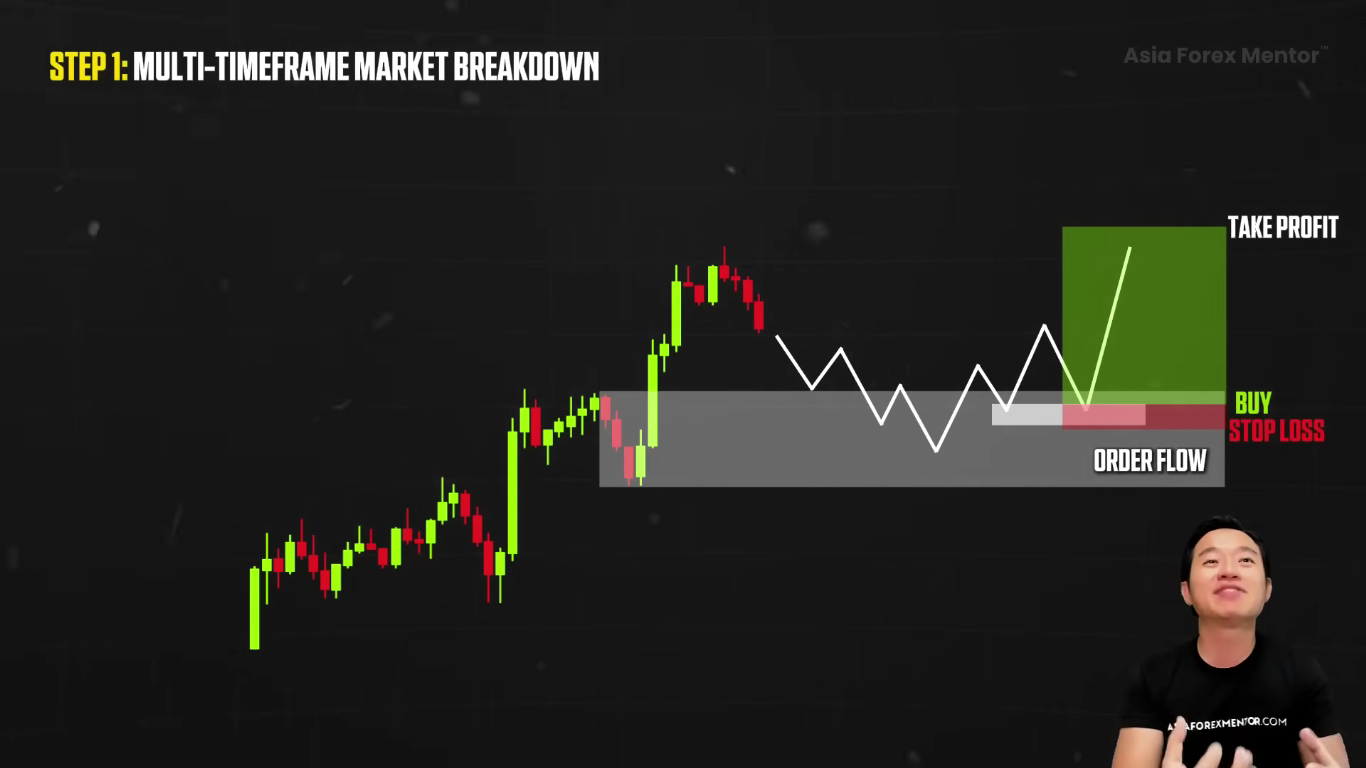
But let’s keep this in mind. This step alone will not guarantee success. Risk management is the foundation of trading, yet many traders focus more on producing profits than on how much capital they are risking on each trade. Effective risk management is crucial in forex trading, as it helps in setting appropriate stop-loss levels and take-profit targets based on market structure and trend analysis.

What is just as important is understanding where the institutional money is flowing. This is our next step.

The smart money concept comes into play. It helps us spot high probability setups by reading the market like a pro.

The market’s true direction lies in key levels. Following the smart money is going to show us where it is really going.

STEP 2: Smart Money Concepts

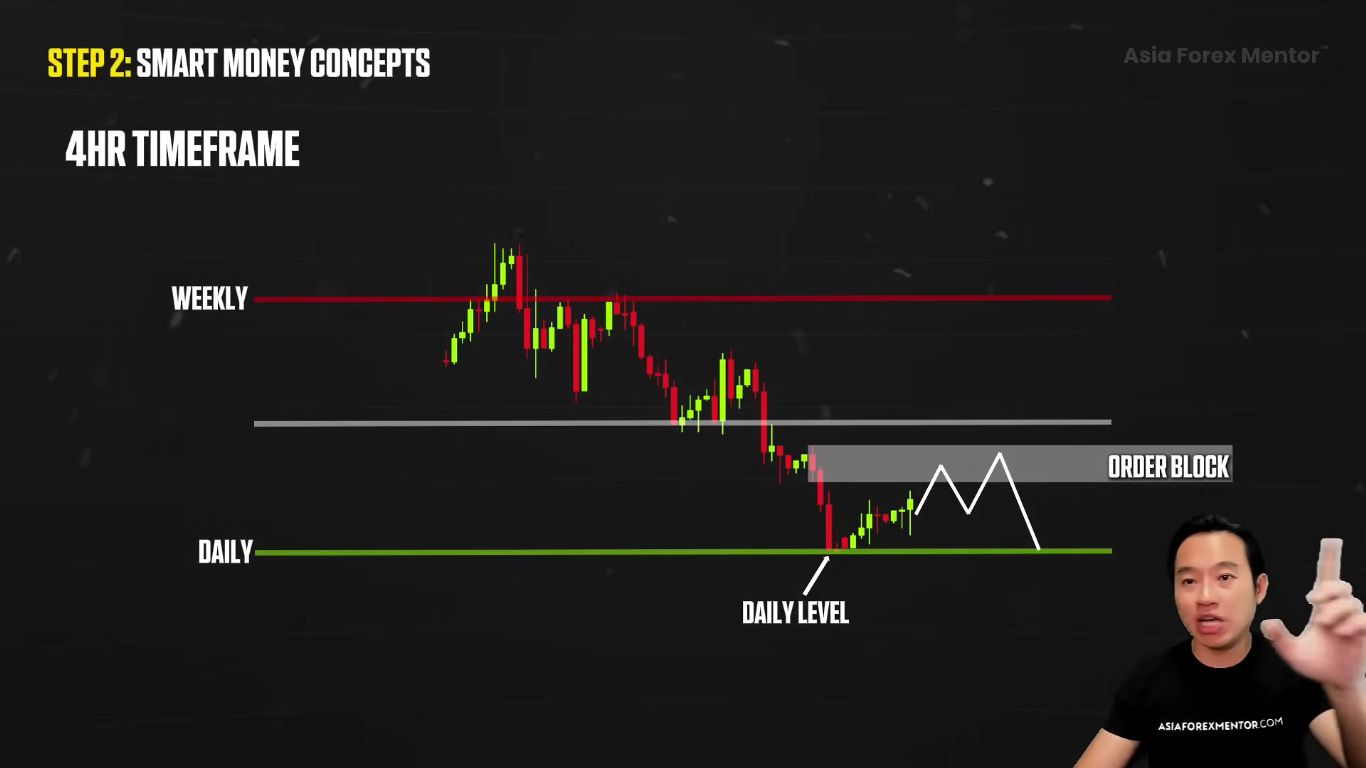
When we zoom in on the four hour chart, you can start to see it.

The weekly and daily levels are acting as key support and resistance levels identified on higher timeframes. These resistance levels and key support zones serve as crucial barriers where price often reacts, reverses, or pauses. It’s almost like the market has all these invisible lines that it keeps respecting.
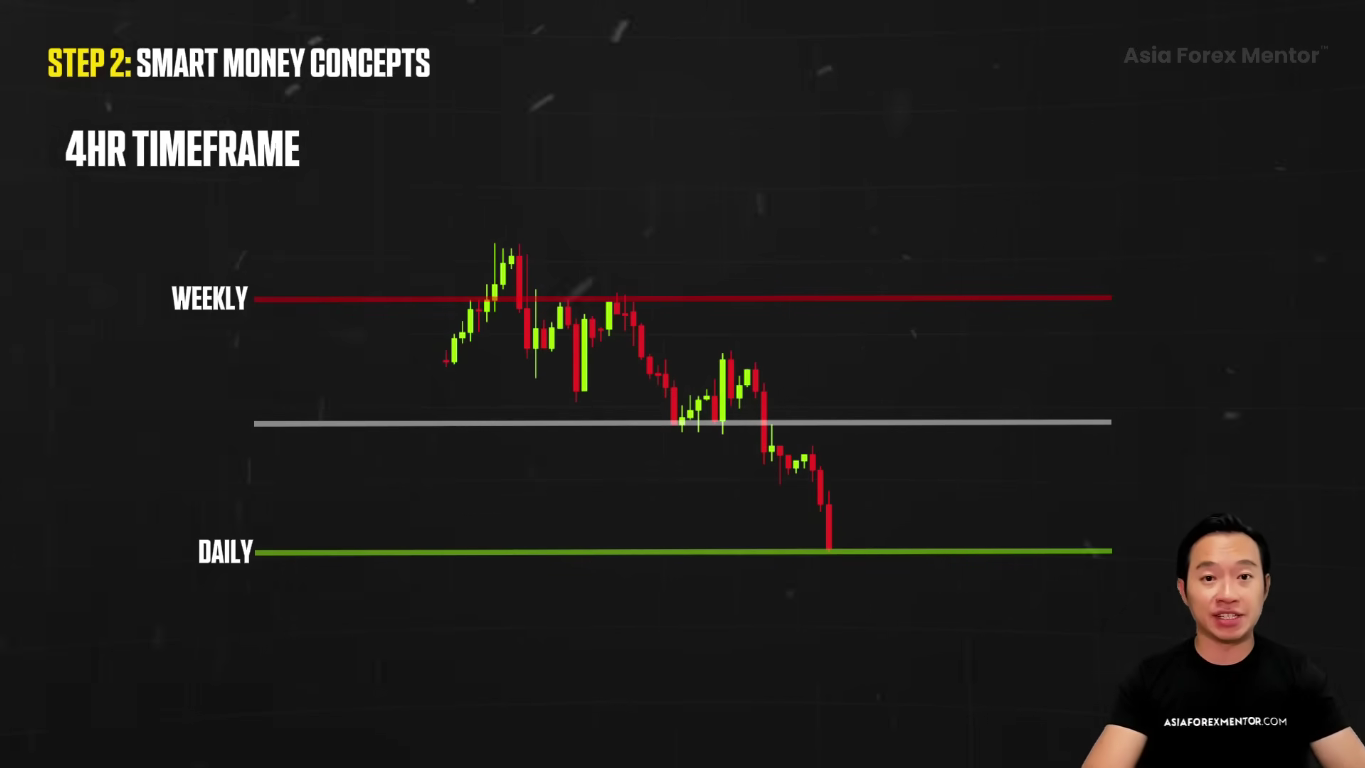
When we spot these support and resistance levels, it gives us a clearer view of where price might go next.

These levels are key because they show us where price might react, whether it is reversing at the area or breaking through the area.

How do we use these levels to our advantage? We’re going to tackle them in two main ways.

First, when price breaks above or below a key level, this gives us a clear signal about which side, demand or supply, is in control. This helps us get a sense of whether price will continue to push toward the next level.
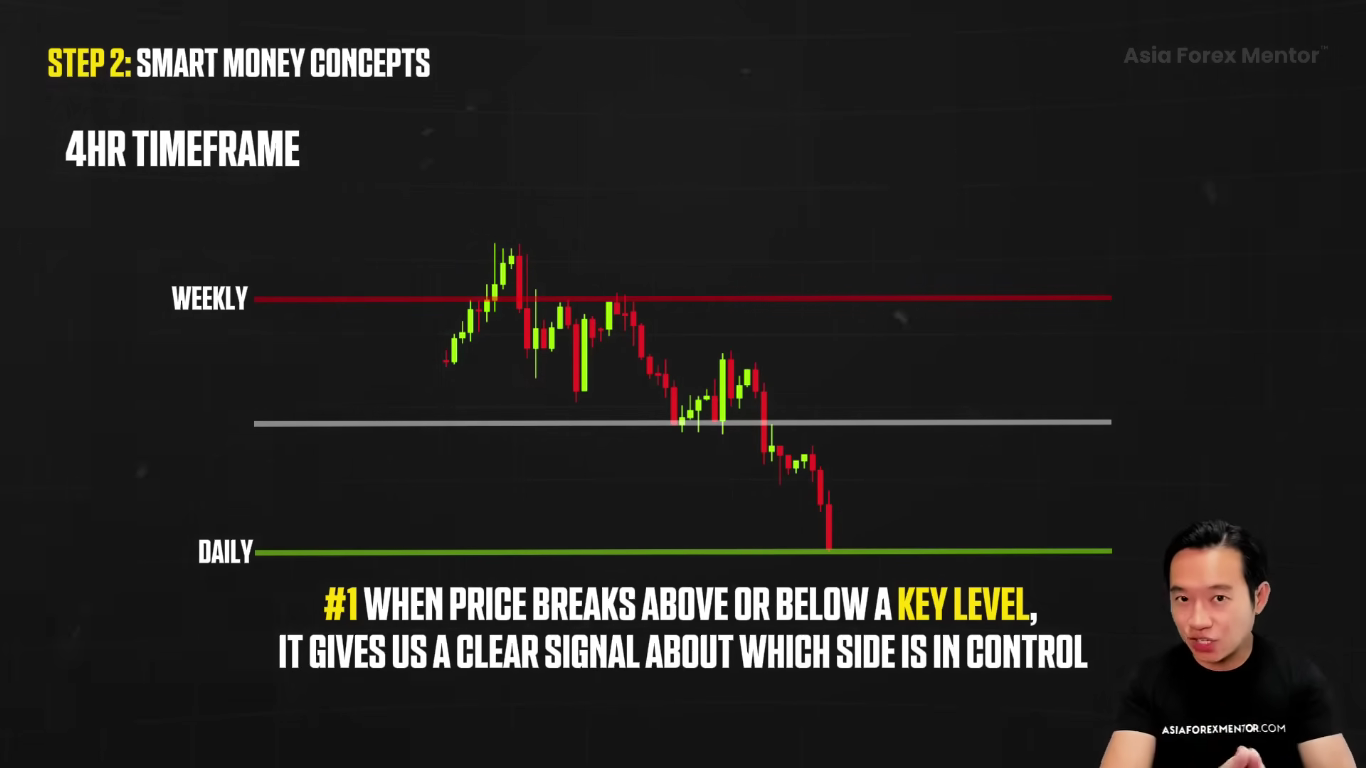
Second, we will use these support and resistance levels to set our stop loss and take profit targets. We plan our entries and our exits at these key levels.
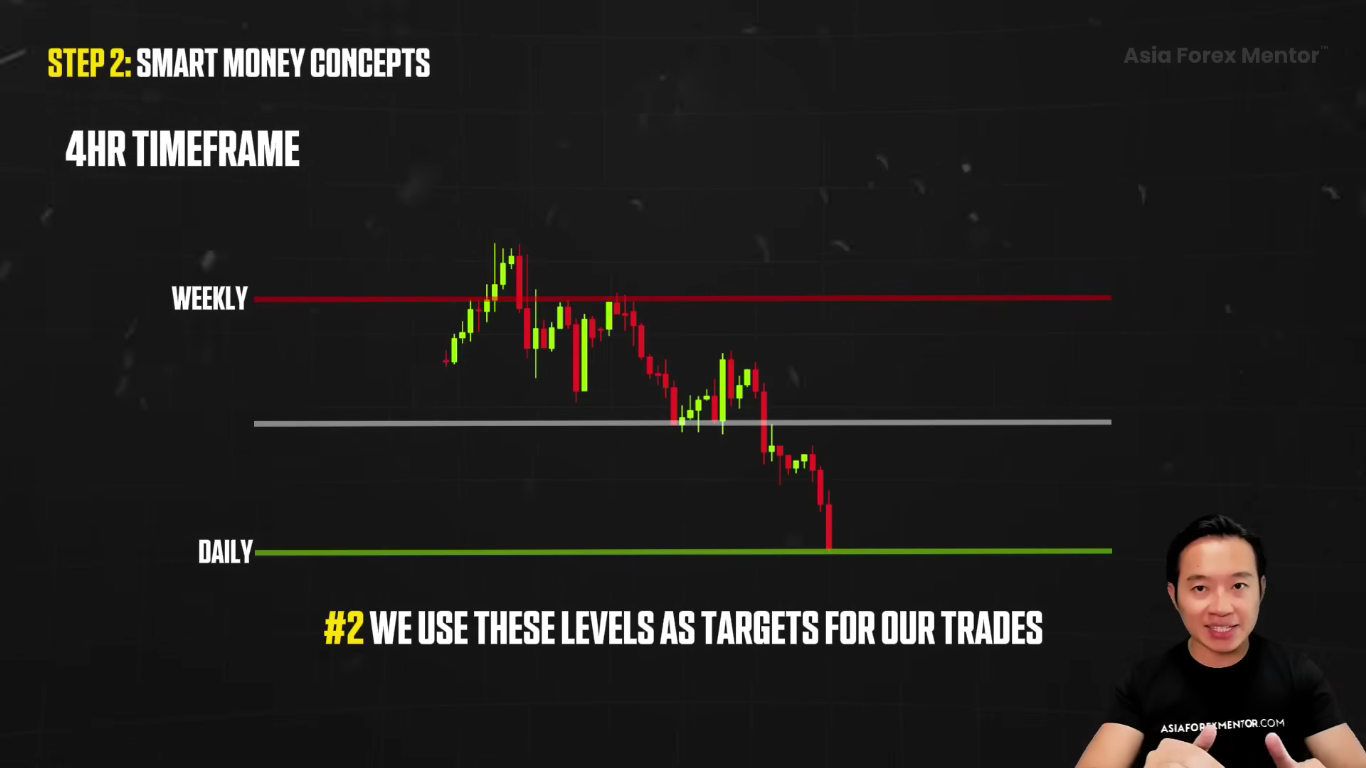
Now we are trading in line with the market structure.

This is where the smart money concept comes into play. We use this concept to get a grip of the market direction first.

We know the overall direction and the confirmation area and then all the potential trade opportunities.

When you see that the market is breaking below a key daily level and there is strong momentum, it’s a clear signal that the supply, the sellers, are in control.
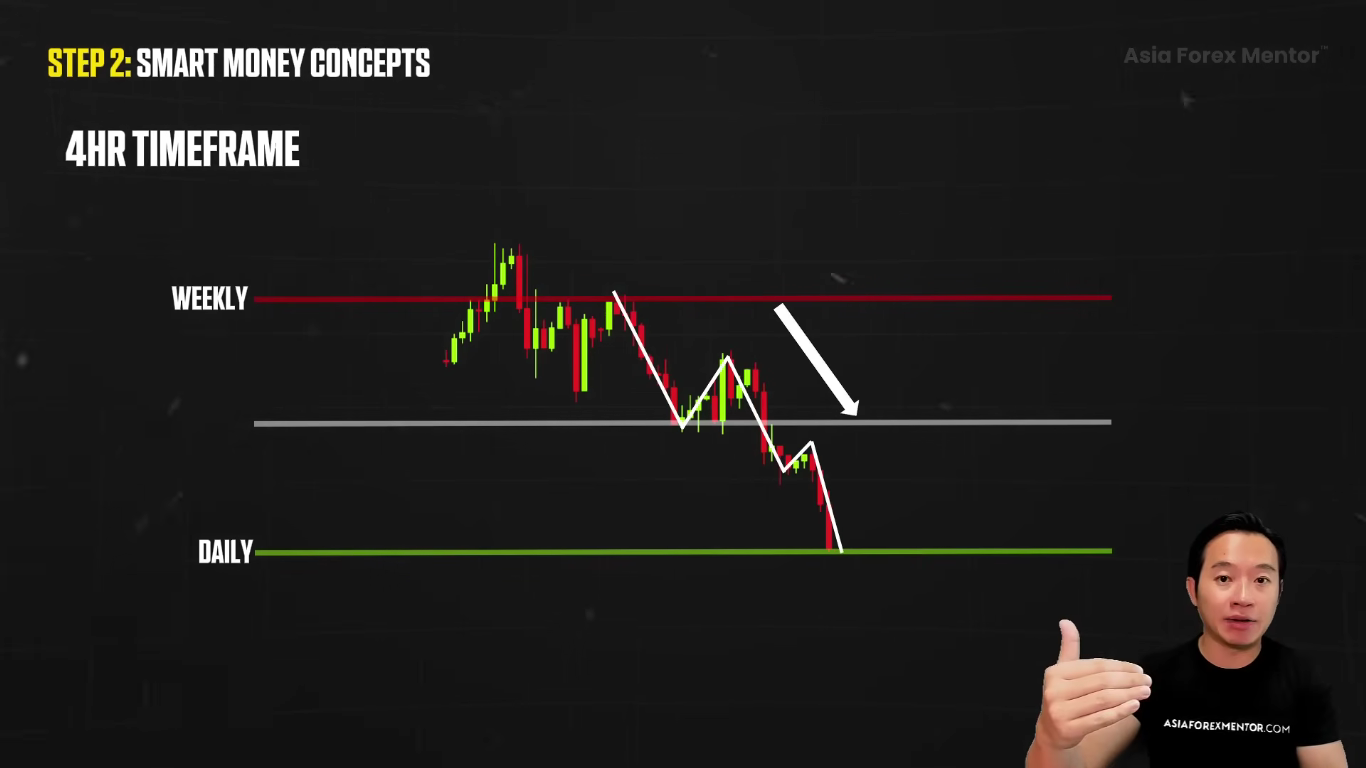
This gives us the green light to start looking for opportunities to sell.

When the market makes an inefficient move, this creates a fair value gap.
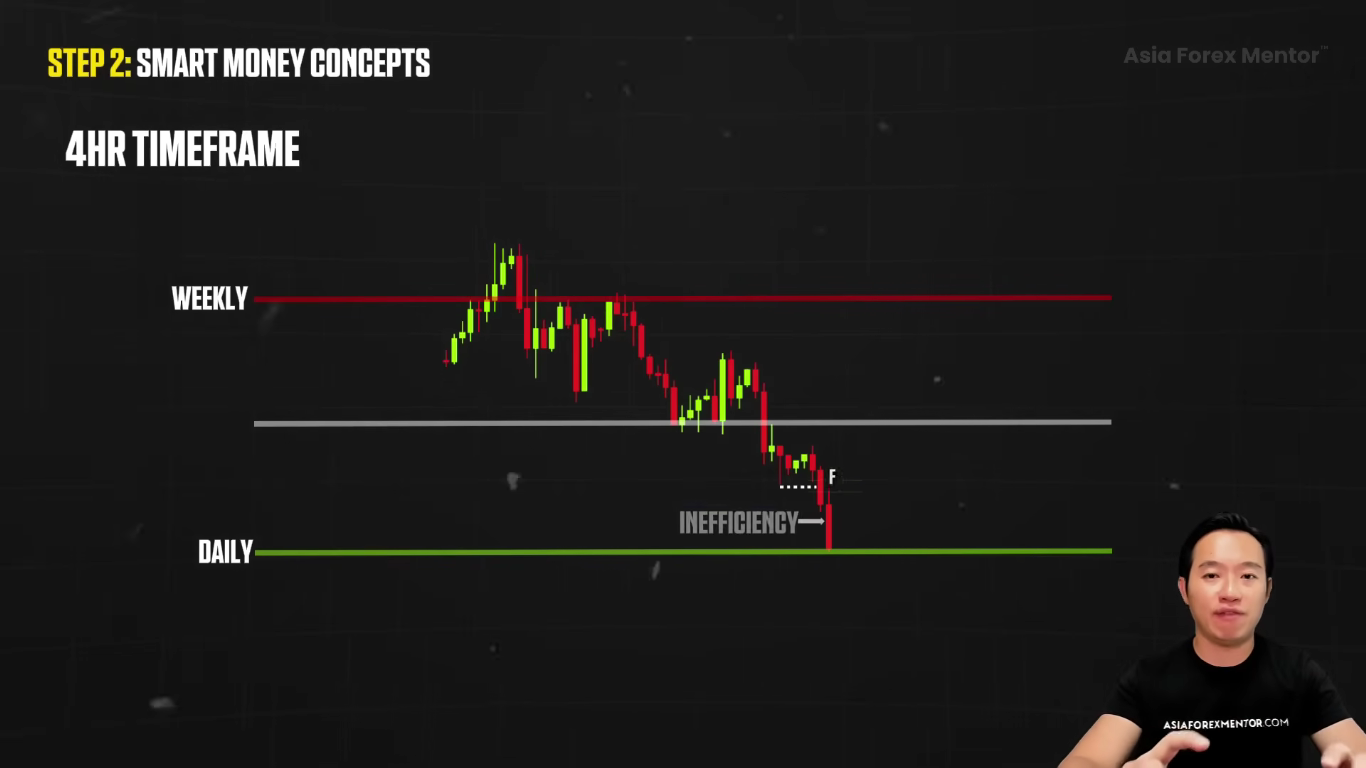
And then it follows with a break of structure.

This is where we pay attention.

Because the market is moving with purpose now. It’s not just random anymore.

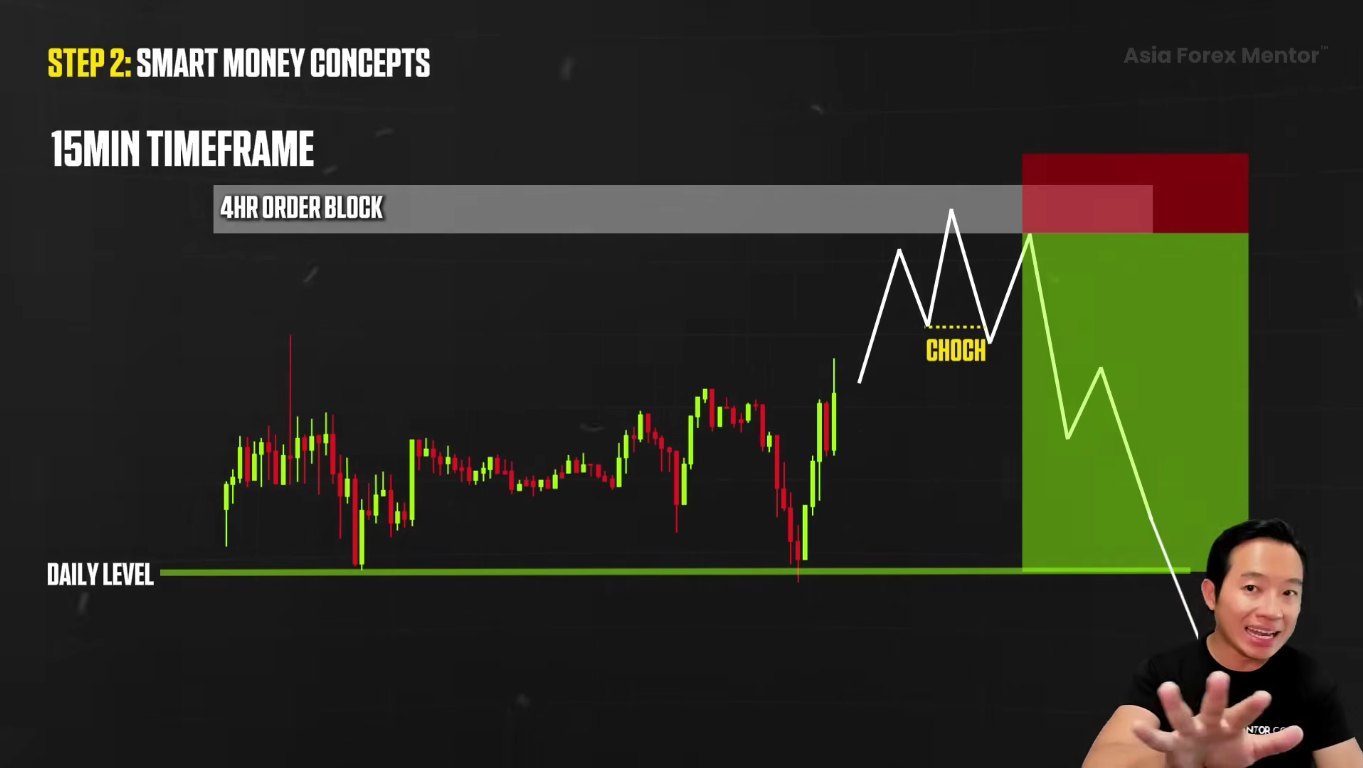
At this point, the candle that caused the inefficiency becomes our order block zone. This could set up a potential short entry.
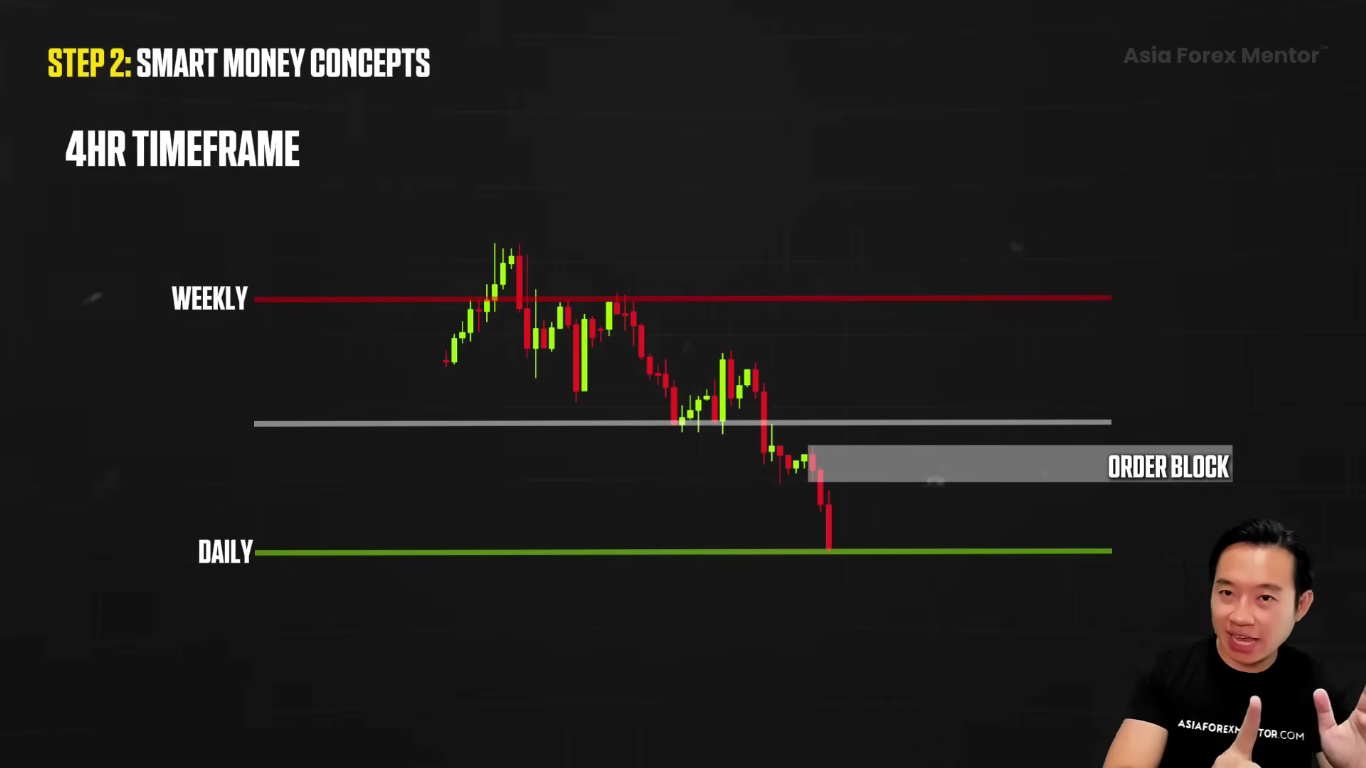
But we do not want to rush in. We do not want to place a sell order without any proper confirmation.

Because price has already reached a key daily level, which could be a turning point for a short term downtrend. Analyzing the daily chart is crucial here, as it helps us understand overall price movements and avoid being misled by short term fluctuations that can cause impulsive decisions. Waiting for confirmation helps traders avoid acting on emotions or reacting to temporary market noise.

This is why we need to be patient. We want to wait for bearish confirmation on the lower time frame, like the 15 minute chart, before we jump into any short positions.
Now on the other hand, if price breaks above the daily and the weekly levels, this indicates strong bullish momentum.
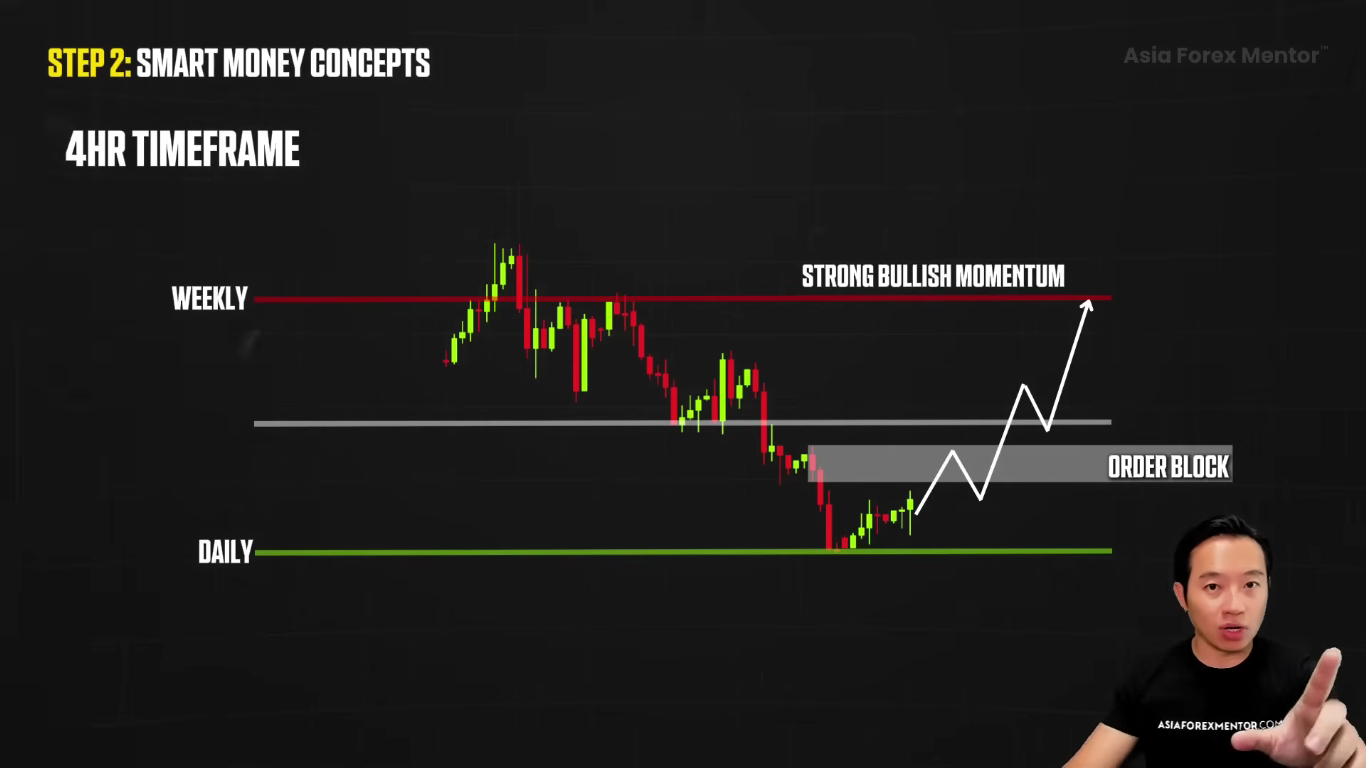
In that case, we expect price to push higher and test the next weekly level.

We will move on to the one hour chart. We are still going to apply the smart money concept here, which is especially relevant when trading currency pairs. In analysis in forex, it's crucial to examine both macroeconomic factors and technical patterns to inform trading decisions.
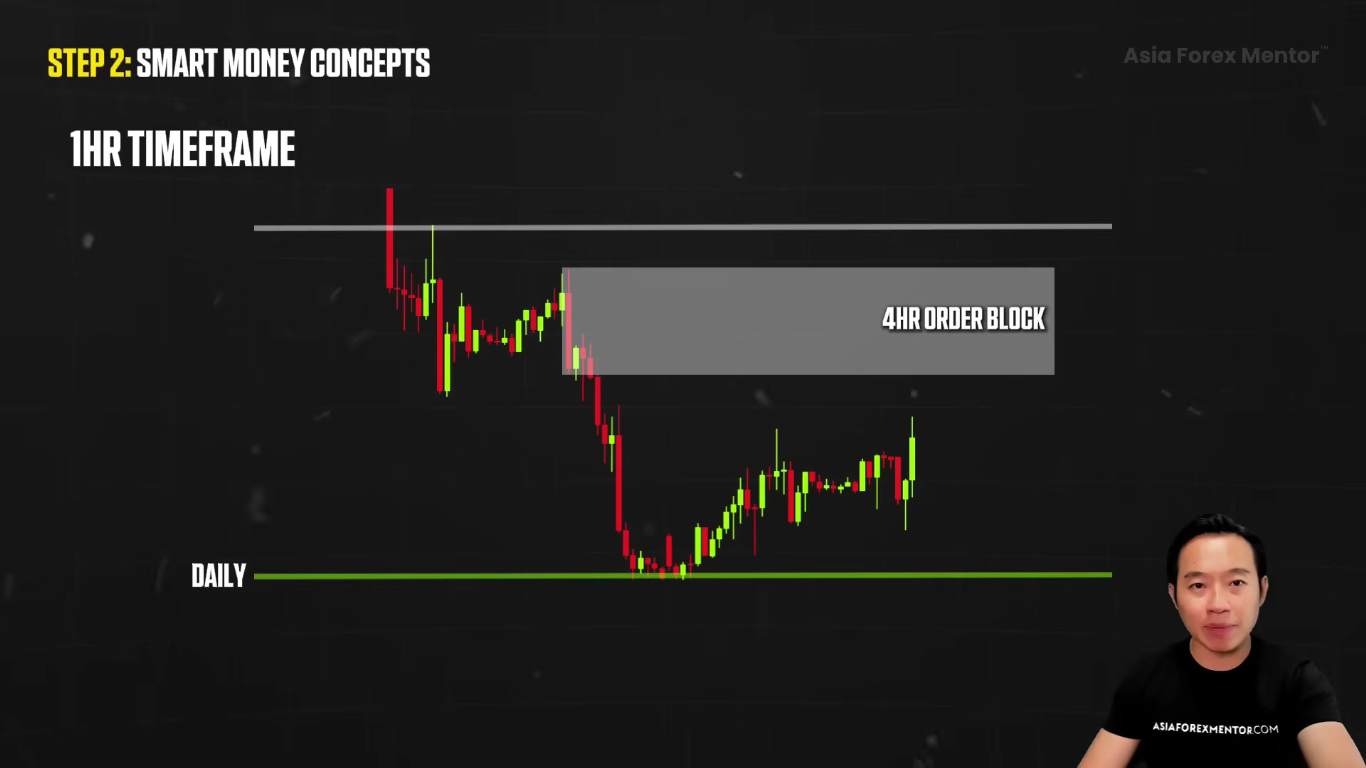
Here’s what happens, after price mitigates the daily zone, it forms a liquidity zone along the way.
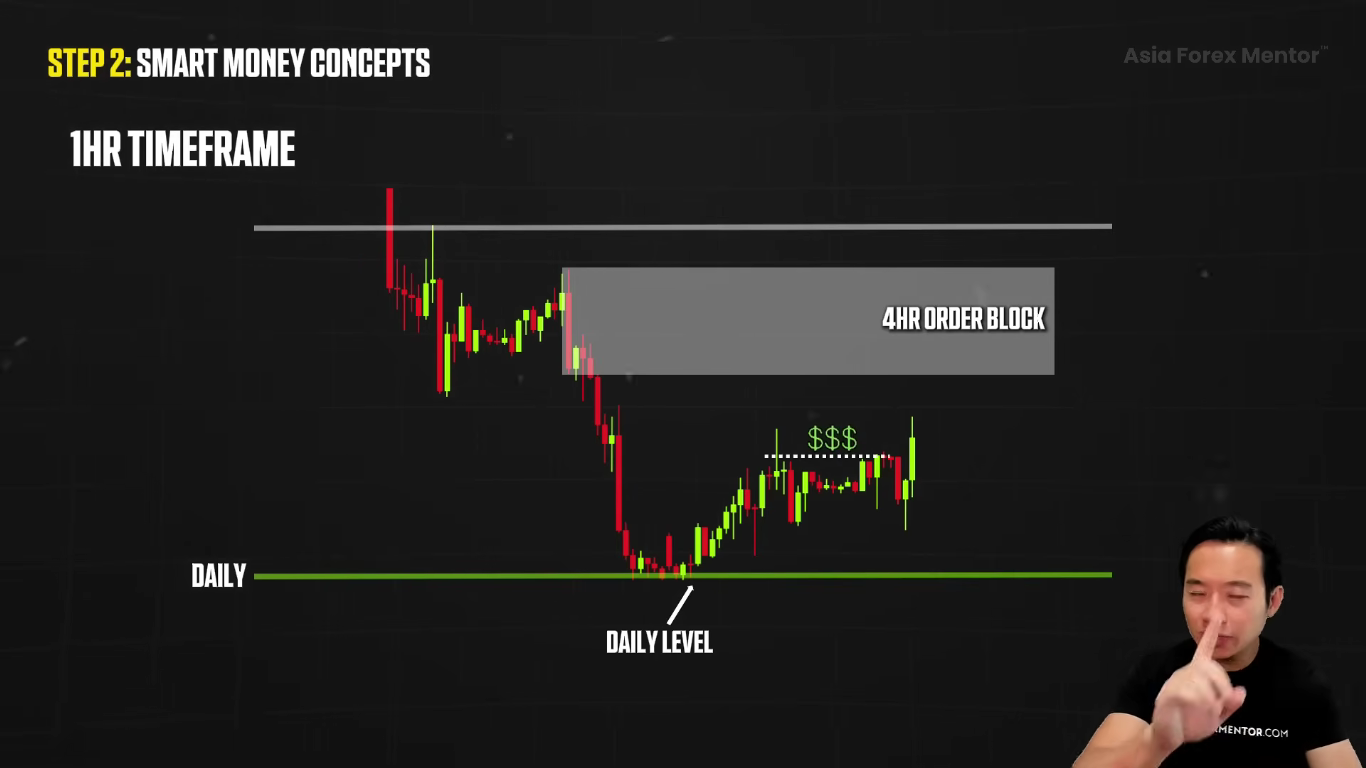
These liquidity zones are key because they indicate where the buyers and the sellers might have placed their stop losses or pending orders.

This gives us the clue of where price might be headed next.

Price is in a short term uptrend. But the best case would be for it to reverse with both the four hour and the one hour showing a bearish bias.
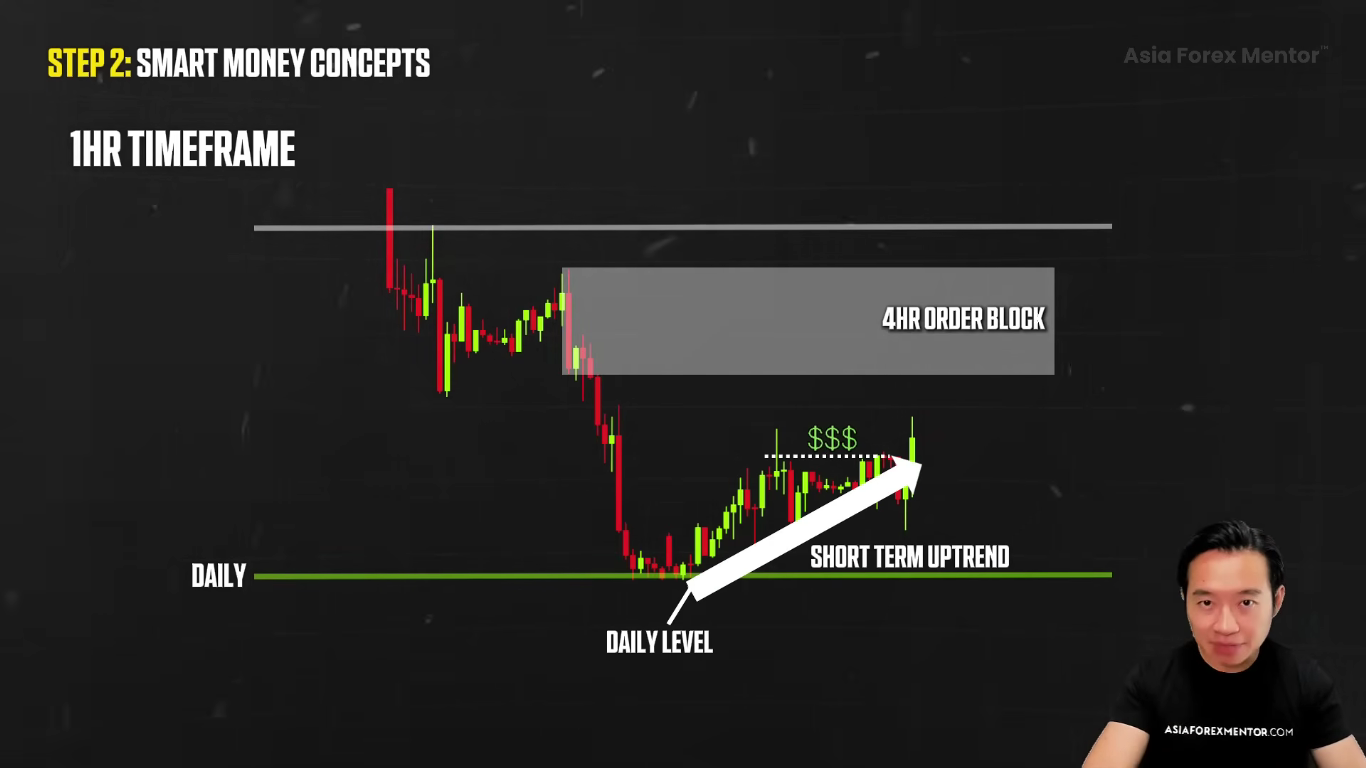
When both time frames match, we’re going to be a lot more confident in our trade.

Here’s an important step.

When we are looking at a four hour order block, we’re going to check for confirmation on the smaller time frame. We want to jump to the smaller time frame, like the 15 minute chart.

This is where we look for confirmation.

And if you are looking at a one hour order block, then you jump into the five minute chart for more precise entry points.

The 15 minute chart is the final step in this process.
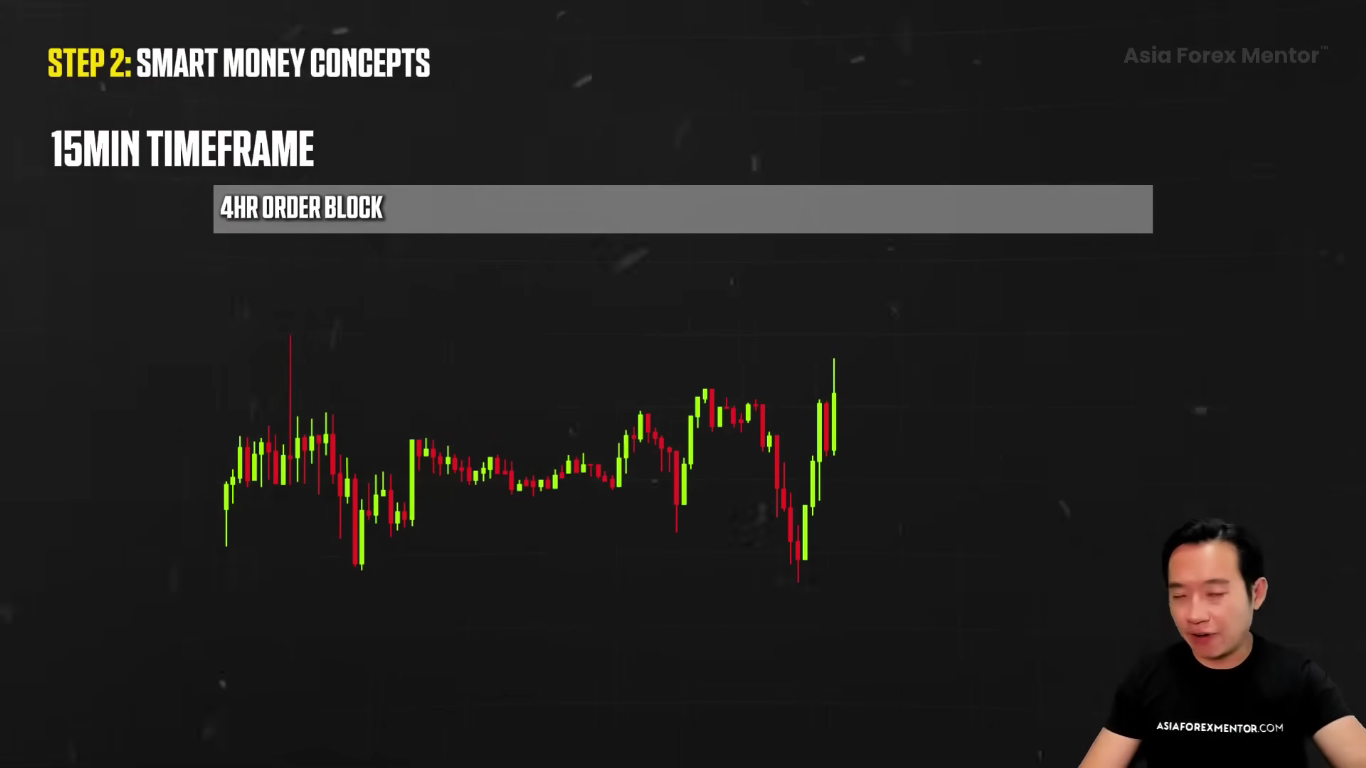
We don’t jump in blindly. Successful trading strategies involve a systematic approach with predefined rules for entries, exits, and risk management to avoid emotional decisions. Disciplined traders establish these rules before executing trades, helping them maintain consistency and discipline.

We wait for price to enter the order block zone that we have marked and then it shows a change in direction.
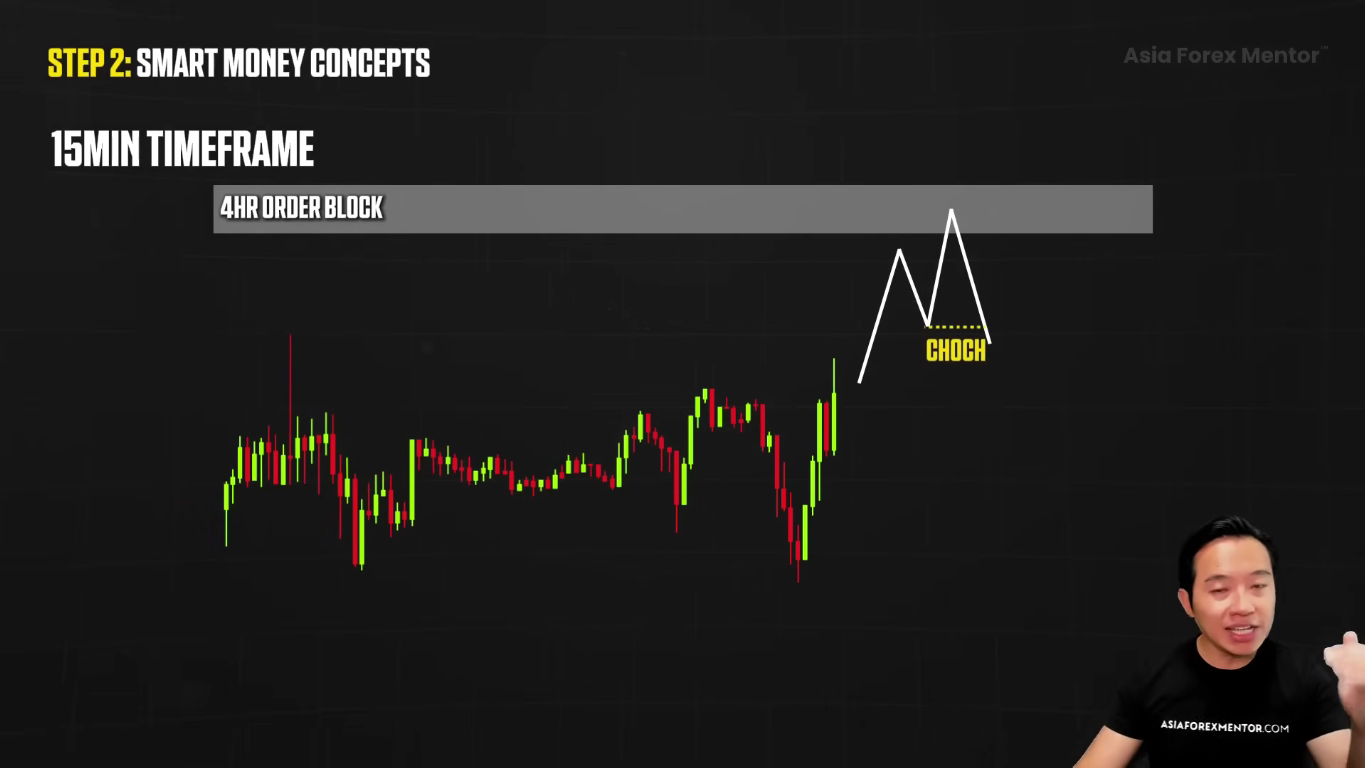
This confirms that the uptrend is ending and the market is likely to move down.

If you do not see a change in trend, you skip the trade.
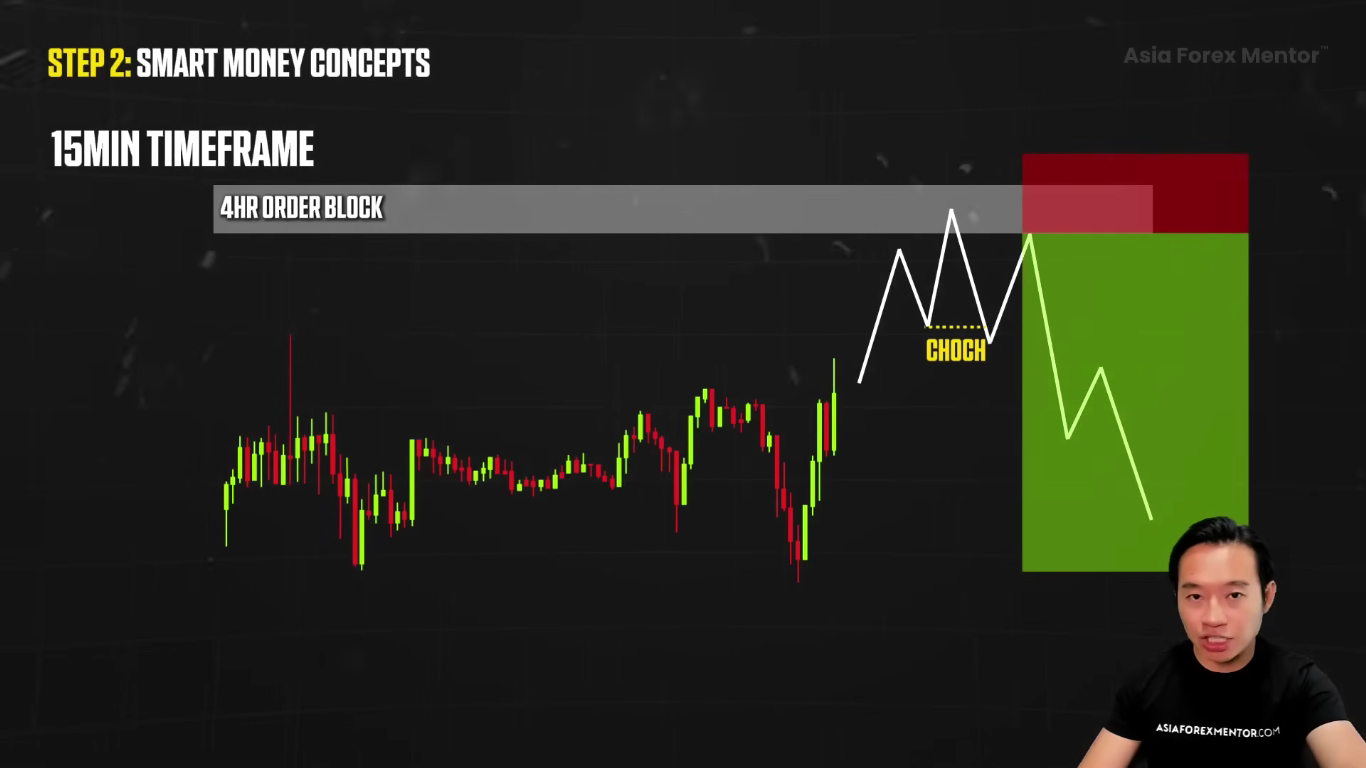
Now, our first target is on the daily level in front of the price itself. If price breaks the level, we would see price potentially moving towards the next weekly level.

The smart money concept pinpoints where all the institutional money is flowing. This gives us all the high probability setups.

By understanding all the key levels and then waiting for confirmation in the lower time frame, we’re going to ensure that our trades are aligned with the bigger market structure.
Conclusion

Top down analysis is not just about switching time frames. It’s about building alignment.

The higher time frame gives us the direction. The middle time frame gives us the structure. The lower time frame gives us the precision for entry.

When these three connect, the market stops feeling noisy.

We are no longer reacting to every five minute candle movement. We are now trading with a defined roadmap.

And then we layer the smart money concepts on top. We are not just trading the direction. We are now trading the intent in the market itself.

We know where all the liquidity sits. We know where the institutions are likely positioning themselves and where price is most likely going to react next.

This is the difference.

Most traders start at the bottom and get lost in the noise, all the lower time frame noise. But when you start from the top down, you’re trading with the actual context in the market. You’re trading with confirmation. And you trade with confidence.

This is how we as professionals stay aligned with the market instead of fighting against it. Successful traders think first about protecting capital and always consider worst-case scenarios before making trading decisions.

Once you build this habit into your process, your trading is going to feel calculated. It’s not going to feel random anymore.

What To Do Next

This is the same system I use myself and the same one that has helped thousands of traders move from frustration to consistency.

I’m giving it to you for free.

No fluff. No filler. Just pure strategy.

Click the link and I’ll see you inside the training.

👉 FREE 3 Step Training: The Setup I Use Before Every Trade

Frequently Asked Questions

What is top down analysis in trading

Top down analysis is a method that starts with the higher time frames to identify the overall market direction and key levels, then moves down to the lower time frames to find precise entry points. It helps traders avoid getting lost in lower time frame noise and trade in alignment with the bigger market structure. This approach is especially useful in the forex market, where understanding the bigger picture and macroeconomic factors is crucial for trading success.

Which time frames work best for top down analysis

The most effective combination starts with the weekly charts, which are essential for identifying long-term trends and key support and resistance levels. From there, use the daily or four hour chart for direction, the one hour chart for structure and key levels, and the 15 minute or five minute chart for precise entries and confirmation. This top-down approach can also be applied to futures contracts, where analyzing higher timeframes helps manage risk and timing. This gives a clear roadmap from the big picture down to execution.

How does top down analysis improve risk to reward

Top down analysis places profit targets at higher time frame levels where price has more room to run. It places stop losses at lower time frame areas where entries are precise. This combination creates significantly better risk to reward ratios compared to trading a single time frame. Additionally, optimizing your risk to reward also requires careful management of your account size and factoring in the costs of borrowed capital, such as margin interest, to ensure that trading decisions remain profitable and sustainable.

What role do smart money concepts play in top down analysis

Smart money concepts help traders identify where institutional money is flowing by reading key levels, fair value gaps, order blocks, and breaks of structure. In top down analysis, traders also consider central bank policies and interest rates as key macroeconomic factors, since these influence currency movements and overall market trends. Layering smart money on top of multi time frame analysis turns a directional trade into one backed by institutional intent and confirmation.

What happens if there is no confirmation on the lower time frame

The trade gets skipped. No confirmation means no entry. Waiting for a clear change of character or break of structure on the lower time frame protects traders from false signals and keeps every trade aligned with the higher time frame direction. Waiting for confirmation before you start trading also helps protect your profits by reducing the risk of premature entries. Remember, past performance does not guarantee future results; disciplined execution and risk management are essential for long-term trading success.


About Ezekiel Chew​

Ezekiel Chew, founder and head of training at Asia Forex Mentor, is a renowned forex expert, frequently invited to speak at major industry events. Known for his deep market insights, Ezekiel is one of the top traders committed to supporting the trading community. Making six figures per trade, he also trains traders working in banks, fund management, and prop trading firms.

Is Forex Trading Profitable for Most Traders

Is forex trading profitable? The honest answer is yes, but not in the way most people entering the market expect it to be. Forex trading is profitable for a minority of traders. Most retail traders lose money. That is not a secret. Brokers in the European Union must disclose the

Read More

Understanding What Is Price Action Trading in 2026

What is price action trading and why do institutional traders rely on it while most retail traders still lose money with indicators? Price action trading is the method of making trading decisions based entirely on the market’s price chart. No lagging indicators, moving averages. No RSI or MACD cluttering the

Read More

What Is Revenge Trading And How To Prevent It In Forex

ABOUT THIS GUIDE Written by Ezekiel Chew, founder of Asia Forex Mentor and a former bank trader with over 20 years of experience. Ezekiel has coached more than 100,000 students across Singapore, the Philippines, Malaysia, Indonesia, and over 50 countries through the AFM One Core Program. Revenge trading is one

Read More

What Is a Stop Loss Before You Lose Another Trade

What is a stop loss? It is the one trading instruction that separates traders who survive from those who blow their accounts. Most traders understand the concept. Far fewer use it correctly. A stop loss is not just a safety net. It is a pre-defined decision made before emotion enters

Read More

7 Best Trading Strategies That Actually Work in 2026

Most traders cycle through the best trading strategies they find online — and still blow their accounts within six months. The trading strategy itself is rarely the problem. The problem is how it gets taught. Most sources strip out the institutional logic, skip the risk management, and hand over a

Read More

AFM Trading Summit Live

Date: Coming Soon

Join us at the AFM Trading Summit Live and learn from top industry experts through live trading sessions, market insights, and actionable strategies.

Top Down Analysis and Why Most Traders Still Get It Wrong

4.0
Overall Trust Index

Written by:

Updated:

May 26, 2026

Hey, what's up guys? It's Ezekiel Chew here.

So if you ever wanted to stop reacting to every small candle movement and actually understand where the market is likely to move before it actually gets there, you are going to love this. Because today I'm breaking down the exact top down analysis framework that I use to align the higher time frame structure with the lower time frame execution. No more trading the five minute noise out there. No more guessing the direction. No more entering against the bigger trend without you realizing it. Just a clear structured process that's going to show you where all the real key levels are sitting, who is in control on the higher time frame, and how to time your entry precisely on the lower time frame. When you analyze from the top down, the market stops feeling chaotic. It starts feeling organized. You are going to know the direction. You are going to know when to execute the trade. Once you see how these time frames connect, your trading is going to start feeling calculated. It's not going to feel random anymore. 📺 Watch the full breakdown in this video: https://youtu.be/L0A1N7o0mzE?si=0TwHAdY9RTUoNtAC

What Top Down Analysis Actually Does

Top down analysis is a systematic approach used by professional traders, especially in forex trading, to gain a macro view of the market by first examining broad economic and market factors before narrowing down to specific trades. It’s like looking at the big picture first, and then we drill down to identify all the key areas and trends that matter the most. This method allows traders to avoid getting lost in the noise of the lower time frames and helps them make informed trading decisions by connecting macroeconomic factors to specific trading opportunities. Now that we have touched the basics of what it is, I’m going to break down how this method actually works and why it’s crucial for your trading strategy.

STEP 1: Multi-Timeframe Market Breakdown

The Multi Time Frame Market Breakdown in Forex Trading strategies To trade effectively, you need to start with the bigger picture by analyzing higher timeframes, such as monthly or weekly charts. Using charts at these levels allows you to identify major trends and determine key support and resistance zones. Top down analysis is like looking at a map. You start by getting the overall view from a high vantage point using higher timeframes and long-term charts and then zoom into the details. It helps us see the market’s big picture first by using charts to spot the overall trend and important levels. Higher timeframe confirmation almost always trumps lower timeframe signals, and professional traders generally plot key macro zones on higher timeframes while keeping lower charts clean to focus on entry criteria. Once we get that, we’re going to break things down by moving to the smaller time frames, like the one hour or the 15 minute chart. This is where we pinpoint all the perfect entry points. The power of this method lies in how the higher time frame gives us a clear sense of the market direction and all the crucial levels. But here’s the thing. If you start with the monthly chart And then you try to apply all your knowledge at once, it’s going to be very easy to get overwhelmed with too much information. This makes finding a clean setup a challenge. The key is knowing what to focus on for each time frame so our analysis stays sharp. Avoiding the Confusion About Market Structure and Direction Why does this approach matter? Let’s start with the first major advantage, which is avoiding the confusion about the market direction. Let’s say we are looking at the five minute chart. It’s probably going to be a bit of a mess, with price swinging back and forth, up and down in both directions. There is no clear trend. The market is figuring out the direction. And for us, it feels like a guessing game. Should we buy? Should we sell? Where’s the direction? But when we zoom out to the one hour chart, the bigger picture becomes clear. We quickly see the overall trend. And we would probably notice that there is bearish pressure taking over. Once we spot that, we can move forward with more confidence, knowing that taking a short position makes sense in this case. If you find yourself getting lost in all these short term movements, it’s likely that you are focused on the wrong time frame. Many traders fall into common pitfalls such as analysis paralysis, cluttering charts with too many indicators, and ignoring time-frame alignment, which can lead to confusion and poor trading decisions. Now the second major benefit is for us to boost our accuracy. A small price movement, like a slight reaction to a key level from a higher time frame, can signal a trend shift on a smaller time frame. Before we dive into any trade, we want to understand how much room price has to move before it hits the important areas like the supply and demand zones. This way we can avoid jumping into trades too early or jumping into trades too late, where there's no more room for the move. This gives us control over our targets, our take profit targets, and also where our stop loss is going to be. Ultimately, it's going to reduce our chances of losing trades or taking bad trades altogether. Take a look at this, On the 15 minute chart we see a strong bullish move that left behind a pretty clear fair value gap. At first glance, this looks like a perfect setup to go long. To buy. But then out of nowhere, the market flipped and reversed. Why did this happen? When we zoom out to the one hour time frame, it becomes clear why. The reversal happened because price hit a key resistance level, one that acted as resistance multiple times before. This is exactly why checking the higher time frame is so important before we even take a trade. It helps us avoid setups like this that don't line up with the bigger picture. By checking the key levels on the higher time frame, we're going to avoid all this unnecessary risk. Here's another example. On the one hour chart, price broke above the previous market structure. It created a move with some inefficiency. Price now pulls back to the order block zone. It sets up a perfect long opportunity. We can confidently place our stop loss below the swing low, and then we can target the next key level for our take profit. But again, none of this would be possible if we didn't first analyze the market from the higher time frame perspective. By analyzing multiple time frames, we can combine higher timeframe levels with lower timeframes to align short-term trades with the overall trend and create the best trading setup. For example, on the four hour chart, we see that demand is in control, With price breaking above all the key supply areas. This gives us confidence to enter the trade, knowing that there’s enough room for price to move before reaching the next level. The next unmitigated supply zone. However, cluttering multi-time-frame charts with too many indicators can obscure actual price action and make it difficult to identify market structure clearly. This is a perfect example of how multiple time frame analysis can help us spot high quality setups with a good risk to reward ratio. Keep in mind that overtrading, especially on lower timeframes, can silently erode returns due to transaction costs, even for traders with a high win rate. Now let’s dive into our entries and how we can optimize them. Now that we have analyzed the multiple time frames, we can pinpoint the best potential entry points and exit points by using technical indicators and market structure. For example, let’s say we are waiting for price to pull back to an order flow area. We are looking to open long positions to buy in line with the overall bullish momentum that we saw. If we place our buy orders too early, our stop loss is going to end up being too far off. Too big. Too wide. Setting stop loss is a key part of risk management, helping to control potential losses if the trade goes against us. Instead, we want to focus on getting confirmation from the lower time frame. This way, we can enter trades at a more favorable pricing, using technical indicators to validate our entries and exits. This lowers our chances of false signals and overall gives us confidence as a whole. For example, entering precisely in the lower time frame at the lower time frame order block area. Or trading at the break of structure, the change of character in the lower time frame. This tells us that the momentum has changed from a downtrend into an uptrend. And it is time to get in right there in the lower time frame itself. This is precise entry. By using multiple time frame analysis, we can now align our entries in the lower time frame with the broader time frame market trend. This gives us way better risk to reward because our profit target is at the higher time frame level, our entry is precise where the market has actually moved and momentum has actually kicked off, and our stop loss is at the lower time frame area. This gives us an insane risk to reward ratio. But let’s keep this in mind. This step alone will not guarantee success. Risk management is the foundation of trading, yet many traders focus more on producing profits than on how much capital they are risking on each trade. Effective risk management is crucial in forex trading, as it helps in setting appropriate stop-loss levels and take-profit targets based on market structure and trend analysis. What is just as important is understanding where the institutional money is flowing. This is our next step. The smart money concept comes into play. It helps us spot high probability setups by reading the market like a pro. The market’s true direction lies in key levels. Following the smart money is going to show us where it is really going.

STEP 2: Smart Money Concepts

When we zoom in on the four hour chart, you can start to see it. The weekly and daily levels are acting as key support and resistance levels identified on higher timeframes. These resistance levels and key support zones serve as crucial barriers where price often reacts, reverses, or pauses. It’s almost like the market has all these invisible lines that it keeps respecting. When we spot these support and resistance levels, it gives us a clearer view of where price might go next. These levels are key because they show us where price might react, whether it is reversing at the area or breaking through the area. How do we use these levels to our advantage? We’re going to tackle them in two main ways. First, when price breaks above or below a key level, this gives us a clear signal about which side, demand or supply, is in control. This helps us get a sense of whether price will continue to push toward the next level. Second, we will use these support and resistance levels to set our stop loss and take profit targets. We plan our entries and our exits at these key levels. Now we are trading in line with the market structure. This is where the smart money concept comes into play. We use this concept to get a grip of the market direction first. We know the overall direction and the confirmation area and then all the potential trade opportunities. When you see that the market is breaking below a key daily level and there is strong momentum, it’s a clear signal that the supply, the sellers, are in control. This gives us the green light to start looking for opportunities to sell. When the market makes an inefficient move, this creates a fair value gap. And then it follows with a break of structure. This is where we pay attention. Because the market is moving with purpose now. It’s not just random anymore. At this point, the candle that caused the inefficiency becomes our order block zone. This could set up a potential short entry. But we do not want to rush in. We do not want to place a sell order without any proper confirmation. Because price has already reached a key daily level, which could be a turning point for a short term downtrend. Analyzing the daily chart is crucial here, as it helps us understand overall price movements and avoid being misled by short term fluctuations that can cause impulsive decisions. Waiting for confirmation helps traders avoid acting on emotions or reacting to temporary market noise. This is why we need to be patient. We want to wait for bearish confirmation on the lower time frame, like the 15 minute chart, before we jump into any short positions. Now on the other hand, if price breaks above the daily and the weekly levels, this indicates strong bullish momentum. In that case, we expect price to push higher and test the next weekly level. We will move on to the one hour chart. We are still going to apply the smart money concept here, which is especially relevant when trading currency pairs. In analysis in forex, it's crucial to examine both macroeconomic factors and technical patterns to inform trading decisions. Here’s what happens, after price mitigates the daily zone, it forms a liquidity zone along the way. These liquidity zones are key because they indicate where the buyers and the sellers might have placed their stop losses or pending orders. This gives us the clue of where price might be headed next. Price is in a short term uptrend. But the best case would be for it to reverse with both the four hour and the one hour showing a bearish bias. When both time frames match, we’re going to be a lot more confident in our trade. Here’s an important step. When we are looking at a four hour order block, we’re going to check for confirmation on the smaller time frame. We want to jump to the smaller time frame, like the 15 minute chart. This is where we look for confirmation. And if you are looking at a one hour order block, then you jump into the five minute chart for more precise entry points. The 15 minute chart is the final step in this process. We don’t jump in blindly. Successful trading strategies involve a systematic approach with predefined rules for entries, exits, and risk management to avoid emotional decisions. Disciplined traders establish these rules before executing trades, helping them maintain consistency and discipline. We wait for price to enter the order block zone that we have marked and then it shows a change in direction. This confirms that the uptrend is ending and the market is likely to move down. If you do not see a change in trend, you skip the trade. Now, our first target is on the daily level in front of the price itself. If price breaks the level, we would see price potentially moving towards the next weekly level. The smart money concept pinpoints where all the institutional money is flowing. This gives us all the high probability setups. By understanding all the key levels and then waiting for confirmation in the lower time frame, we’re going to ensure that our trades are aligned with the bigger market structure.

Conclusion

Top down analysis is not just about switching time frames. It’s about building alignment. The higher time frame gives us the direction. The middle time frame gives us the structure. The lower time frame gives us the precision for entry. When these three connect, the market stops feeling noisy. We are no longer reacting to every five minute candle movement. We are now trading with a defined roadmap. And then we layer the smart money concepts on top. We are not just trading the direction. We are now trading the intent in the market itself. We know where all the liquidity sits. We know where the institutions are likely positioning themselves and where price is most likely going to react next. This is the difference. Most traders start at the bottom and get lost in the noise, all the lower time frame noise. But when you start from the top down, you’re trading with the actual context in the market. You’re trading with confirmation. And you trade with confidence. This is how we as professionals stay aligned with the market instead of fighting against it. Successful traders think first about protecting capital and always consider worst-case scenarios before making trading decisions. Once you build this habit into your process, your trading is going to feel calculated. It’s not going to feel random anymore.

What To Do Next

This is the same system I use myself and the same one that has helped thousands of traders move from frustration to consistency. I’m giving it to you for free. No fluff. No filler. Just pure strategy. Click the link and I’ll see you inside the training. 👉 FREE 3 Step Training: The Setup I Use Before Every Trade

Frequently Asked Questions

What is top down analysis in trading

Top down analysis is a method that starts with the higher time frames to identify the overall market direction and key levels, then moves down to the lower time frames to find precise entry points. It helps traders avoid getting lost in lower time frame noise and trade in alignment with the bigger market structure. This approach is especially useful in the forex market, where understanding the bigger picture and macroeconomic factors is crucial for trading success.

Which time frames work best for top down analysis

The most effective combination starts with the weekly charts, which are essential for identifying long-term trends and key support and resistance levels. From there, use the daily or four hour chart for direction, the one hour chart for structure and key levels, and the 15 minute or five minute chart for precise entries and confirmation. This top-down approach can also be applied to futures contracts, where analyzing higher timeframes helps manage risk and timing. This gives a clear roadmap from the big picture down to execution.

How does top down analysis improve risk to reward

Top down analysis places profit targets at higher time frame levels where price has more room to run. It places stop losses at lower time frame areas where entries are precise. This combination creates significantly better risk to reward ratios compared to trading a single time frame. Additionally, optimizing your risk to reward also requires careful management of your account size and factoring in the costs of borrowed capital, such as margin interest, to ensure that trading decisions remain profitable and sustainable.

What role do smart money concepts play in top down analysis

Smart money concepts help traders identify where institutional money is flowing by reading key levels, fair value gaps, order blocks, and breaks of structure. In top down analysis, traders also consider central bank policies and interest rates as key macroeconomic factors, since these influence currency movements and overall market trends. Layering smart money on top of multi time frame analysis turns a directional trade into one backed by institutional intent and confirmation.

What happens if there is no confirmation on the lower time frame

The trade gets skipped. No confirmation means no entry. Waiting for a clear change of character or break of structure on the lower time frame protects traders from false signals and keeps every trade aligned with the higher time frame direction. Waiting for confirmation before you start trading also helps protect your profits by reducing the risk of premature entries. Remember, past performance does not guarantee future results; disciplined execution and risk management are essential for long-term trading success.

ezekiel chew asiaforexmentor

About Ezekiel Chew

Ezekiel Chew, founder and head of training at Asia Forex Mentor, is a renowned forex expert, frequently invited to speak at major industry events. Known for his deep market insights, Ezekiel is one of the top traders committed to supporting the trading community. Making six figures per trade, he also trains traders working in banks, fund management, and prop trading firms.

RELATED ARTICLES

Top Down Analysis and Why Most Traders Still Get It Wrong

4.0
Overall Trust Index

Written by:

Updated:

May 26, 2026

Hey, what's up guys? It's Ezekiel Chew here.

So if you ever wanted to stop reacting to every small candle movement and actually understand where the market is likely to move before it actually gets there, you are going to love this. Because today I'm breaking down the exact top down analysis framework that I use to align the higher time frame structure with the lower time frame execution. No more trading the five minute noise out there. No more guessing the direction. No more entering against the bigger trend without you realizing it. Just a clear structured process that's going to show you where all the real key levels are sitting, who is in control on the higher time frame, and how to time your entry precisely on the lower time frame. When you analyze from the top down, the market stops feeling chaotic. It starts feeling organized. You are going to know the direction. You are going to know when to execute the trade. Once you see how these time frames connect, your trading is going to start feeling calculated. It's not going to feel random anymore. 📺 Watch the full breakdown in this video: https://youtu.be/L0A1N7o0mzE?si=0TwHAdY9RTUoNtAC

What Top Down Analysis Actually Does

Top down analysis is a systematic approach used by professional traders, especially in forex trading, to gain a macro view of the market by first examining broad economic and market factors before narrowing down to specific trades. It’s like looking at the big picture first, and then we drill down to identify all the key areas and trends that matter the most. This method allows traders to avoid getting lost in the noise of the lower time frames and helps them make informed trading decisions by connecting macroeconomic factors to specific trading opportunities. Now that we have touched the basics of what it is, I’m going to break down how this method actually works and why it’s crucial for your trading strategy.

STEP 1: Multi-Timeframe Market Breakdown

The Multi Time Frame Market Breakdown in Forex Trading strategies To trade effectively, you need to start with the bigger picture by analyzing higher timeframes, such as monthly or weekly charts. Using charts at these levels allows you to identify major trends and determine key support and resistance zones. Top down analysis is like looking at a map. You start by getting the overall view from a high vantage point using higher timeframes and long-term charts and then zoom into the details. It helps us see the market’s big picture first by using charts to spot the overall trend and important levels. Higher timeframe confirmation almost always trumps lower timeframe signals, and professional traders generally plot key macro zones on higher timeframes while keeping lower charts clean to focus on entry criteria. Once we get that, we’re going to break things down by moving to the smaller time frames, like the one hour or the 15 minute chart. This is where we pinpoint all the perfect entry points. The power of this method lies in how the higher time frame gives us a clear sense of the market direction and all the crucial levels. But here’s the thing. If you start with the monthly chart And then you try to apply all your knowledge at once, it’s going to be very easy to get overwhelmed with too much information. This makes finding a clean setup a challenge. The key is knowing what to focus on for each time frame so our analysis stays sharp. Avoiding the Confusion About Market Structure and Direction Why does this approach matter? Let’s start with the first major advantage, which is avoiding the confusion about the market direction. Let’s say we are looking at the five minute chart. It’s probably going to be a bit of a mess, with price swinging back and forth, up and down in both directions. There is no clear trend. The market is figuring out the direction. And for us, it feels like a guessing game. Should we buy? Should we sell? Where’s the direction? But when we zoom out to the one hour chart, the bigger picture becomes clear. We quickly see the overall trend. And we would probably notice that there is bearish pressure taking over. Once we spot that, we can move forward with more confidence, knowing that taking a short position makes sense in this case. If you find yourself getting lost in all these short term movements, it’s likely that you are focused on the wrong time frame. Many traders fall into common pitfalls such as analysis paralysis, cluttering charts with too many indicators, and ignoring time-frame alignment, which can lead to confusion and poor trading decisions. Now the second major benefit is for us to boost our accuracy. A small price movement, like a slight reaction to a key level from a higher time frame, can signal a trend shift on a smaller time frame. Before we dive into any trade, we want to understand how much room price has to move before it hits the important areas like the supply and demand zones. This way we can avoid jumping into trades too early or jumping into trades too late, where there's no more room for the move. This gives us control over our targets, our take profit targets, and also where our stop loss is going to be. Ultimately, it's going to reduce our chances of losing trades or taking bad trades altogether. Take a look at this, On the 15 minute chart we see a strong bullish move that left behind a pretty clear fair value gap. At first glance, this looks like a perfect setup to go long. To buy. But then out of nowhere, the market flipped and reversed. Why did this happen? When we zoom out to the one hour time frame, it becomes clear why. The reversal happened because price hit a key resistance level, one that acted as resistance multiple times before. This is exactly why checking the higher time frame is so important before we even take a trade. It helps us avoid setups like this that don't line up with the bigger picture. By checking the key levels on the higher time frame, we're going to avoid all this unnecessary risk. Here's another example. On the one hour chart, price broke above the previous market structure. It created a move with some inefficiency. Price now pulls back to the order block zone. It sets up a perfect long opportunity. We can confidently place our stop loss below the swing low, and then we can target the next key level for our take profit. But again, none of this would be possible if we didn't first analyze the market from the higher time frame perspective. By analyzing multiple time frames, we can combine higher timeframe levels with lower timeframes to align short-term trades with the overall trend and create the best trading setup. For example, on the four hour chart, we see that demand is in control, With price breaking above all the key supply areas. This gives us confidence to enter the trade, knowing that there’s enough room for price to move before reaching the next level. The next unmitigated supply zone. However, cluttering multi-time-frame charts with too many indicators can obscure actual price action and make it difficult to identify market structure clearly. This is a perfect example of how multiple time frame analysis can help us spot high quality setups with a good risk to reward ratio. Keep in mind that overtrading, especially on lower timeframes, can silently erode returns due to transaction costs, even for traders with a high win rate. Now let’s dive into our entries and how we can optimize them. Now that we have analyzed the multiple time frames, we can pinpoint the best potential entry points and exit points by using technical indicators and market structure. For example, let’s say we are waiting for price to pull back to an order flow area. We are looking to open long positions to buy in line with the overall bullish momentum that we saw. If we place our buy orders too early, our stop loss is going to end up being too far off. Too big. Too wide. Setting stop loss is a key part of risk management, helping to control potential losses if the trade goes against us. Instead, we want to focus on getting confirmation from the lower time frame. This way, we can enter trades at a more favorable pricing, using technical indicators to validate our entries and exits. This lowers our chances of false signals and overall gives us confidence as a whole. For example, entering precisely in the lower time frame at the lower time frame order block area. Or trading at the break of structure, the change of character in the lower time frame. This tells us that the momentum has changed from a downtrend into an uptrend. And it is time to get in right there in the lower time frame itself. This is precise entry. By using multiple time frame analysis, we can now align our entries in the lower time frame with the broader time frame market trend. This gives us way better risk to reward because our profit target is at the higher time frame level, our entry is precise where the market has actually moved and momentum has actually kicked off, and our stop loss is at the lower time frame area. This gives us an insane risk to reward ratio. But let’s keep this in mind. This step alone will not guarantee success. Risk management is the foundation of trading, yet many traders focus more on producing profits than on how much capital they are risking on each trade. Effective risk management is crucial in forex trading, as it helps in setting appropriate stop-loss levels and take-profit targets based on market structure and trend analysis. What is just as important is understanding where the institutional money is flowing. This is our next step. The smart money concept comes into play. It helps us spot high probability setups by reading the market like a pro. The market’s true direction lies in key levels. Following the smart money is going to show us where it is really going.

STEP 2: Smart Money Concepts

When we zoom in on the four hour chart, you can start to see it. The weekly and daily levels are acting as key support and resistance levels identified on higher timeframes. These resistance levels and key support zones serve as crucial barriers where price often reacts, reverses, or pauses. It’s almost like the market has all these invisible lines that it keeps respecting. When we spot these support and resistance levels, it gives us a clearer view of where price might go next. These levels are key because they show us where price might react, whether it is reversing at the area or breaking through the area. How do we use these levels to our advantage? We’re going to tackle them in two main ways. First, when price breaks above or below a key level, this gives us a clear signal about which side, demand or supply, is in control. This helps us get a sense of whether price will continue to push toward the next level. Second, we will use these support and resistance levels to set our stop loss and take profit targets. We plan our entries and our exits at these key levels. Now we are trading in line with the market structure. This is where the smart money concept comes into play. We use this concept to get a grip of the market direction first. We know the overall direction and the confirmation area and then all the potential trade opportunities. When you see that the market is breaking below a key daily level and there is strong momentum, it’s a clear signal that the supply, the sellers, are in control. This gives us the green light to start looking for opportunities to sell. When the market makes an inefficient move, this creates a fair value gap. And then it follows with a break of structure. This is where we pay attention. Because the market is moving with purpose now. It’s not just random anymore. At this point, the candle that caused the inefficiency becomes our order block zone. This could set up a potential short entry. But we do not want to rush in. We do not want to place a sell order without any proper confirmation. Because price has already reached a key daily level, which could be a turning point for a short term downtrend. Analyzing the daily chart is crucial here, as it helps us understand overall price movements and avoid being misled by short term fluctuations that can cause impulsive decisions. Waiting for confirmation helps traders avoid acting on emotions or reacting to temporary market noise. This is why we need to be patient. We want to wait for bearish confirmation on the lower time frame, like the 15 minute chart, before we jump into any short positions. Now on the other hand, if price breaks above the daily and the weekly levels, this indicates strong bullish momentum. In that case, we expect price to push higher and test the next weekly level. We will move on to the one hour chart. We are still going to apply the smart money concept here, which is especially relevant when trading currency pairs. In analysis in forex, it's crucial to examine both macroeconomic factors and technical patterns to inform trading decisions. Here’s what happens, after price mitigates the daily zone, it forms a liquidity zone along the way. These liquidity zones are key because they indicate where the buyers and the sellers might have placed their stop losses or pending orders. This gives us the clue of where price might be headed next. Price is in a short term uptrend. But the best case would be for it to reverse with both the four hour and the one hour showing a bearish bias. When both time frames match, we’re going to be a lot more confident in our trade. Here’s an important step. When we are looking at a four hour order block, we’re going to check for confirmation on the smaller time frame. We want to jump to the smaller time frame, like the 15 minute chart. This is where we look for confirmation. And if you are looking at a one hour order block, then you jump into the five minute chart for more precise entry points. The 15 minute chart is the final step in this process. We don’t jump in blindly. Successful trading strategies involve a systematic approach with predefined rules for entries, exits, and risk management to avoid emotional decisions. Disciplined traders establish these rules before executing trades, helping them maintain consistency and discipline. We wait for price to enter the order block zone that we have marked and then it shows a change in direction. This confirms that the uptrend is ending and the market is likely to move down. If you do not see a change in trend, you skip the trade. Now, our first target is on the daily level in front of the price itself. If price breaks the level, we would see price potentially moving towards the next weekly level. The smart money concept pinpoints where all the institutional money is flowing. This gives us all the high probability setups. By understanding all the key levels and then waiting for confirmation in the lower time frame, we’re going to ensure that our trades are aligned with the bigger market structure.

Conclusion

Top down analysis is not just about switching time frames. It’s about building alignment. The higher time frame gives us the direction. The middle time frame gives us the structure. The lower time frame gives us the precision for entry. When these three connect, the market stops feeling noisy. We are no longer reacting to every five minute candle movement. We are now trading with a defined roadmap. And then we layer the smart money concepts on top. We are not just trading the direction. We are now trading the intent in the market itself. We know where all the liquidity sits. We know where the institutions are likely positioning themselves and where price is most likely going to react next. This is the difference. Most traders start at the bottom and get lost in the noise, all the lower time frame noise. But when you start from the top down, you’re trading with the actual context in the market. You’re trading with confirmation. And you trade with confidence. This is how we as professionals stay aligned with the market instead of fighting against it. Successful traders think first about protecting capital and always consider worst-case scenarios before making trading decisions. Once you build this habit into your process, your trading is going to feel calculated. It’s not going to feel random anymore.

What To Do Next

This is the same system I use myself and the same one that has helped thousands of traders move from frustration to consistency. I’m giving it to you for free. No fluff. No filler. Just pure strategy. Click the link and I’ll see you inside the training. 👉 FREE 3 Step Training: The Setup I Use Before Every Trade

Frequently Asked Questions

What is top down analysis in trading

Top down analysis is a method that starts with the higher time frames to identify the overall market direction and key levels, then moves down to the lower time frames to find precise entry points. It helps traders avoid getting lost in lower time frame noise and trade in alignment with the bigger market structure. This approach is especially useful in the forex market, where understanding the bigger picture and macroeconomic factors is crucial for trading success.

Which time frames work best for top down analysis

The most effective combination starts with the weekly charts, which are essential for identifying long-term trends and key support and resistance levels. From there, use the daily or four hour chart for direction, the one hour chart for structure and key levels, and the 15 minute or five minute chart for precise entries and confirmation. This top-down approach can also be applied to futures contracts, where analyzing higher timeframes helps manage risk and timing. This gives a clear roadmap from the big picture down to execution.

How does top down analysis improve risk to reward

Top down analysis places profit targets at higher time frame levels where price has more room to run. It places stop losses at lower time frame areas where entries are precise. This combination creates significantly better risk to reward ratios compared to trading a single time frame. Additionally, optimizing your risk to reward also requires careful management of your account size and factoring in the costs of borrowed capital, such as margin interest, to ensure that trading decisions remain profitable and sustainable.

What role do smart money concepts play in top down analysis

Smart money concepts help traders identify where institutional money is flowing by reading key levels, fair value gaps, order blocks, and breaks of structure. In top down analysis, traders also consider central bank policies and interest rates as key macroeconomic factors, since these influence currency movements and overall market trends. Layering smart money on top of multi time frame analysis turns a directional trade into one backed by institutional intent and confirmation.

What happens if there is no confirmation on the lower time frame

The trade gets skipped. No confirmation means no entry. Waiting for a clear change of character or break of structure on the lower time frame protects traders from false signals and keeps every trade aligned with the higher time frame direction. Waiting for confirmation before you start trading also helps protect your profits by reducing the risk of premature entries. Remember, past performance does not guarantee future results; disciplined execution and risk management are essential for long-term trading success.
ezekiel chew asiaforexmentor

About Ezekiel Chew

Ezekiel Chew, founder and head of training at Asia Forex Mentor, is a renowned forex expert, frequently invited to speak at major industry events. Known for his deep market insights, Ezekiel is one of the top traders committed to supporting the trading community. Making six figures per trade, he also trains traders working in banks, fund management, and prop trading firms.

RELATED ARTICLES

Join the Live Event
Get Your Free Ticket Now

I consent to receiving emails and/or text message reminders for this event.

REGISTER FOR THE MASTERCLASS!